Alerts
Detect and resolve systemic issues with robust alerting built for modern observability.

Personalize Notifications
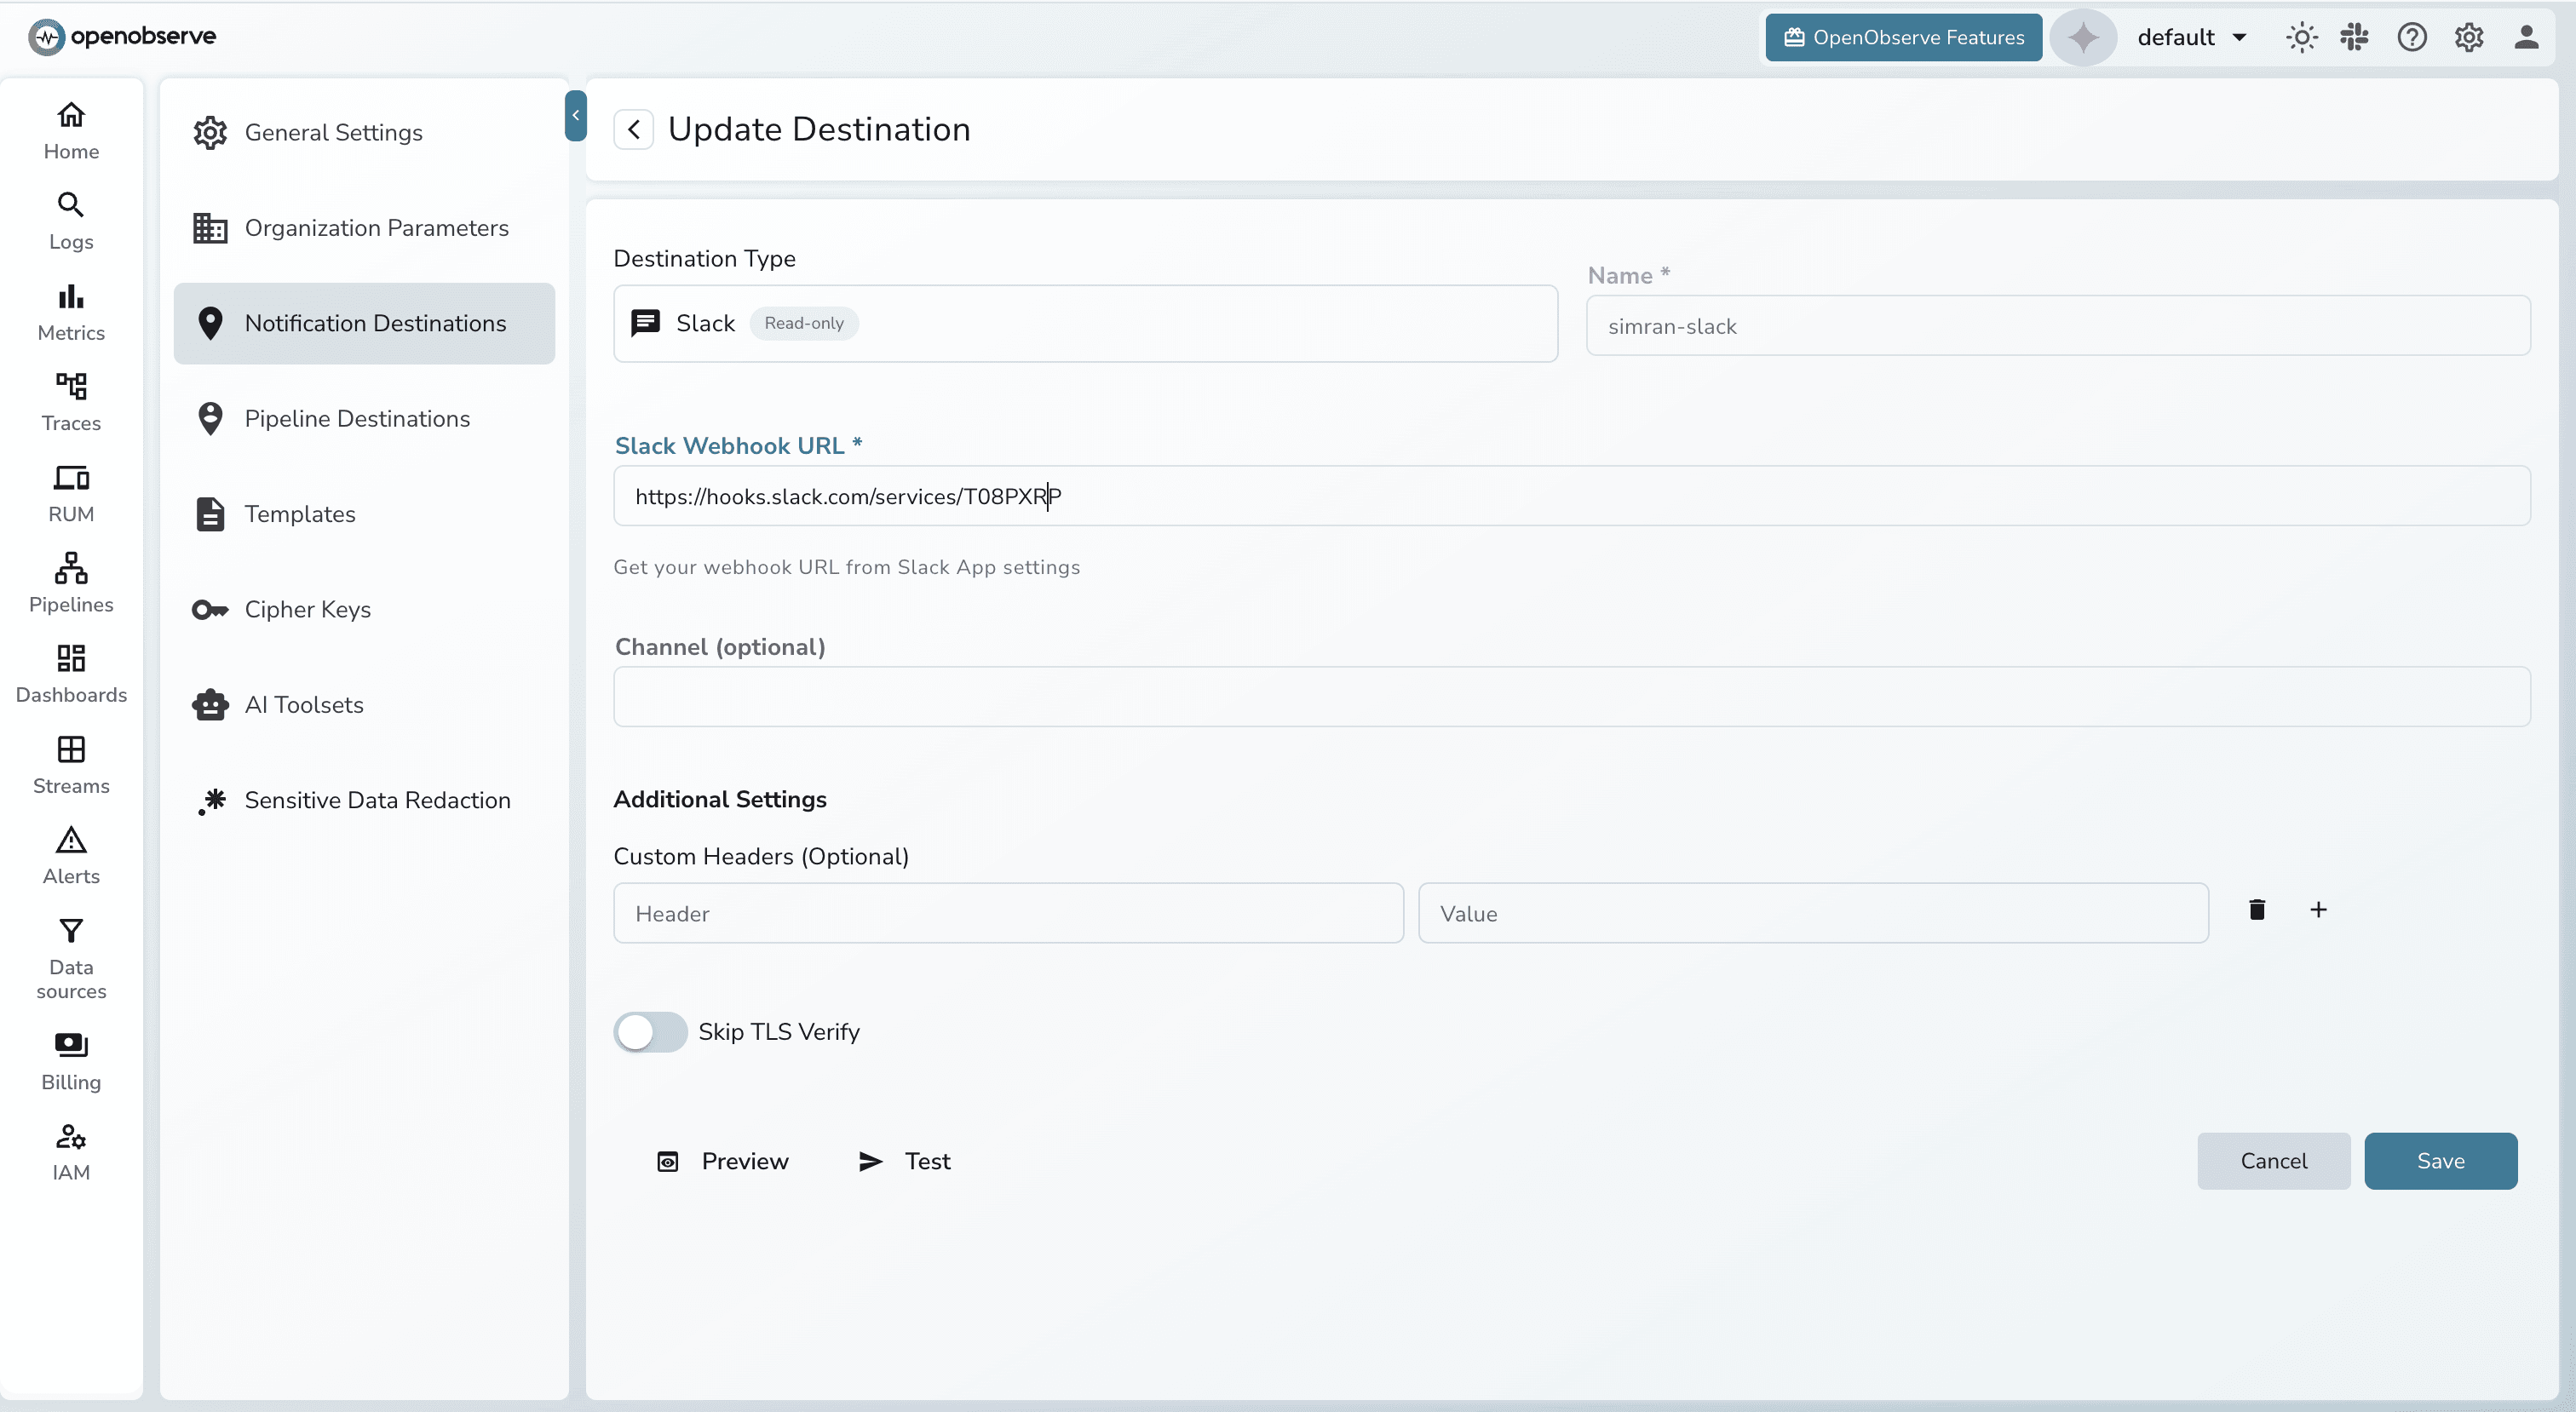
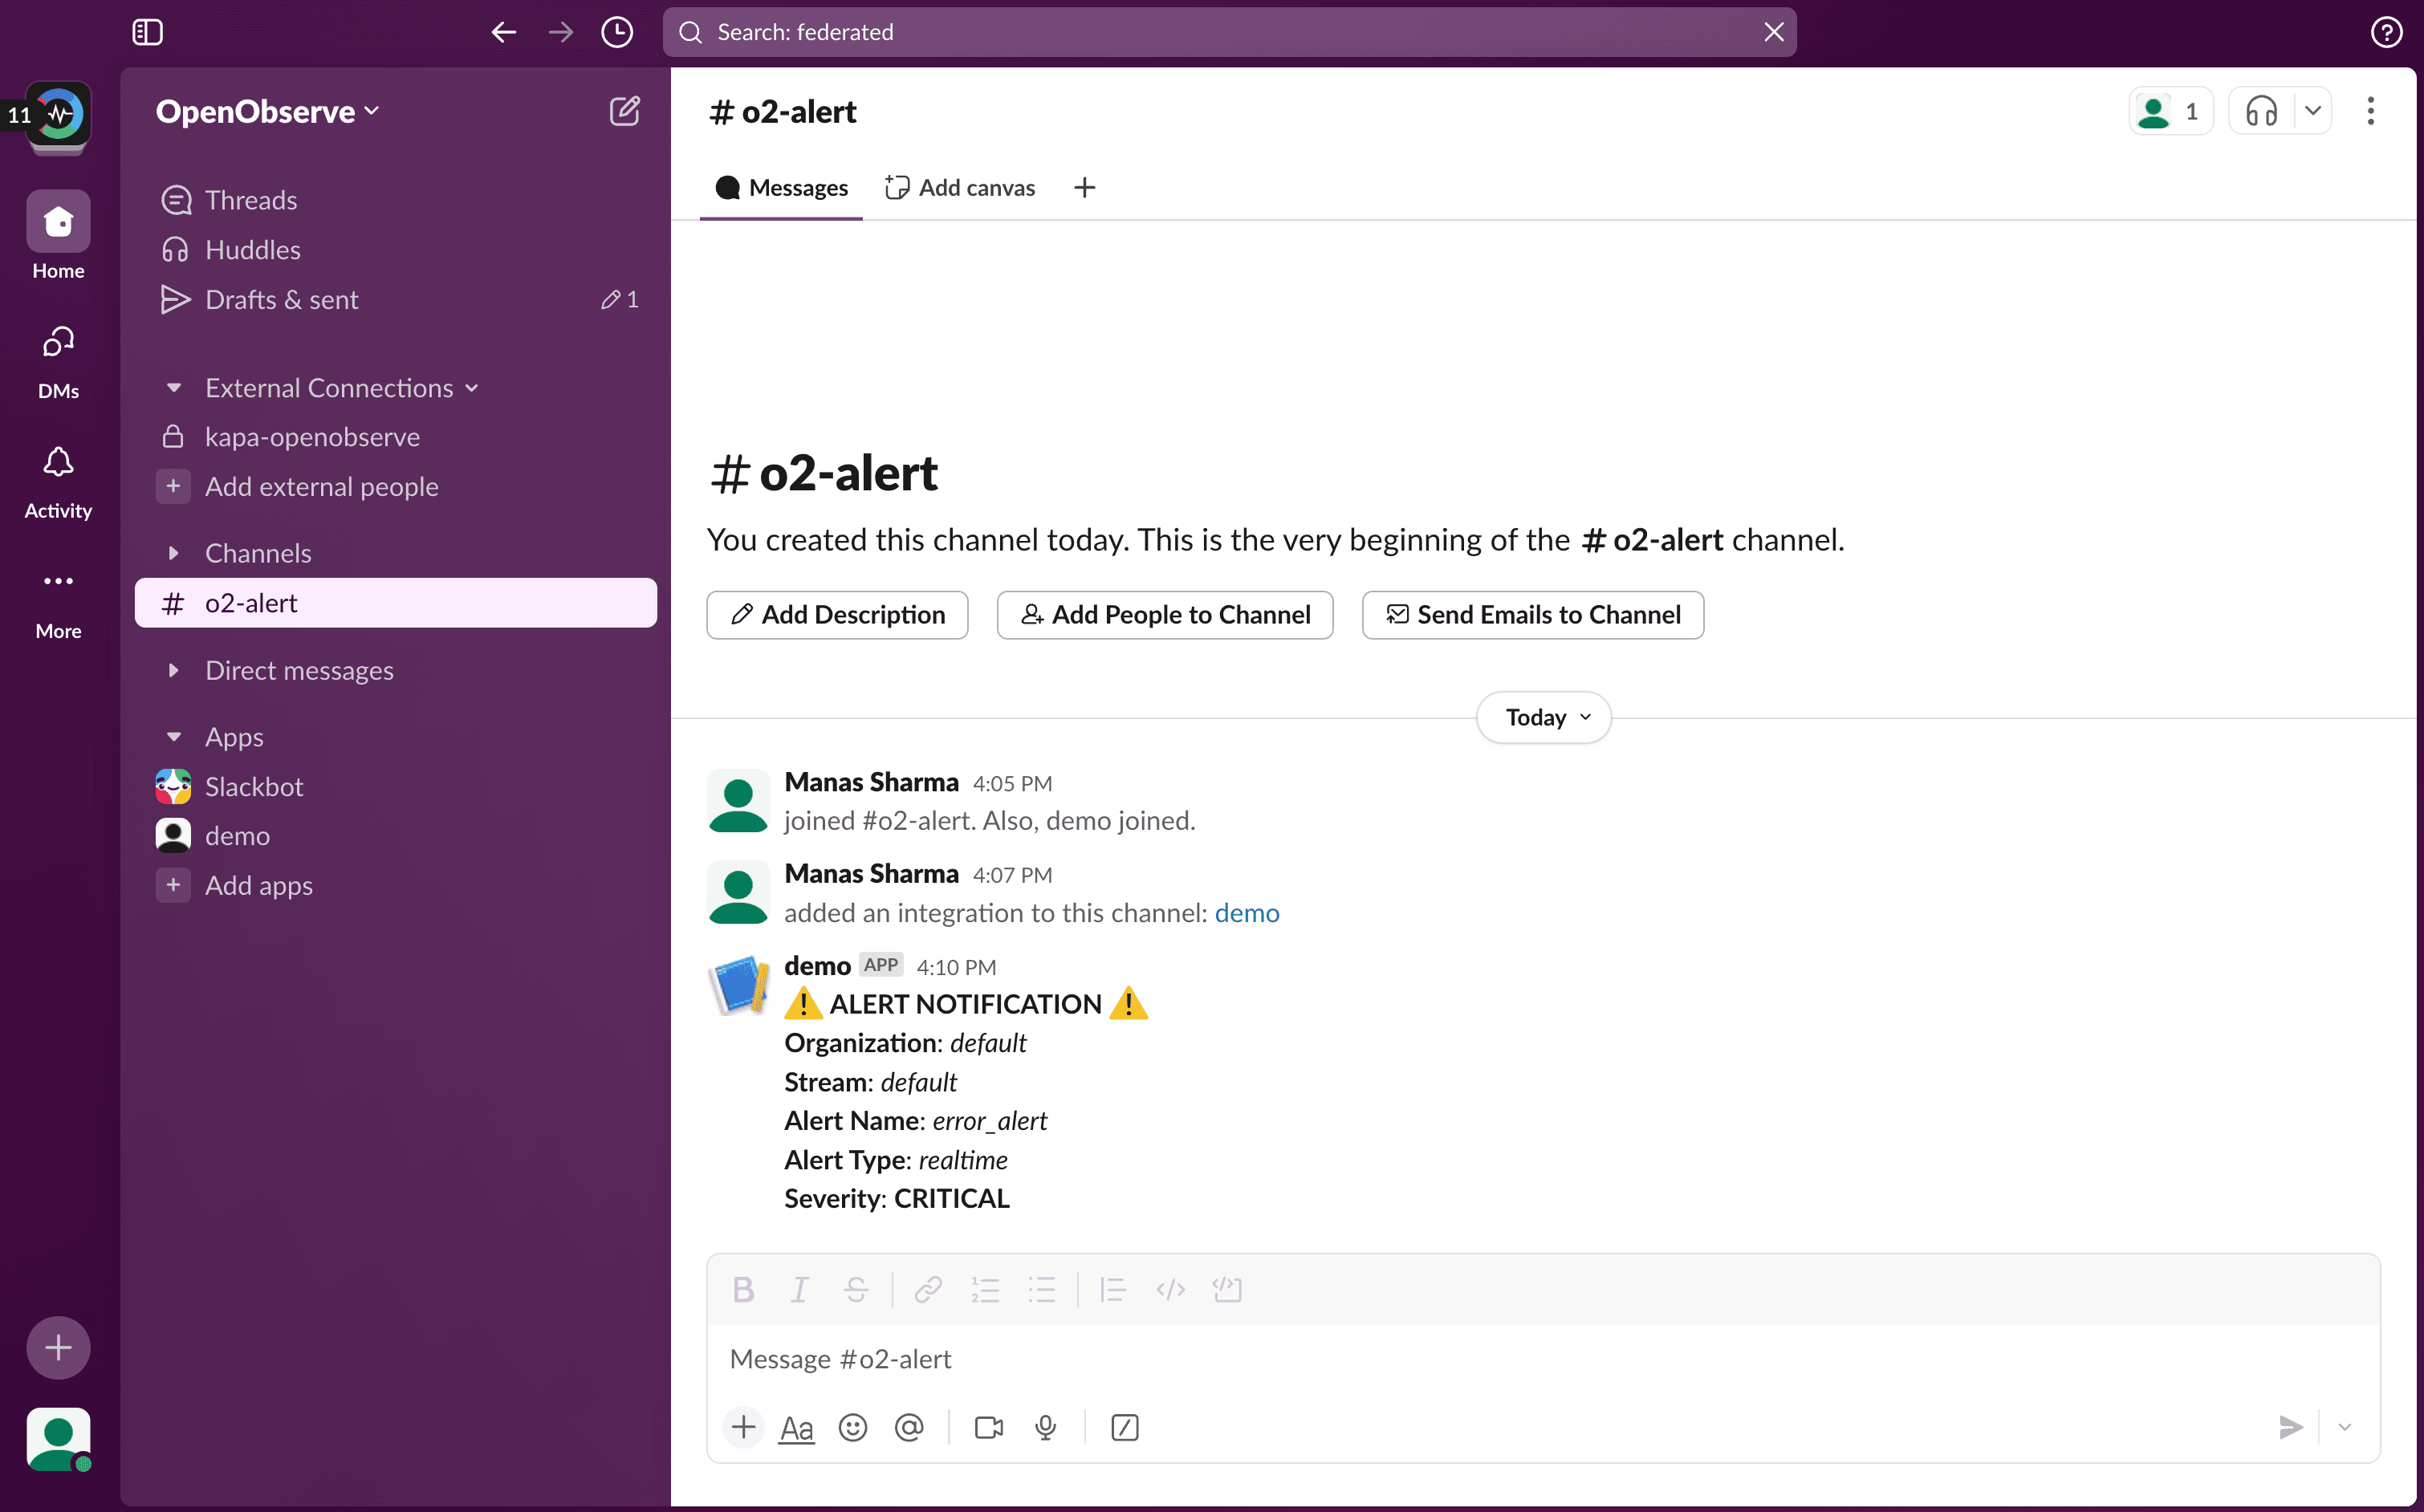
Send notifications to email, Slack, or webhook endpoints for immediate action
Multilingual Support
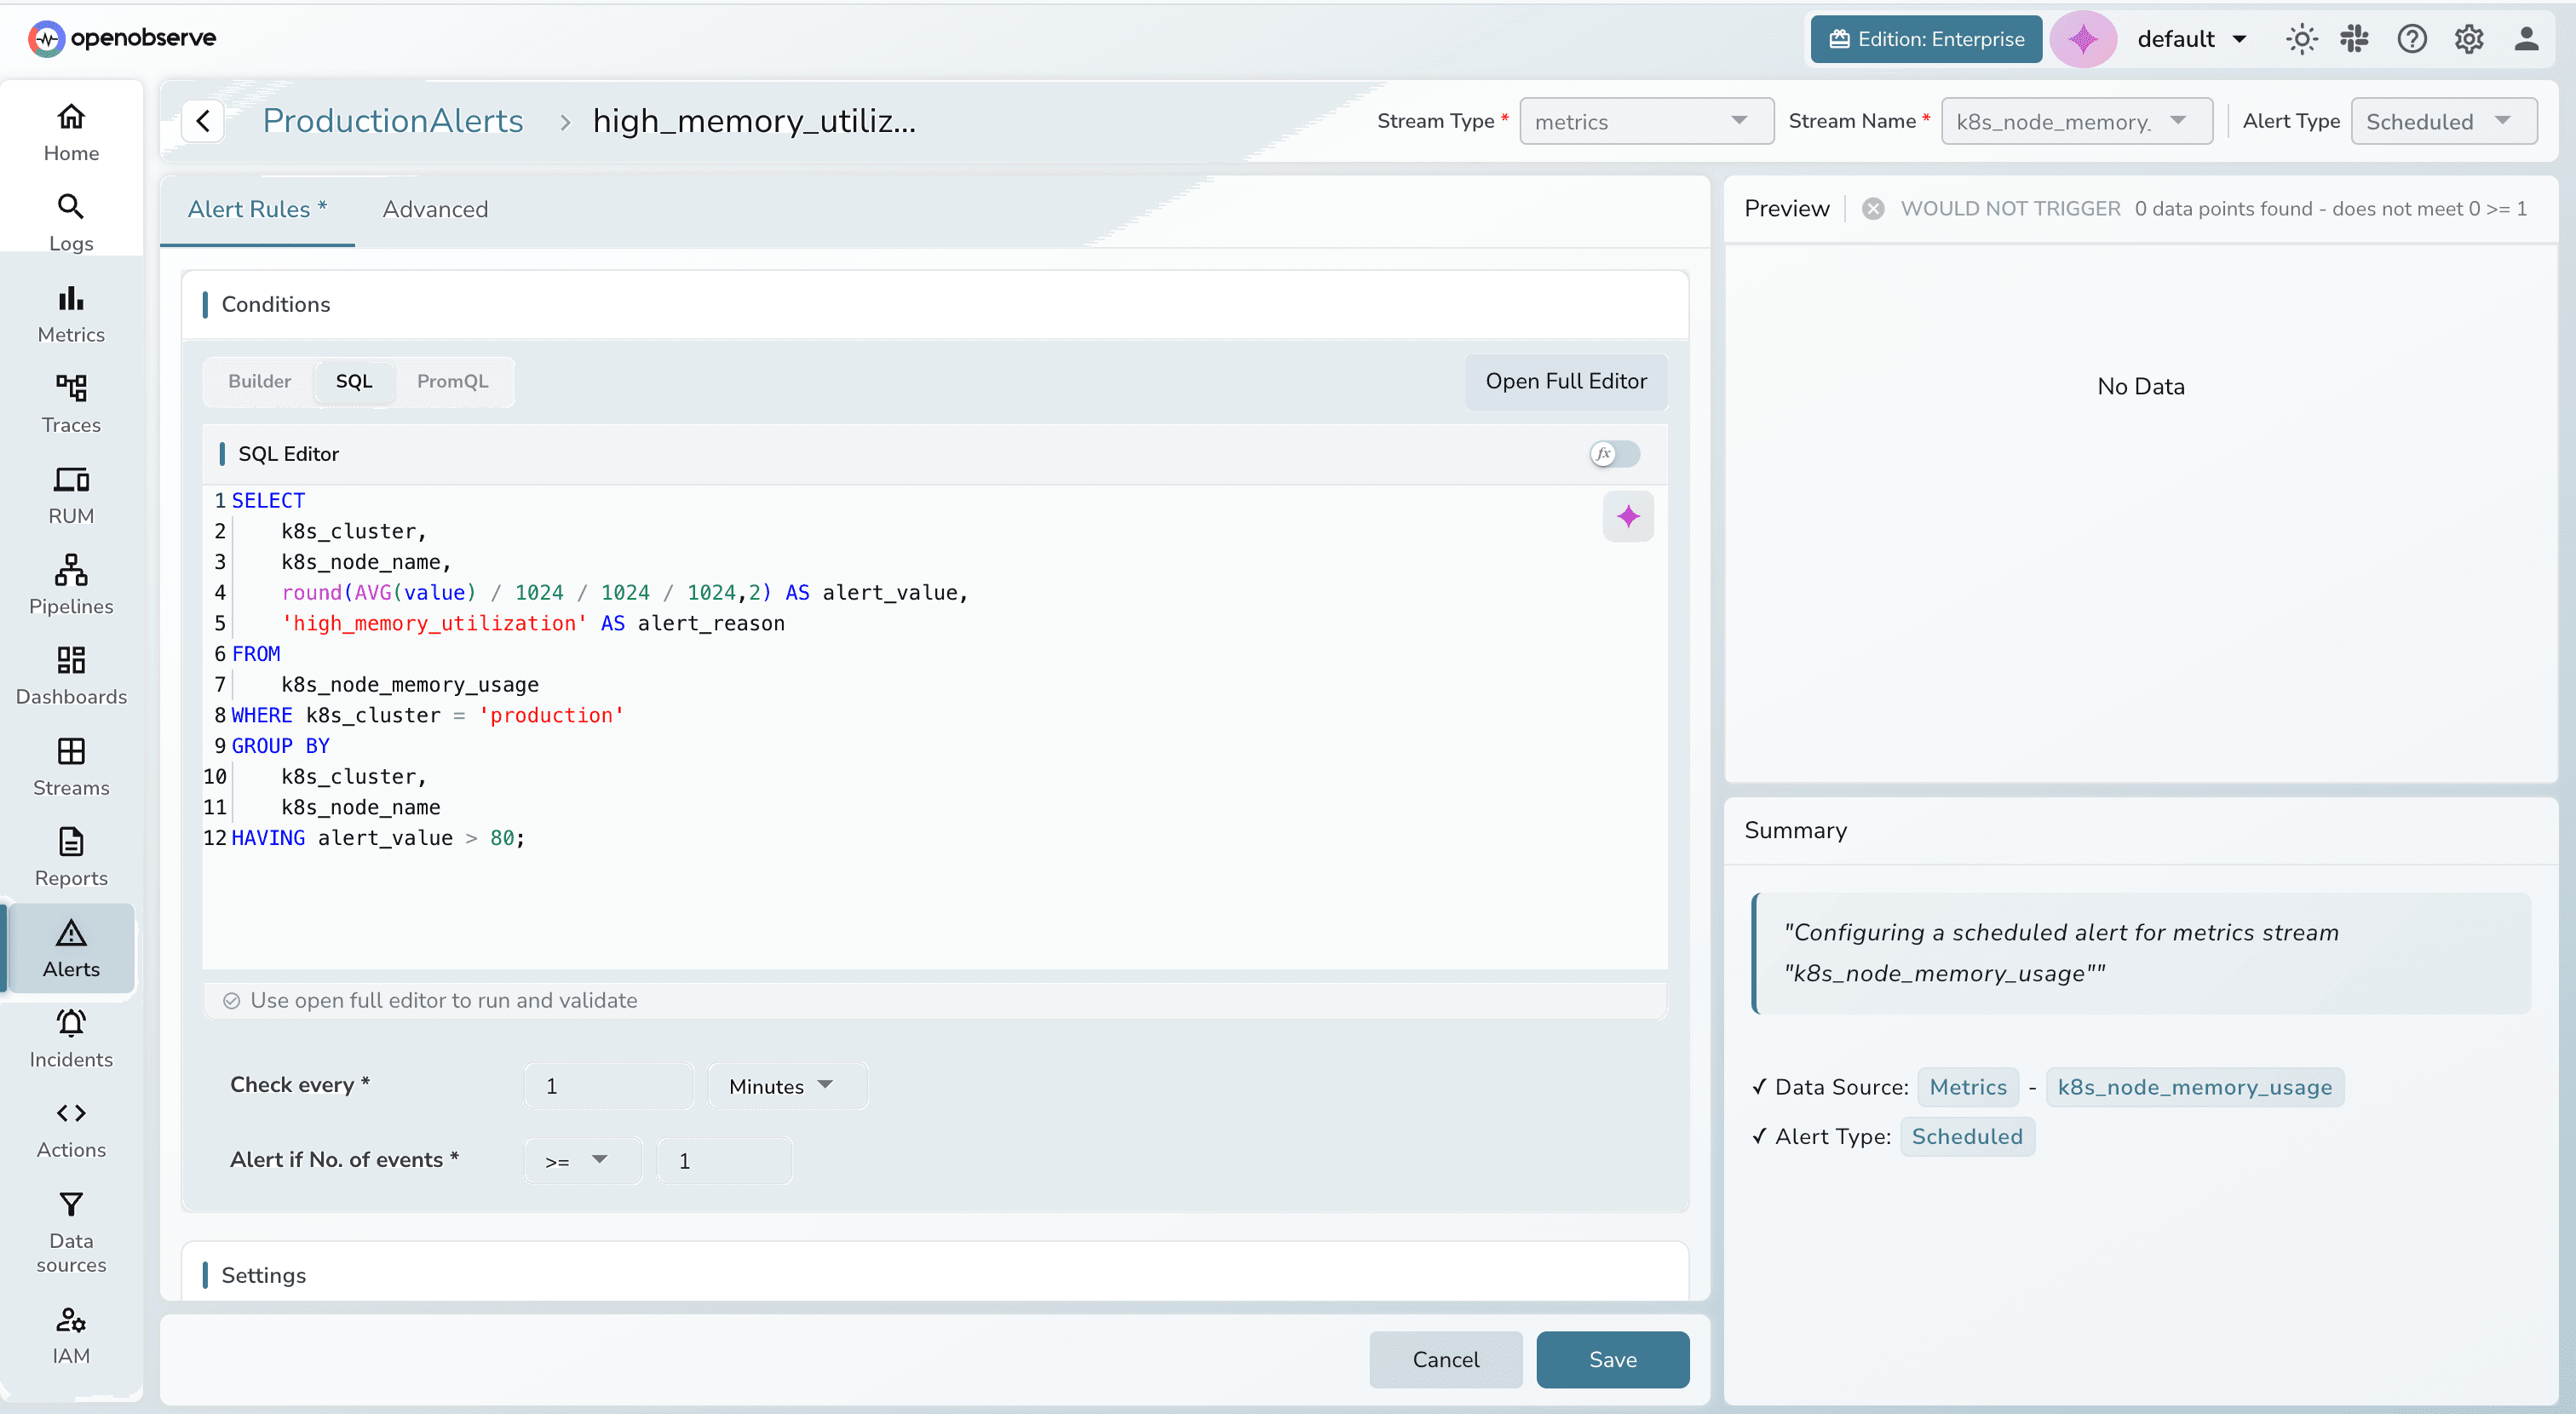
Configure alerts using SQL for logs and traces, or PromQL for metrics
Stay on top of Issues
Identify and fix problems before customers notice
OpenObserve Alerts
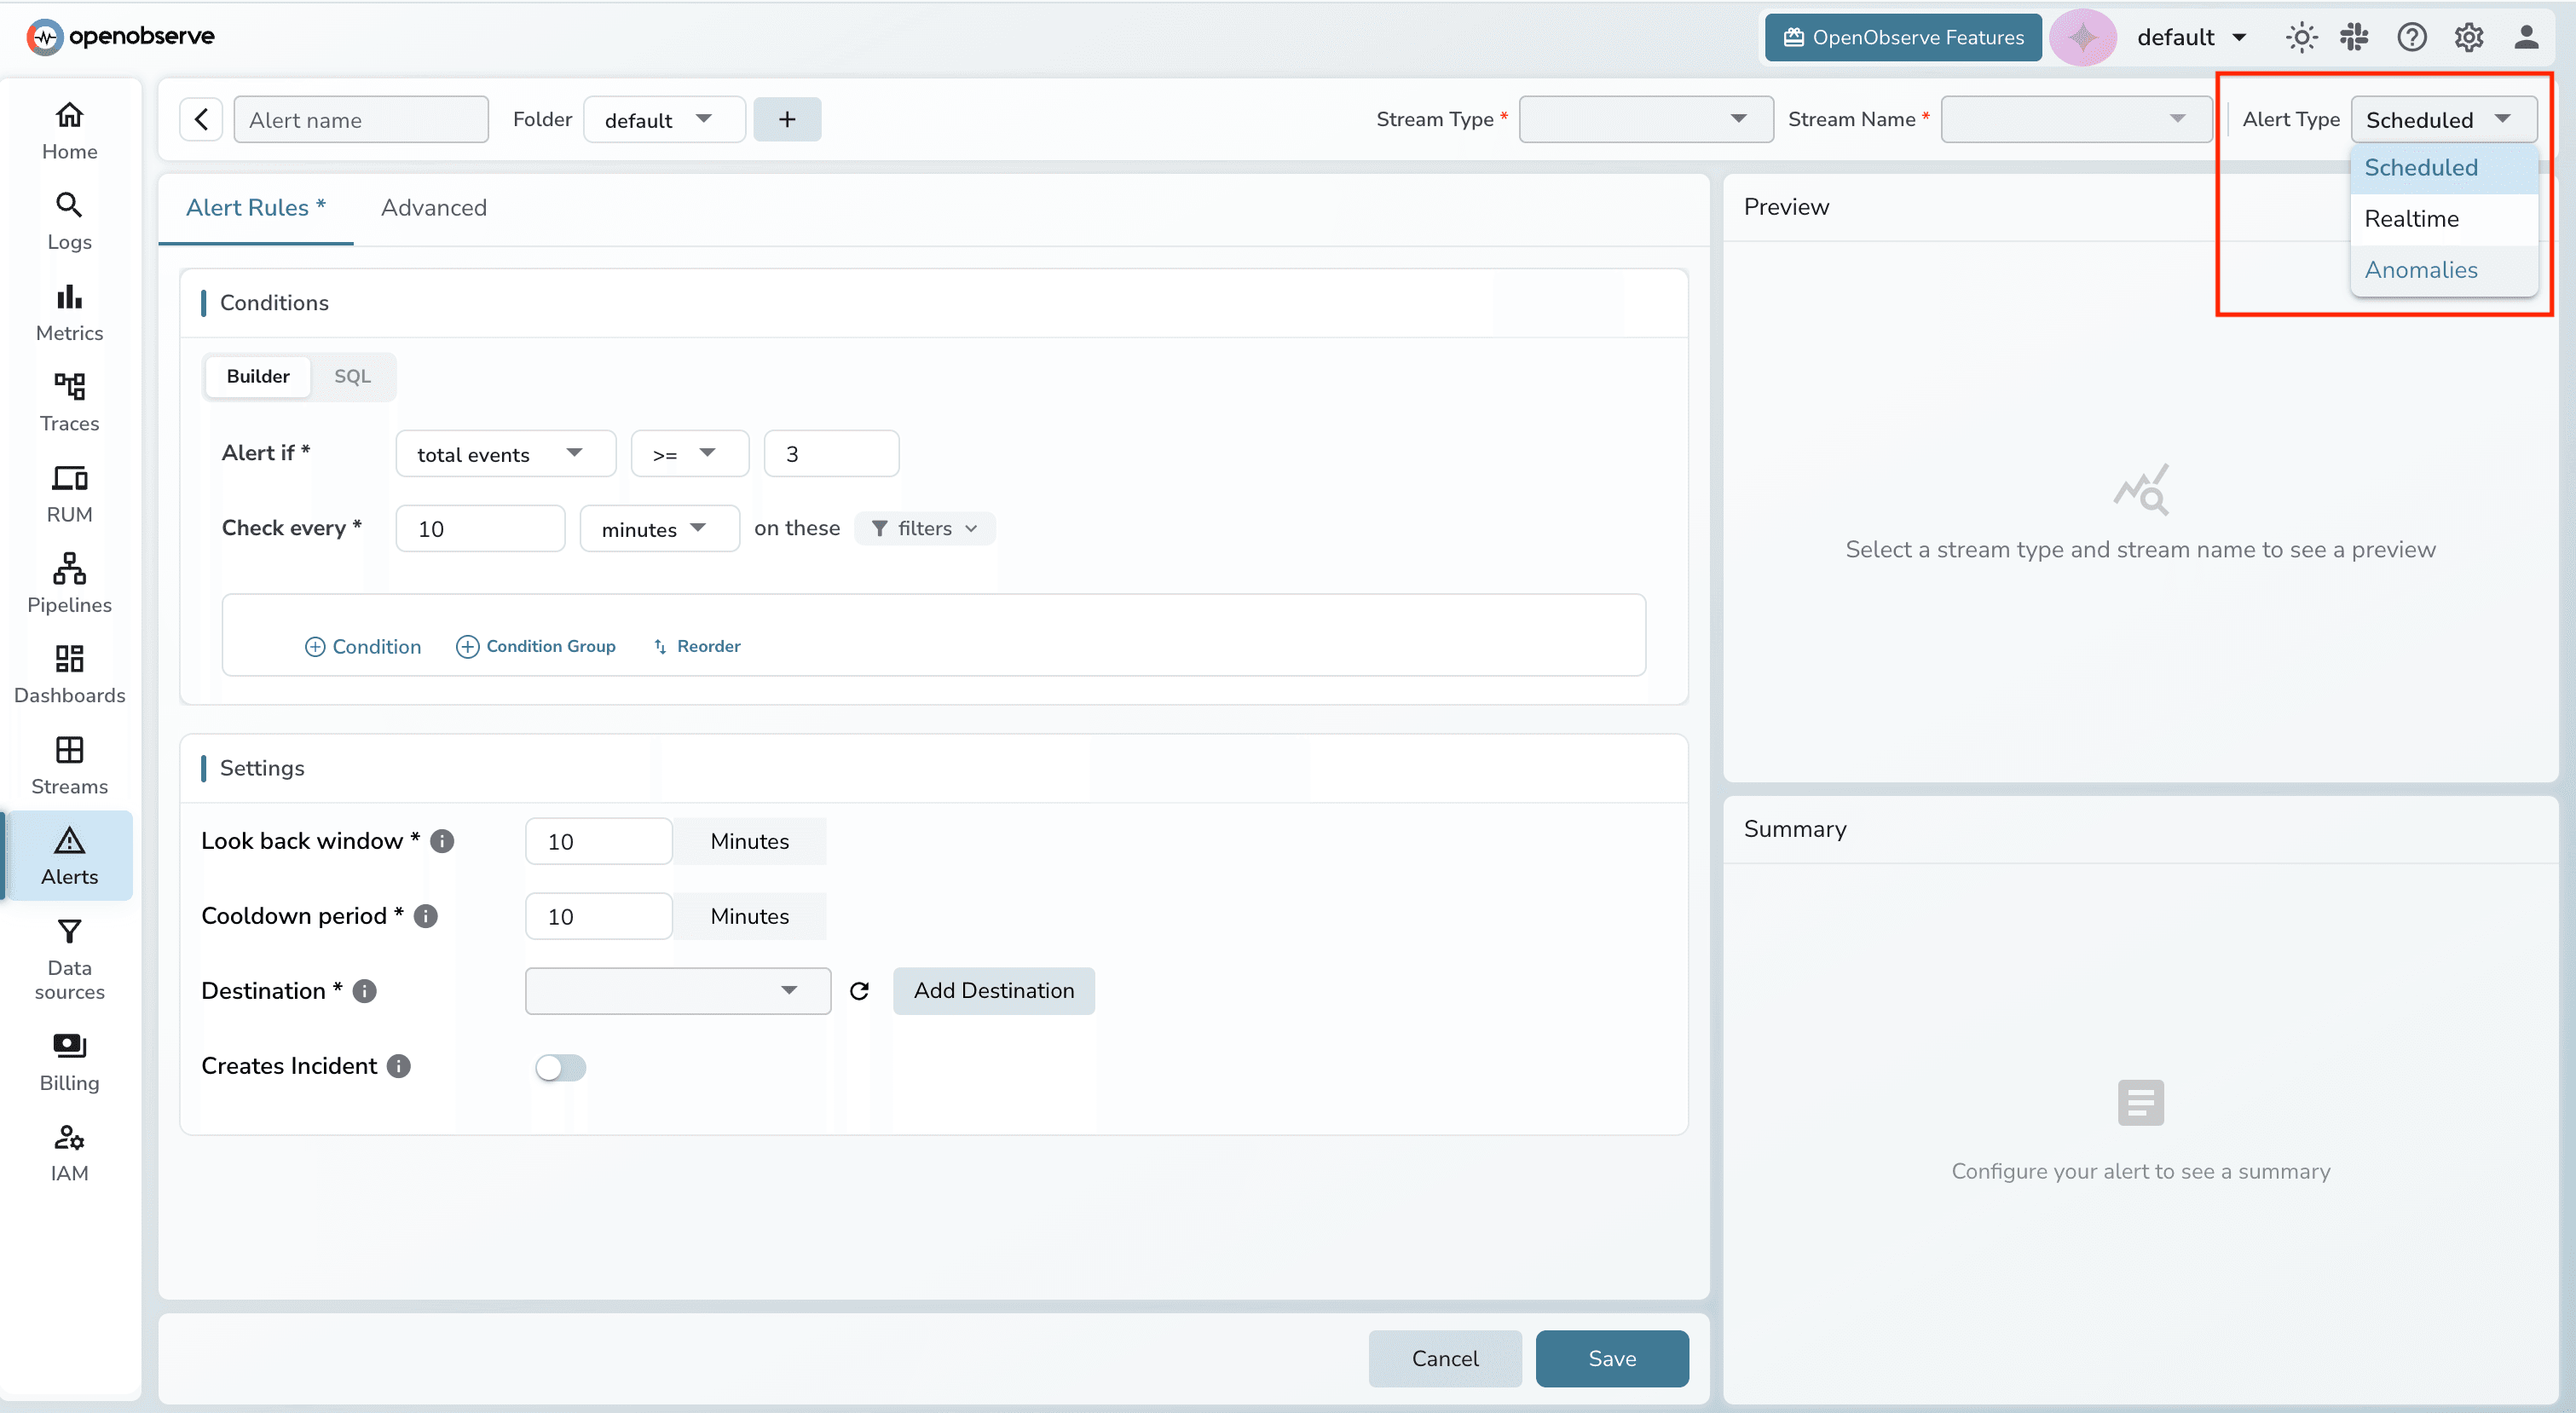
Alert Types
Scheduled Alerts
Detect meaningful patterns and catch gradual drifts that instant checks might miss.
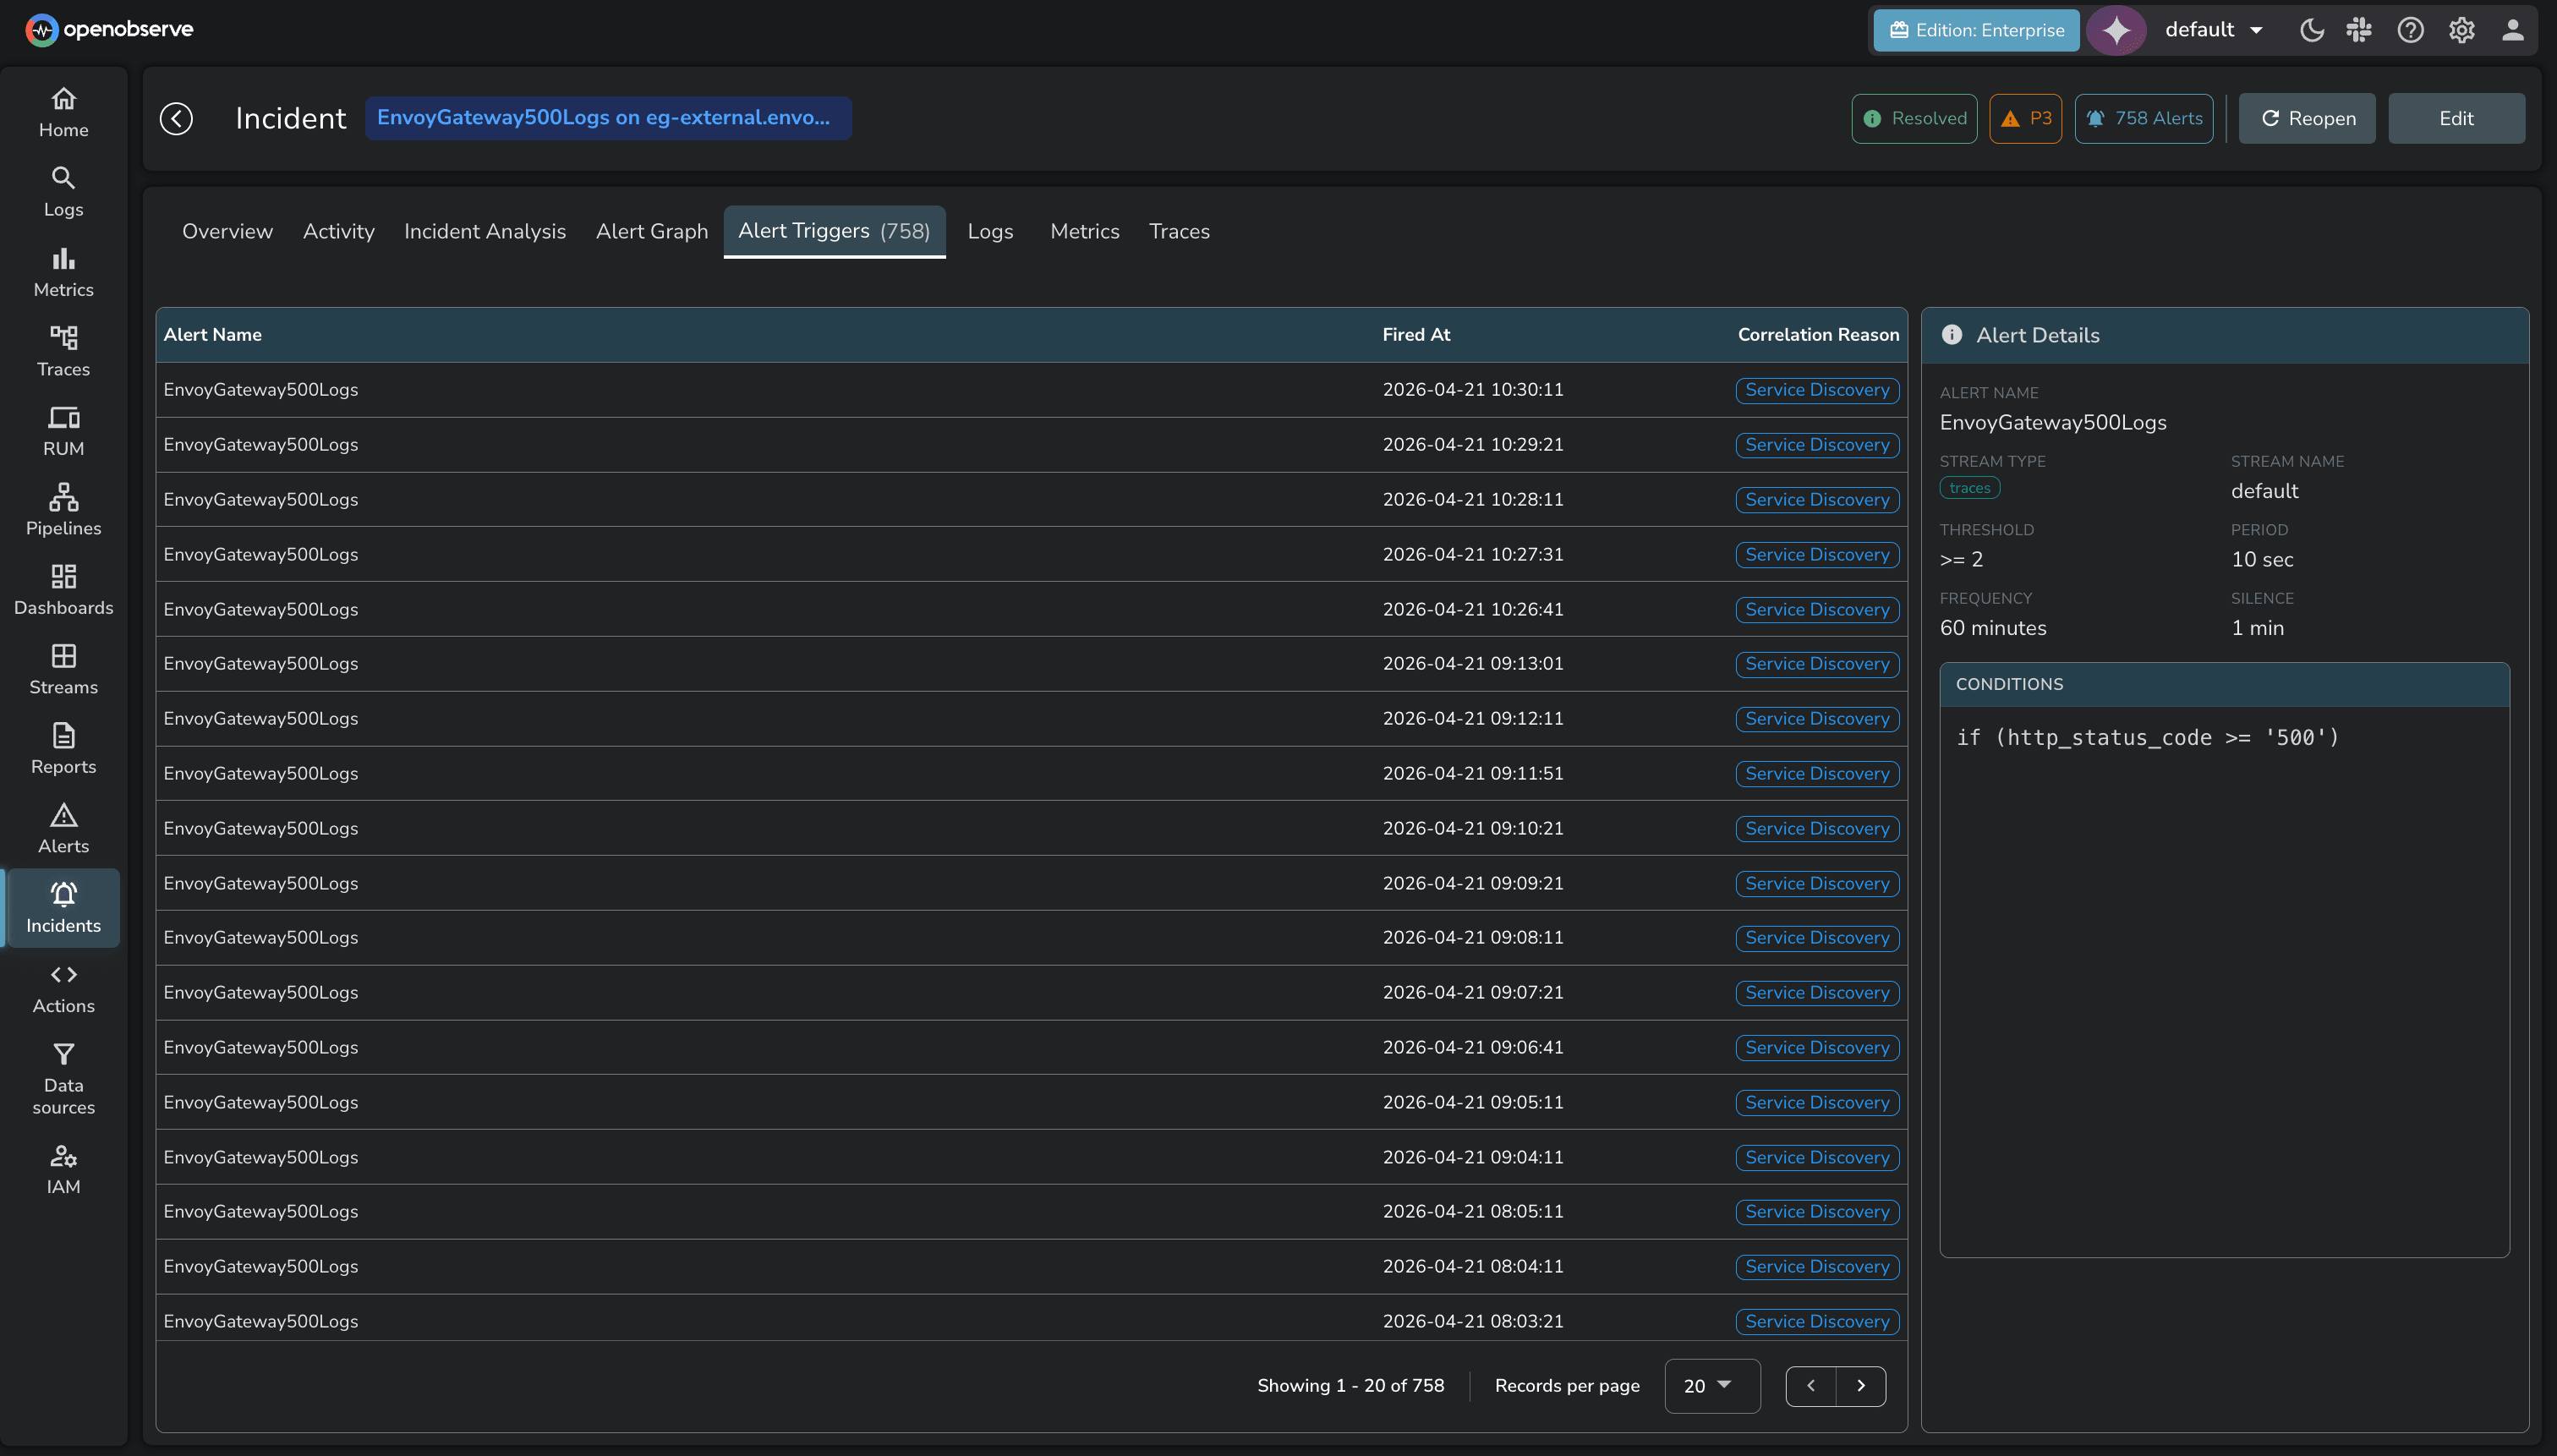
Real-time Alerts
Catch issues the moment they occur. Continuously monitor your most important data streams to detect and respond to critical problems before they impact your users.
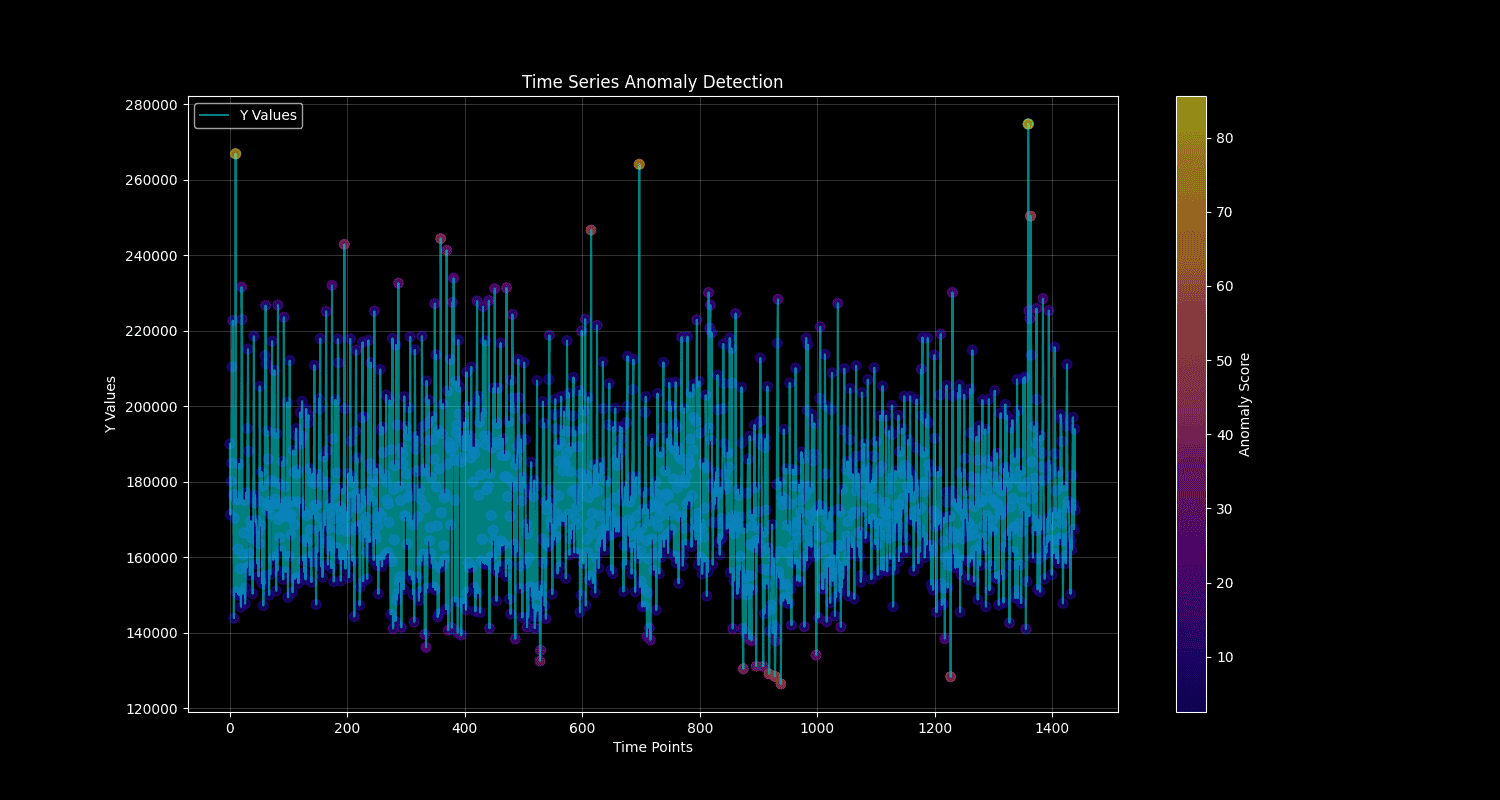
Anomalies
Use machine learning to detect unusual patterns in your data without manually setting thresholds. See Anomaly Detection for details.
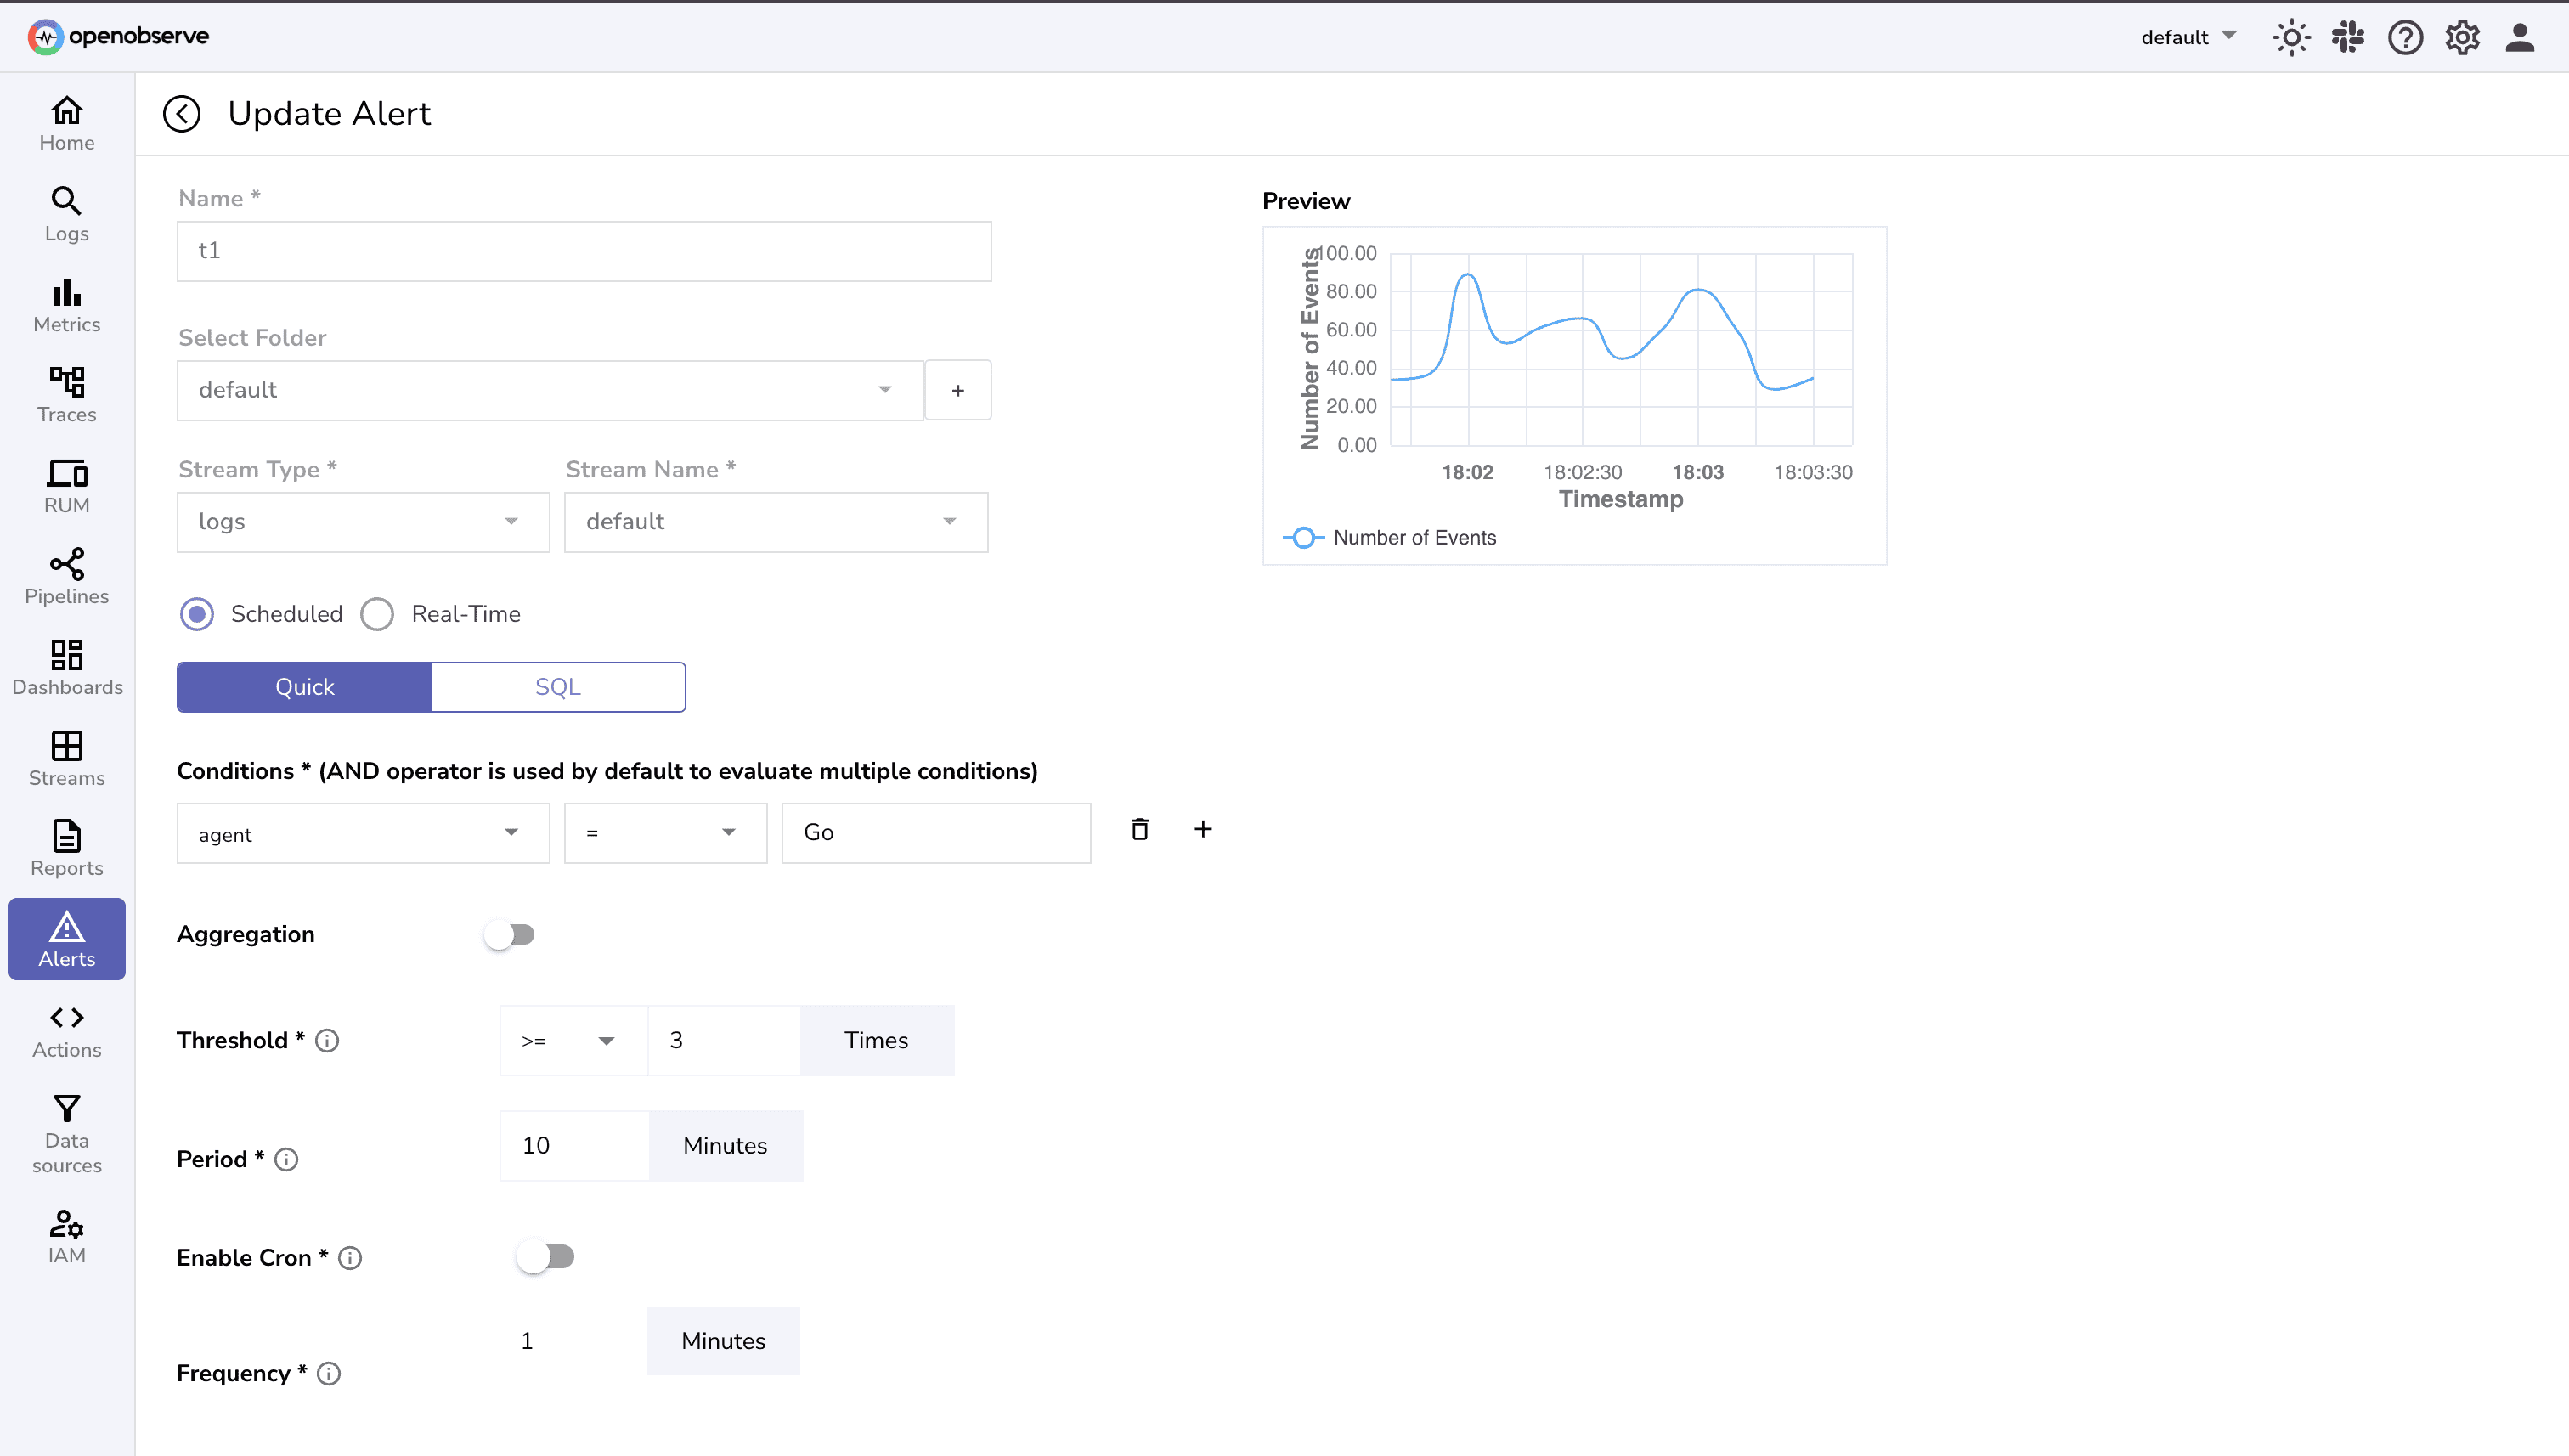
Alert Configuration
Flexible Condition Building
Build alert logic exactly how you need it—use sophisticated SQL for complex scenarios or quick conditions when simplicity matters.
Aggregation Support
Eliminate alert noise with intelligent thresholds. Configure precise aggregation windows that catch real issues while filtering out momentary spikes and false positives.
Alert Notifications
Multiple Notification Destinations
Deliver alerts exactly where your team needs them—Slack, email, webhooks, and more.
Smart Silence Periods
End alert storms and notification fatigue with intelligent suppression rules. Define custom quiet periods that filter out noise.
Alert Controls
Advanced Threshold Settings
Trigger alerts with precision by setting thresholds that respond to evolving data patterns.
Frequency Optimization
Fine-tune alert frequency to strike the perfect balance between early detection and resource efficiency.
Alerts FAQs
Resources
Explore guides, videos, and articles to help you get the most out of Alerts.

Ready to get started?
Try OpenObserve today for more efficient and performant observability.