Frontend Monitoring
Gain insights into application performance, user interactions, and frontend errors.

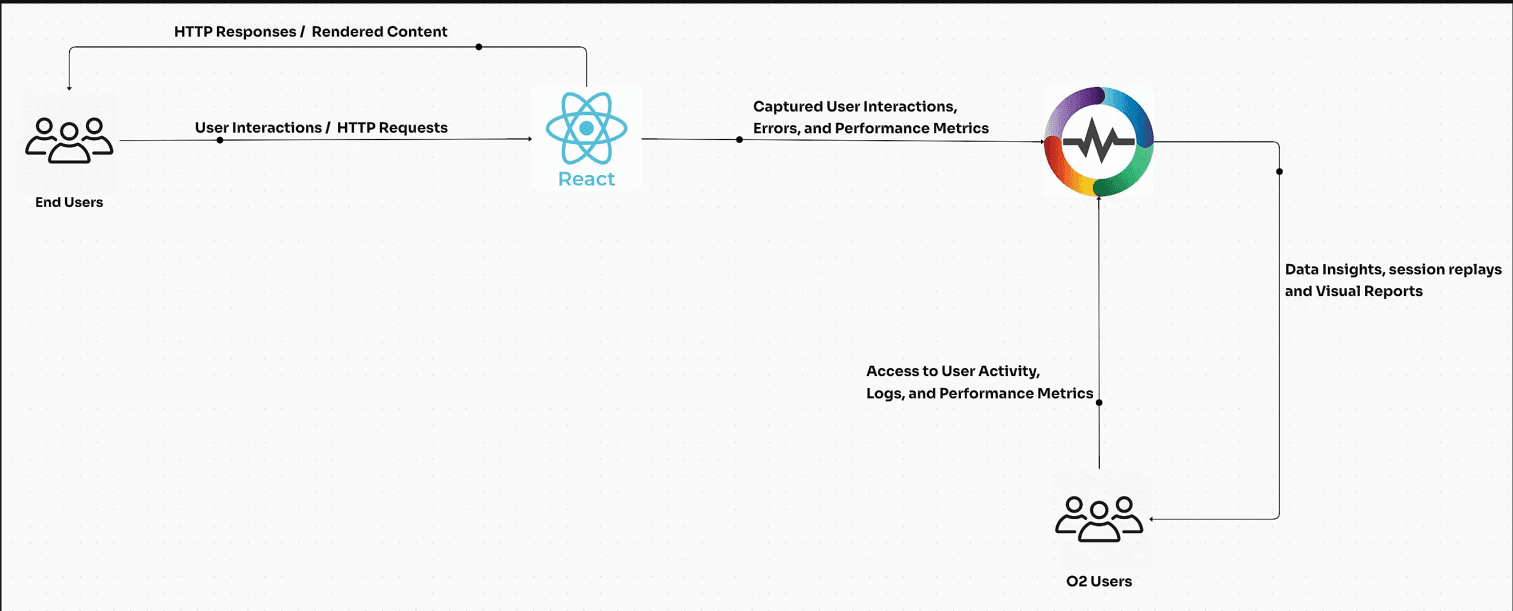
Unified Observability
Consolidate your frontend observability alongside your application performance and infrastructure health
Clear User Insights
See exactly how users experience your site— click-by-click
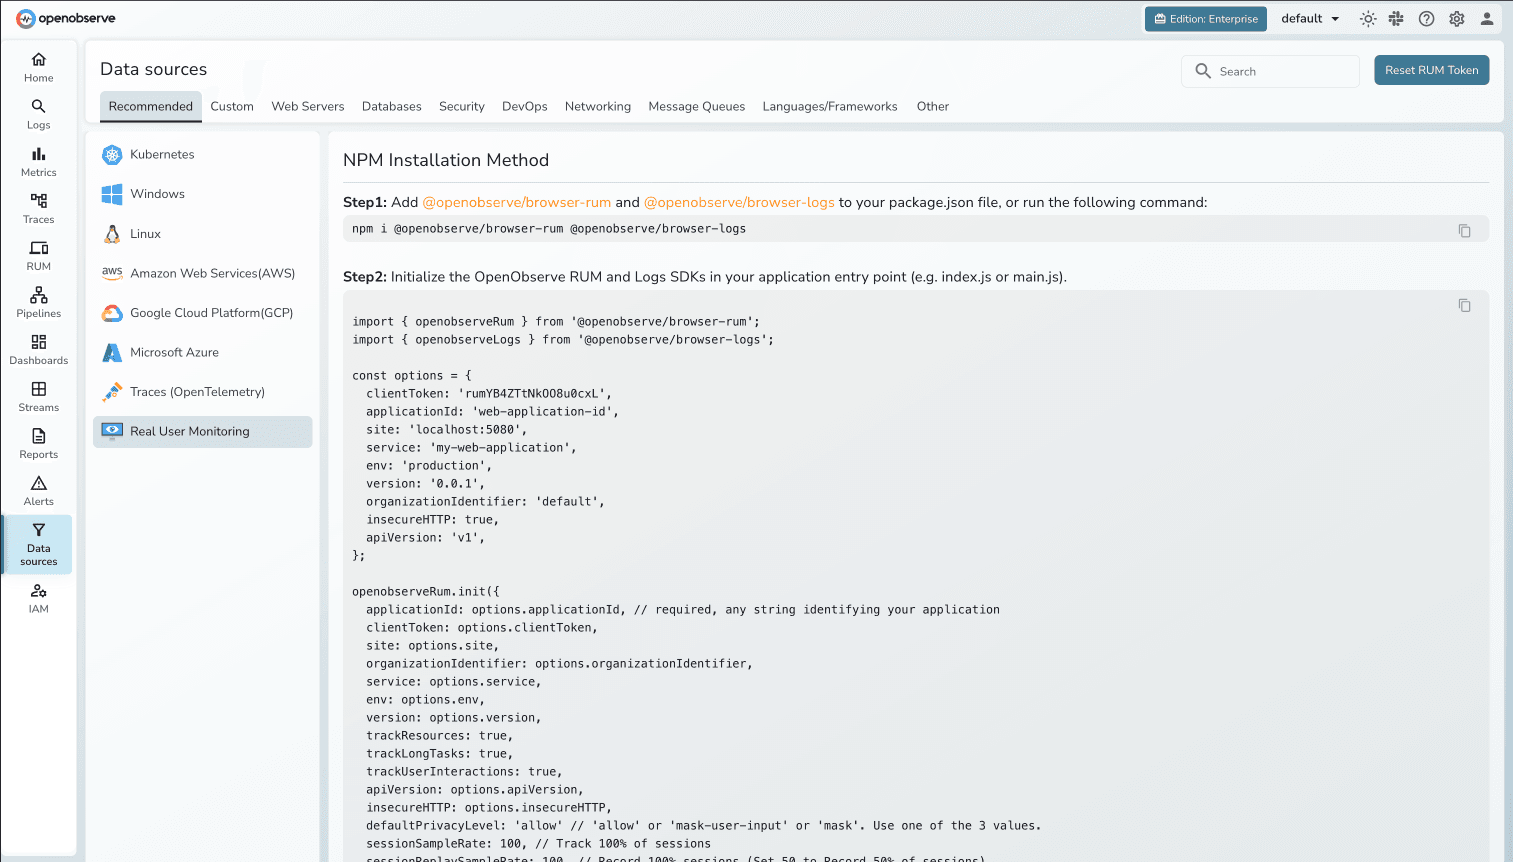
Simple Implementation
Add one JavaScript snippet to your application’s entry point and start collecting real user experience data immediately
OpenObserve Frontend Monitoring
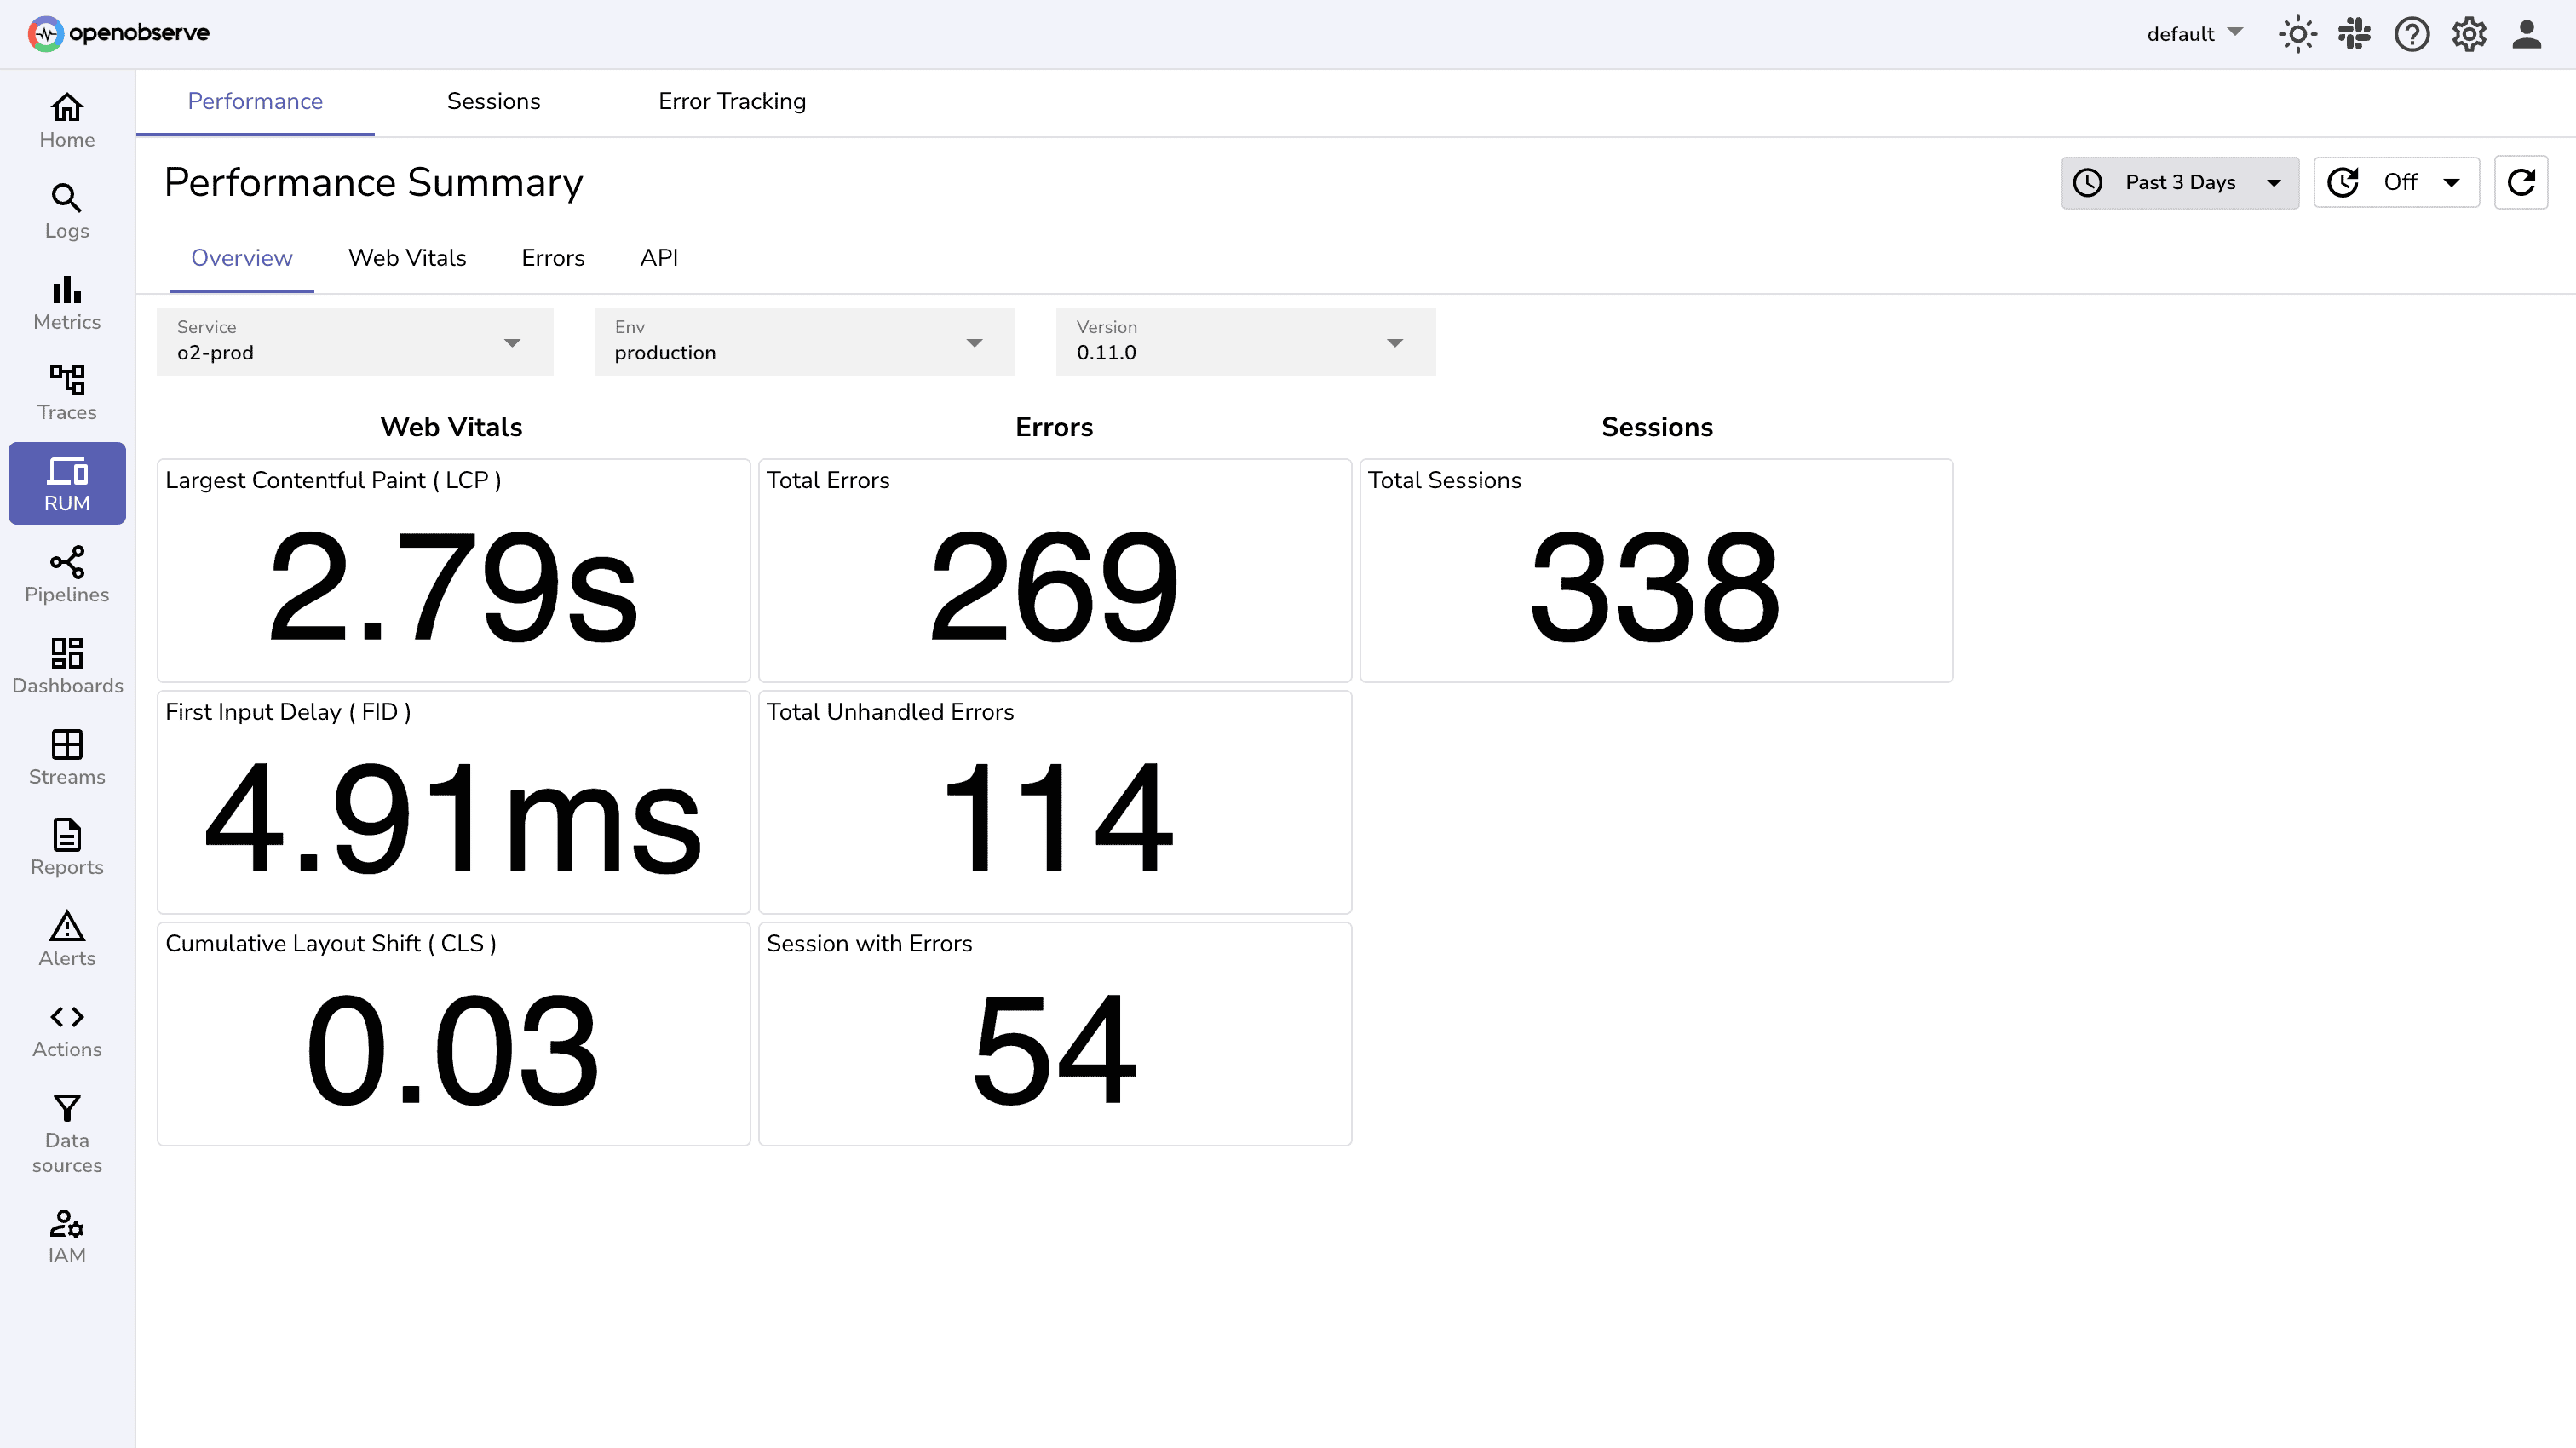
User Experience Monitoring
Performance Metrics
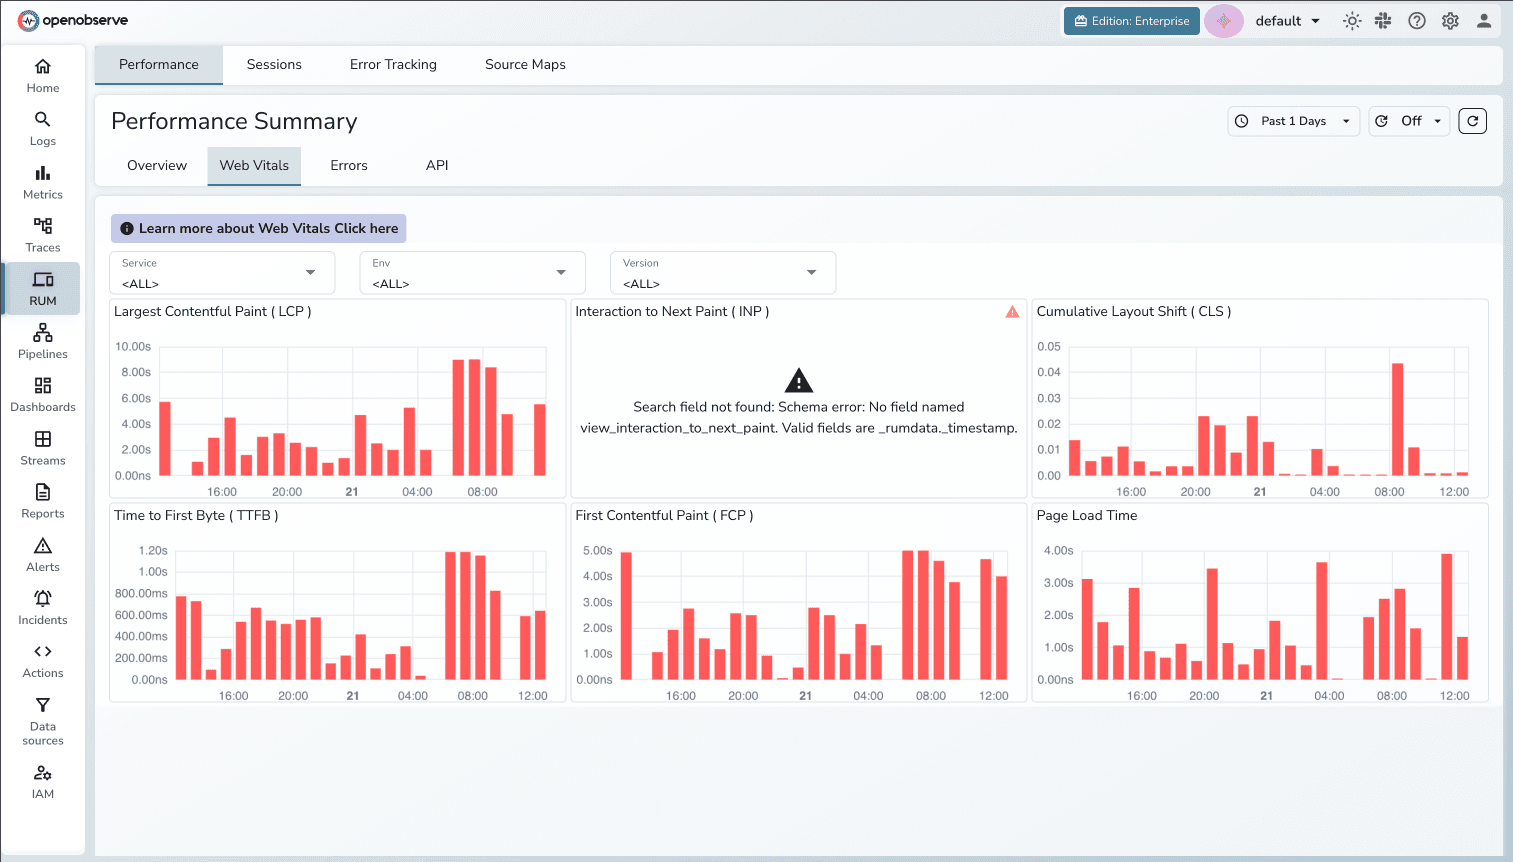
Track vital web metrics that impact your users most —page load times, First Contentful Paint (FCP), Largest Contentful Paint (LCP), and Time to Interactive (TTI).
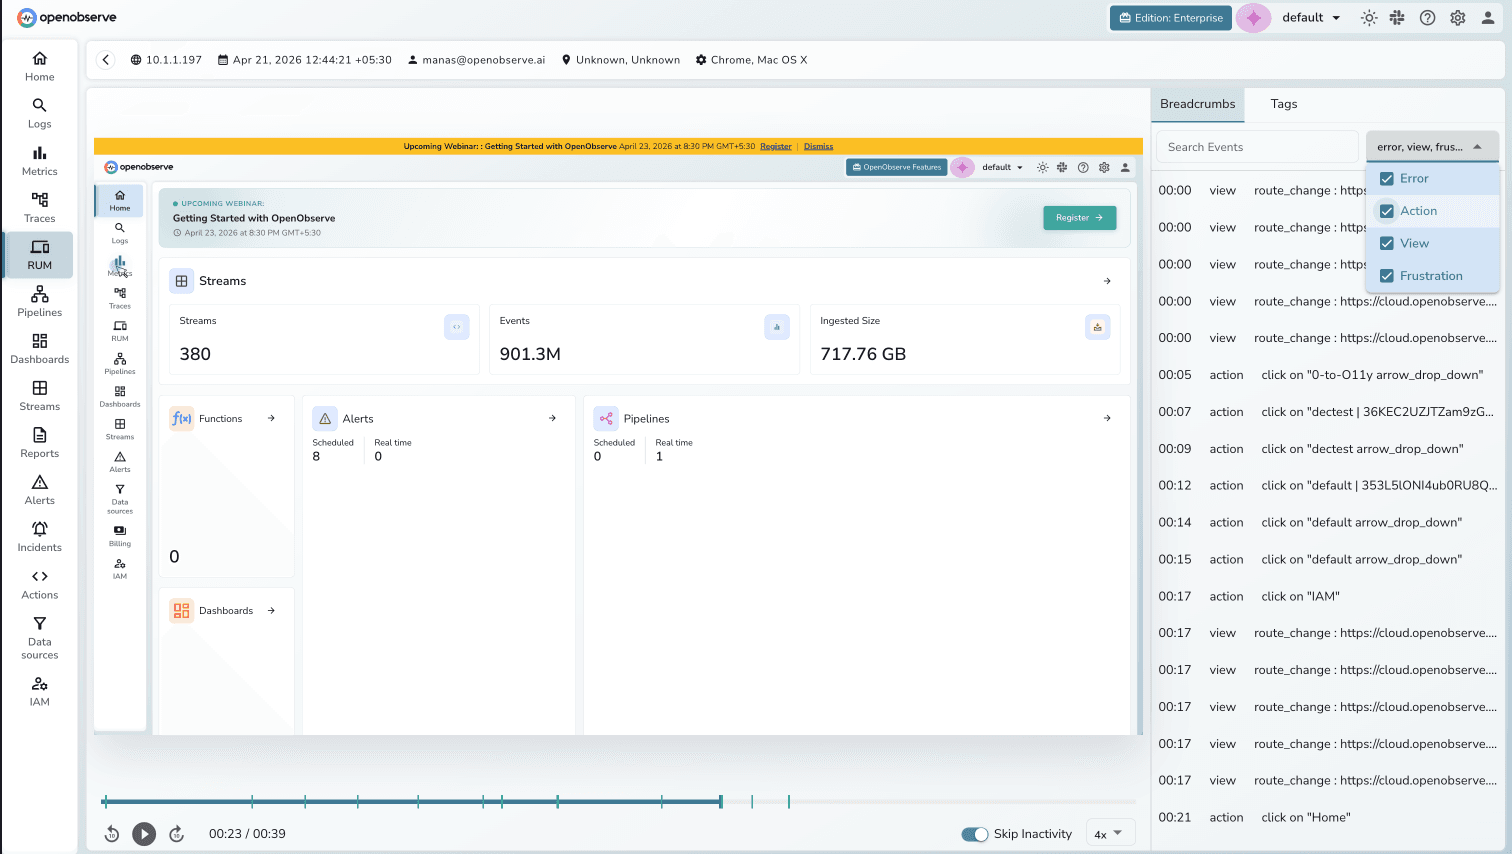
User Journey Analysis
Reveal how real users navigate your application. Uncover common paths, optimize critical workflows, and eliminate friction points with powerful session replay.
Error Tracking
Error Capture
Catch every frontend issue—with complete stack traces, browser details, and the exact user actions that triggered them.
Impact Analysis
Pinpoint which errors hurt users most. Spot patterns across browsers and devices, then prioritize fixes based on real business impact—not just technical severity.
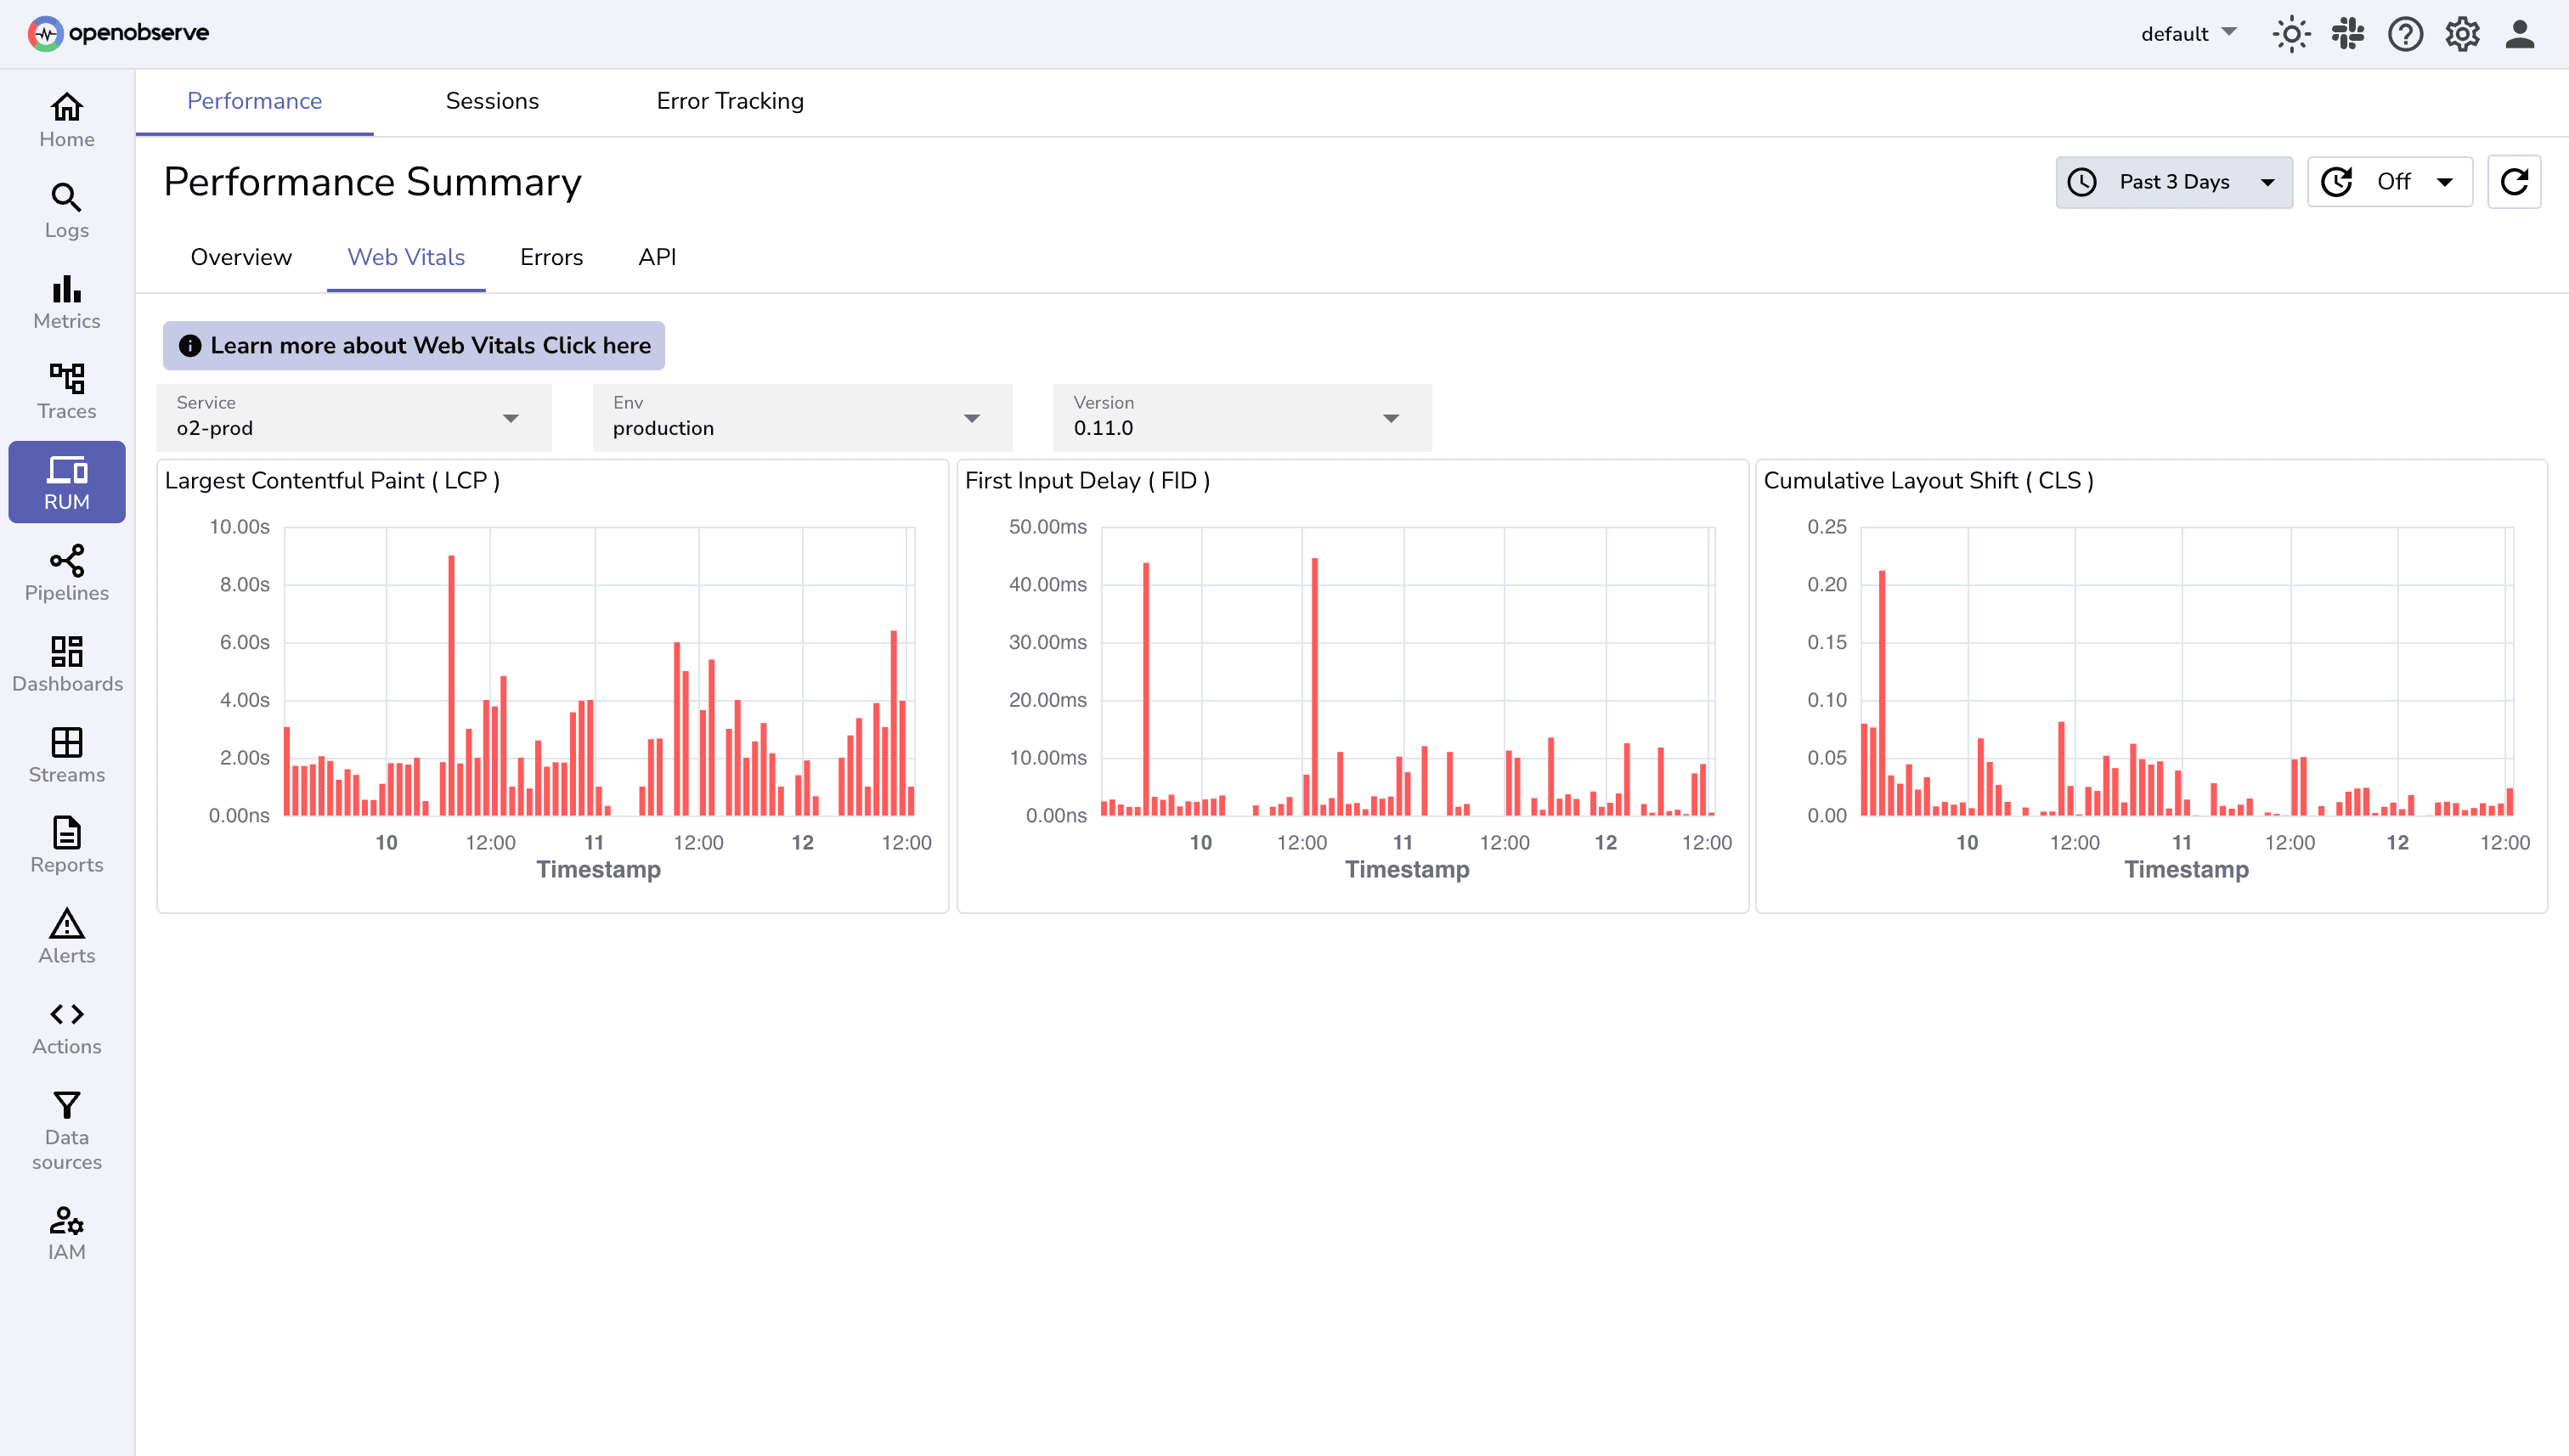
Performance Analysis
Core Web Vitals
Identify experience bottlenecks, track performance across user segments, and deliver pages that respond instantly to every interaction.
Resource Load Time
Expose slow-loading assets and API calls that frustrate users. Pinpoint exactly which resources and backend dependencies are stealing precious milliseconds from your frontend performance.
Quick Implementation
Fast Setup
Go from zero to monitoring in minutes. Collect real user data instantly and customize your configuration to meet your exact needs.
Flexible Integration
Implement with any frontend framework. Capture custom events that reveal the true story behind user behavior and application performance.
Frontend Monitoring FAQs
Resources
Explore guides, videos, and articles to help you get the most out of Frontend Monitoring.
Ready to get started?
Try OpenObserve today for more efficient and performant observability.