Distributed Tracing

Gain end-to-end visibility into your distributed systems with powerful tracing capabilities and seamless OpenTelemetry integration.

GET STARTED FOR FREE
Traces-Image
Bottom decoration
Bottom decoration

Why Use OpenObserve for Tracing?

Transform your distributed system observability with efficient trace collection, comprehensive analysis, and intuitive visualization tools designed for modern architectures.

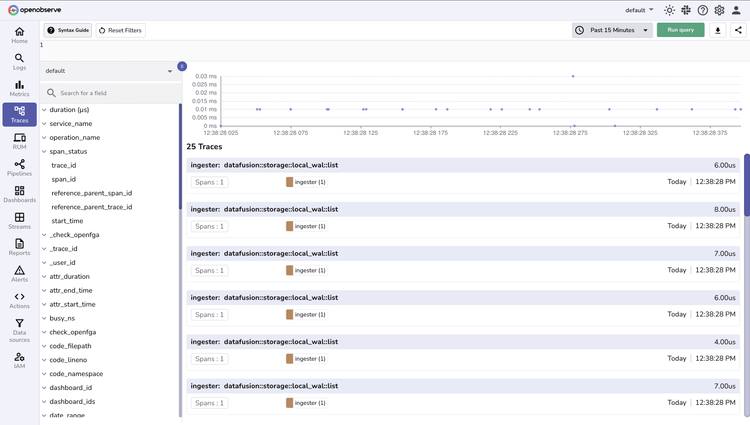
Trace Collection
Service Analysis
Trace Analysis
Optimized Storage
Trace-Collection-Image

Trace Collection

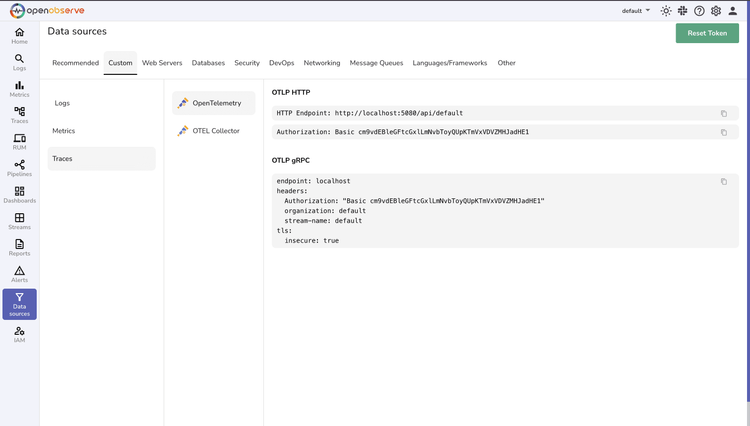
OpenTelemetry Integration

Seamlessly collect traces through native OTLP(Opentelemetry Protocol). Instrument applications once and export traces directly to OpenObserve—no vendor lock-in.

Auto-instrumentation

Capture distributed traces using zero-code auto-instrumentation configured by OpenObserve collector

Service-Analysis-Image

Service Analysis

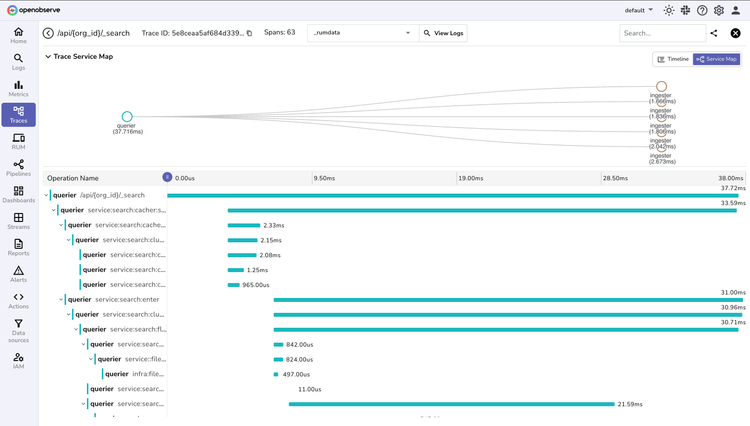
Dependency Mapping

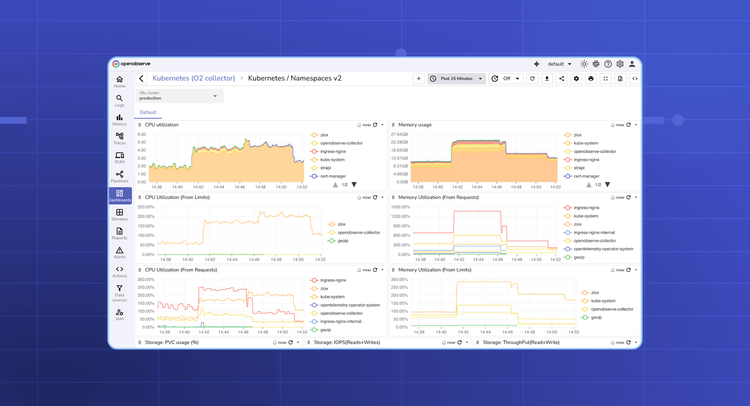
Automatically generate service maps showing real-time interactions between microservices.

Performance Insights

Identify slow endpoints with latency heatmaps and error trend analysis. Compare trace durations across service versions to catch regressions early.

Trace-Analysis-Image

Trace Analysis

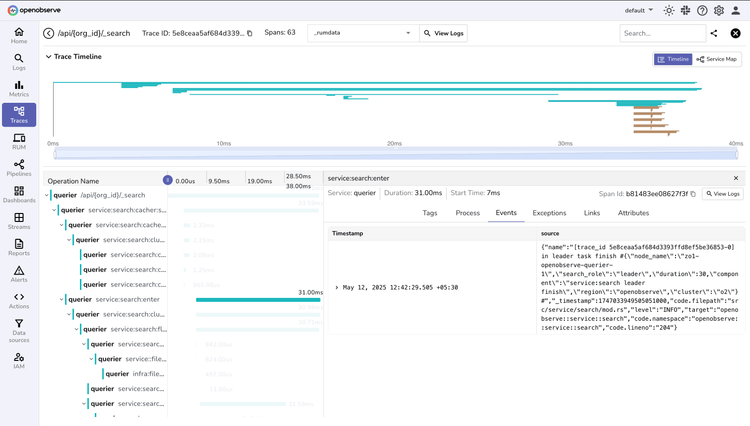
Detailed Spans

Inspect individual spans with nested timing data, tags, and logs. Jump from aggregated metrics to specific problematic traces in one click.

Context Propagation

Track requests across service boundaries with W3C trace context support. Visualize full distributed transaction paths with flame graphs and waterfall diagrams.

Storage-Management-Image

Optimized Storage

Efficient Storage

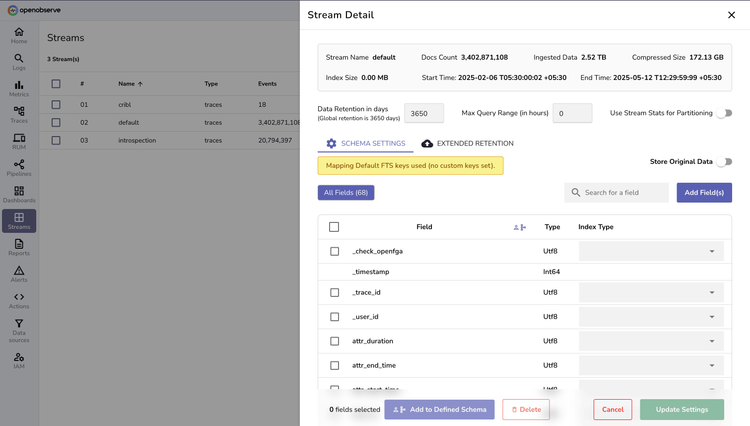
Store traces at 1/140th the cost of Elasticsearch using Apache Parquet columnar format. Achieve efficient data compression without extremely high query performance.

Flexible Retention

Define custom retention policies without the need for tiered storage. OpenObserve uses object store for hot tier storage.

Get Started with Distributed Tracing

Begin monitoring your distributed systems with OpenObserve. Start with the free tier or schedule a demo.

Fair and transparent pricing

Only pay for what you use.

view pricing plans

Openobserve Cloud Free Tier

Monthly Limits:

  • iconIngestion - 50 GB logs, 50 GB metrics , 50 GB traces
  • iconQuery volume - 200 GB
  • iconPipelines - 50 GB of Data Processing
  • icon1K RUM & Session Replay
  • icon1K Action Script Runs
  • icon3 Users
  • icon7-Days Retention
Get started for free

Get started in minutes—no credit card required.

Distributed Tracing FAQs

How does OpenObserve collect traces?

toggle

OpenObserve collects distributed traces through OpenTelemetry instrumentation. The platform accepts traces via the OTLP protocol, supporting both manual and automatic instrumentation methods. For services already instrumented with OpenTelemetry, you can configure the exporter to send traces directly to OpenObserve. The system maintains trace context across service boundaries using W3C trace context standards.

What information is captured in traces?

toggle

Each trace consists of spans representing operations across services. Spans include essential information such as operation name, timestamp, duration, and service name. Additional context is captured through span attributes, events, and links. The system preserves parent-child relationships between spans, enabling full request path visualization. Error information and stack traces are automatically captured for failed operations.

How does trace analysis work?

toggle

OpenObserve processes traces to provide multiple analysis perspectives. The trace view shows the complete request timeline with nested spans and timing information. Service maps are generated automatically from trace data, showing dependencies and interaction patterns. The query engine supports filtering traces by service, operation, duration, and custom attributes. You can analyze latency distributions and error rates across services.

What visualization capabilities are available?

toggle

The platform provides several visualization options for trace data. The trace timeline view shows the hierarchical relationship between spans with precise timing. Service maps display the topology of your distributed system based on actual request flows. The dashboard system supports custom visualizations for trace metrics, including latency histograms and error rate trends.

How does OpenObserve handle trace sampling?

toggle

Trace sampling is configurable to balance data volume with observability needs. The system supports head-based sampling at collection time and tail-based sampling for more sophisticated scenarios. You can define sampling rules based on service names, operation types, or custom attributes. The platform maintains statistical accuracy while reducing storage requirements through intelligent sampling strategies.

What query capabilities are available for traces?

toggle

OpenObserve implements a powerful query engine for trace analysis. You can search traces using service names, operation names, duration thresholds, and custom attributes. The system supports complex queries combining multiple criteria with logical operators. Trace queries can be saved and reused across dashboards. The query language allows for aggregations and statistical analysis of trace data.

How does service dependency analysis work?

toggle

The platform automatically generates service dependency information from trace data. Service maps show both direct and indirect dependencies between components. The system calculates key metrics like request rates, error rates, and latency percentiles for each service interaction. You can analyze dependency changes over time and identify critical paths in your architecture.

What retention and storage options are available?

toggle

OpenObserve optimizes trace storage using columnar format and efficient compression. Retention periods are configurable per data source, allowing you to balance storage costs with analysis needs. The system supports tiered storage for different trace retention requirements. Historical traces can be accessed efficiently through the query interface while maintaining quick access to recent data.

Want to Learn More? Check out our blog.

Explore log management best practices and OpenObserve's capabilities on our blog.

Default Image

How to Deploy OpenObserve on Heroku: A Complete Guide

Deploy OpenObserve on Heroku without DevOps complexity. Get logs, metrics, and traces monitoring running in minutes with our comprehensive deployment guide.

Default Image

Complete Guide to Retool Enterprise Error Monitoring and Observability

Learn how to implement enterprise-grade error monitoring and observability for Retool applications. Compare native monitoring vs OpenObserve, setup workflows, configure dashboards, and establish best practices for tracking Retool app errors.

Default Image

Complete Fortinet Firewall Monitoring Guide: Log Analysis

Learn how to monitor Fortinet firewalls using OpenObserve. Step-by-step guide for syslog setup, log transformation, and creating dashboards for real-time security monitoring.

Default Image
How to Deploy OpenObserve on Heroku: A Complete Guide

Deploy OpenObserve on Heroku without DevOps complexity. Get logs, metrics, and traces monitoring running in minutes with our comprehensive deployment guide.

Default Image
Complete Guide to Retool Enterprise Error Monitoring and Observability

Learn how to implement enterprise-grade error monitoring and observability for Retool applications. Compare native monitoring vs OpenObserve, setup workflows, configure dashboards, and establish best practices for tracking Retool app errors.

Default Image
Complete Fortinet Firewall Monitoring Guide: Log Analysis

Learn how to monitor Fortinet firewalls using OpenObserve. Step-by-step guide for syslog setup, log transformation, and creating dashboards for real-time security monitoring.

SEE ALL BLOGS

Platform

  • Logs
  • Metrics
  • Traces
  • Frontend Monitoring
  • Pipelines
  • Alerts
  • Visualizations & Dashboard

Solutions

  • Azure Monitoring
  • AWS Monitoring
  • GCP Monitoring
  • Kubernetes Observability
  • Database Monitoring
  • OpenTelemetry
  • DevOps & SRE
  • Development Teams

Company

  • About
  • Careers
  • Contact Us
  • Why OpenObserve?

Resources

  • Documentation
  • Blog
  • FAQs
  • Articles

Community

  • Slack
  • Github
  • Twitter
  • LinkedIn
  • YouTube

Pricing

  • View Plans

SOC2 Type 2

Certified

Star Fork

OpenObserve Inc. © 2025

3000 Sand Hill Rd Building 1, Suite 260, Menlo Park, CA 94025

Terms Of ServicePrivacy Policy