Azure Monitoring
Gain deep insights into your cloud infrastructure performance, troubleshoot issues efficiently, and optimize your operations.

Why Use OpenObserve for Azure Monitoring?
Deep Azure Observability
Gain deep visibility into the many layers of your Azure environment for faster troubleshooting and proactive issue prevention.
Telemetry Cost Optimization
Slash Azure telemetry storage costs with OpenObserve’s efficient compression and retention.
Almost Too-easy Integration
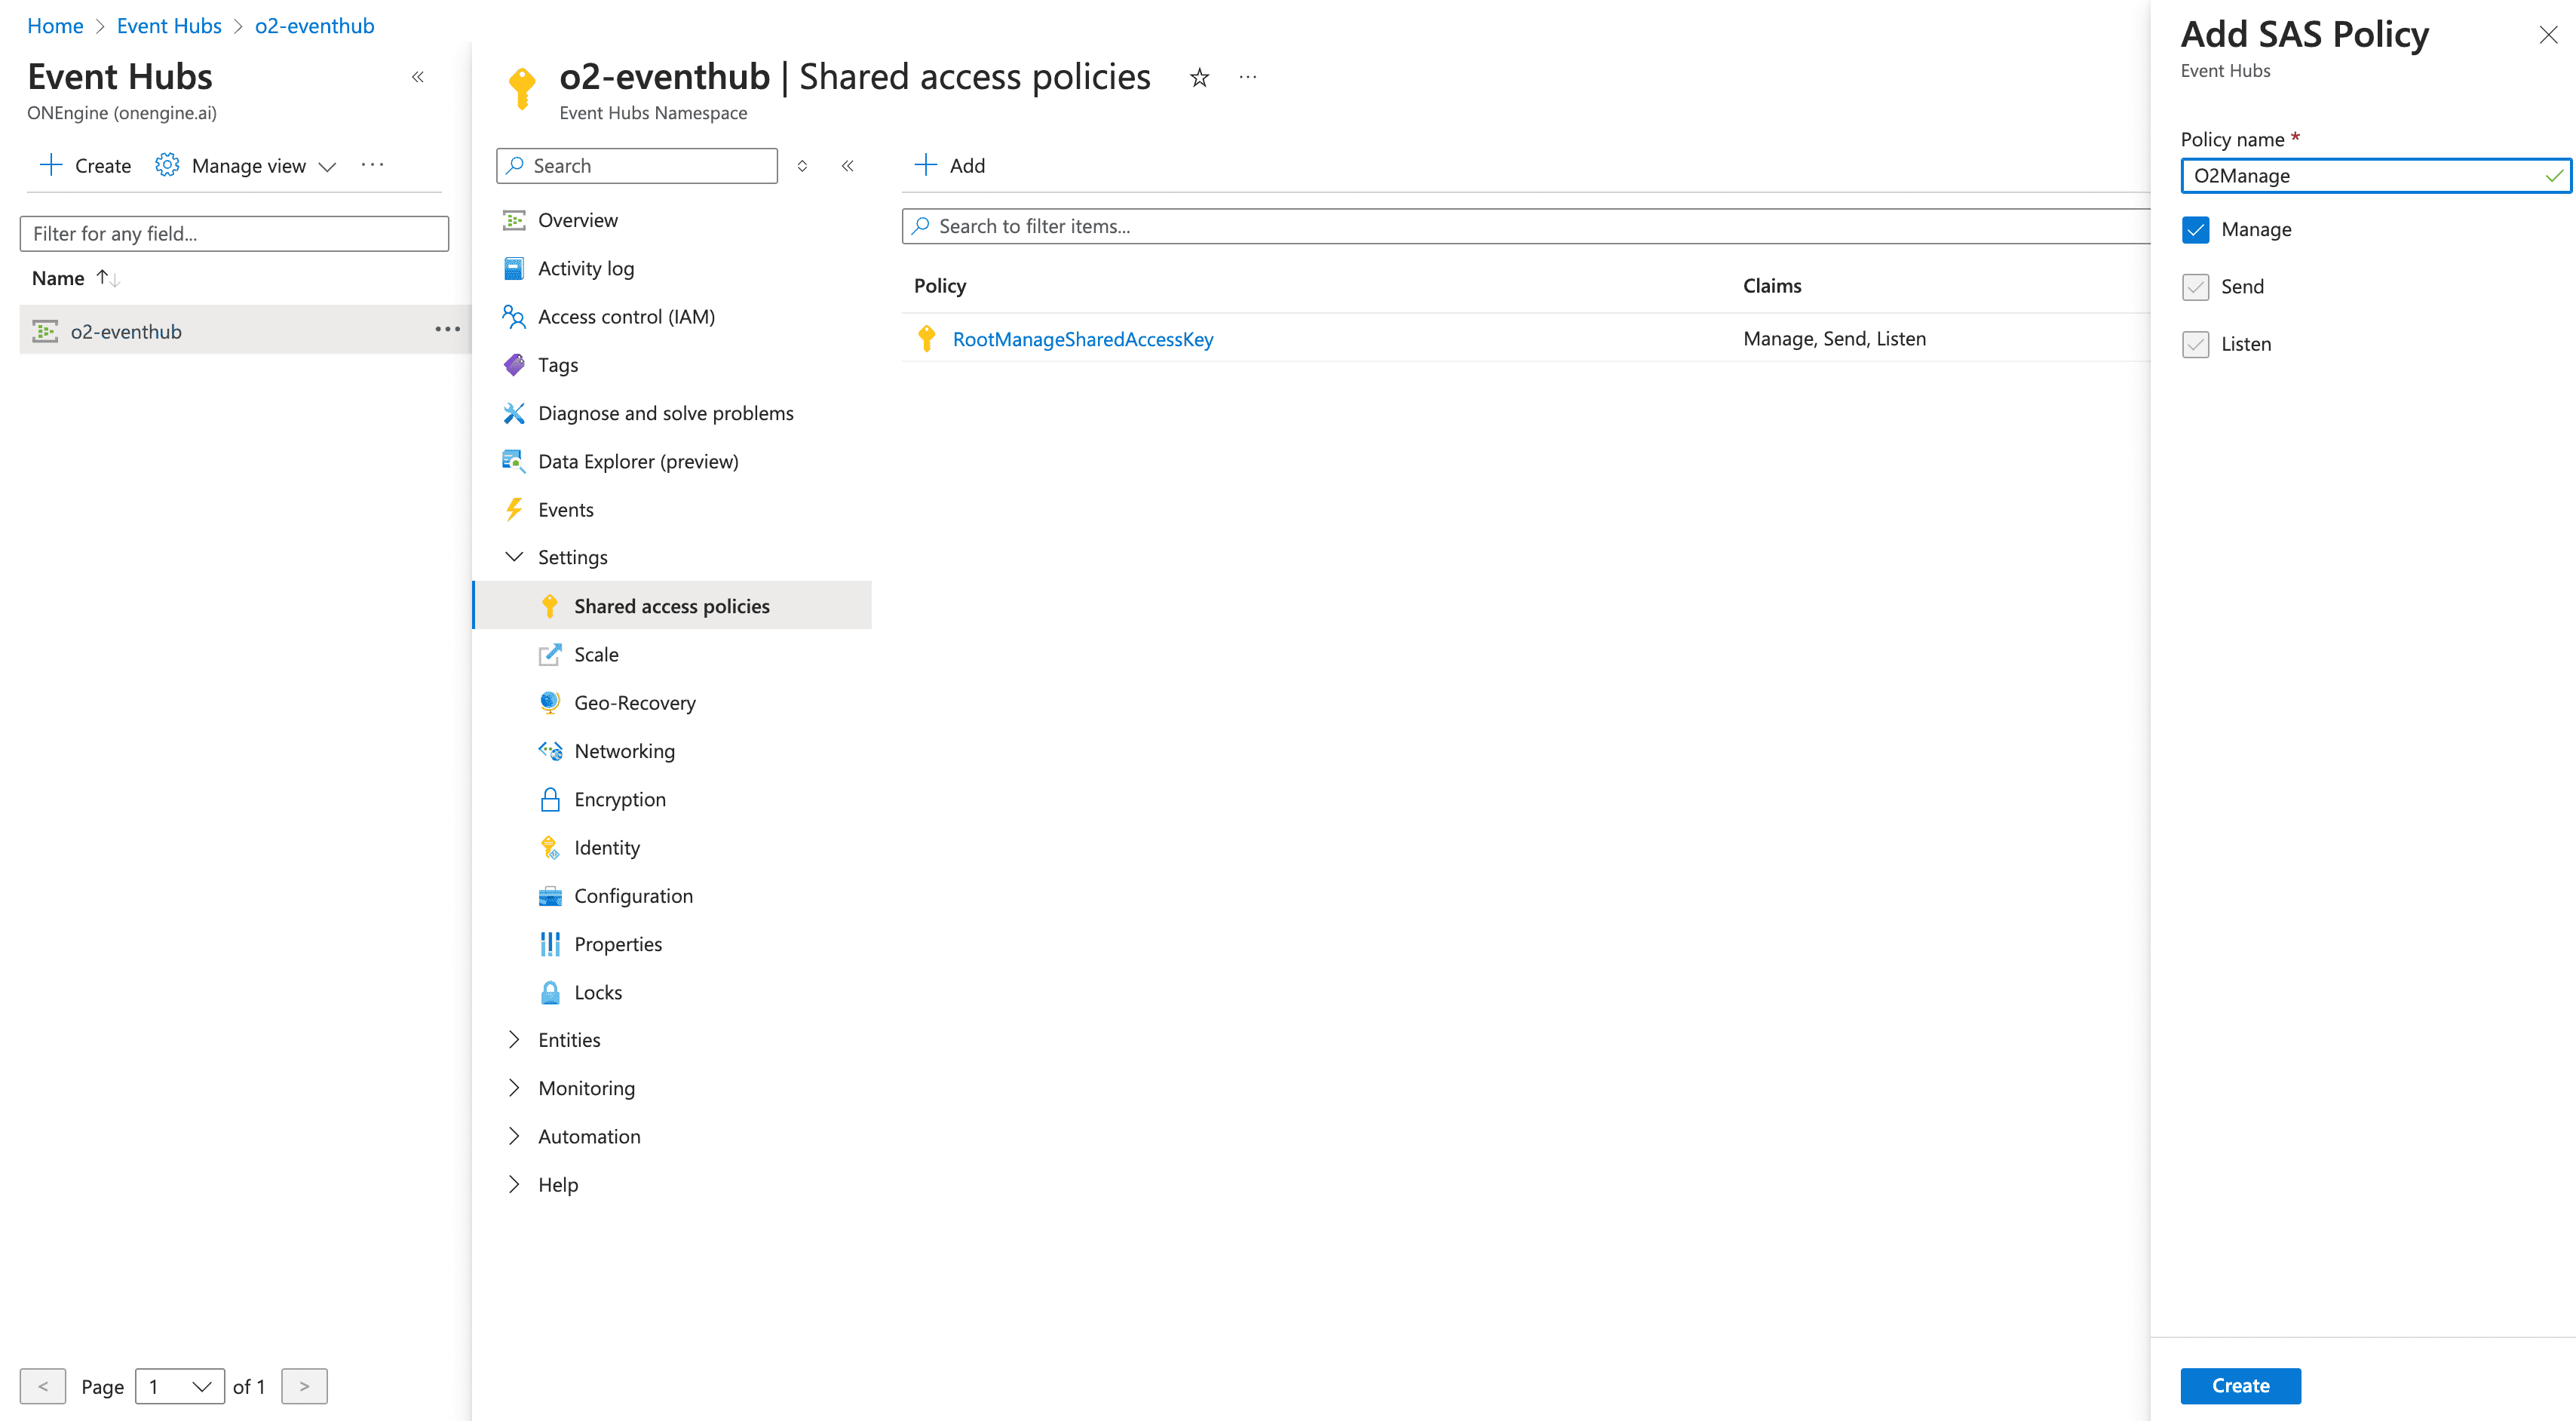
Effortlessly monitor your Azure services with Azure Monitor Diagnostic Settings and Event Hubs exports.
OpenObserve’s Key Azure Monitoring Capabilities
Real-Time Visibility & Insights
Continuous Data Collection
Capture every Azure signal as it happens through Event Hubs, Diagnostic Settings, and Azure Monitor integrations. Monitor your entire cloud environment with zero blind spots, maintaining complete visibility across all resources.
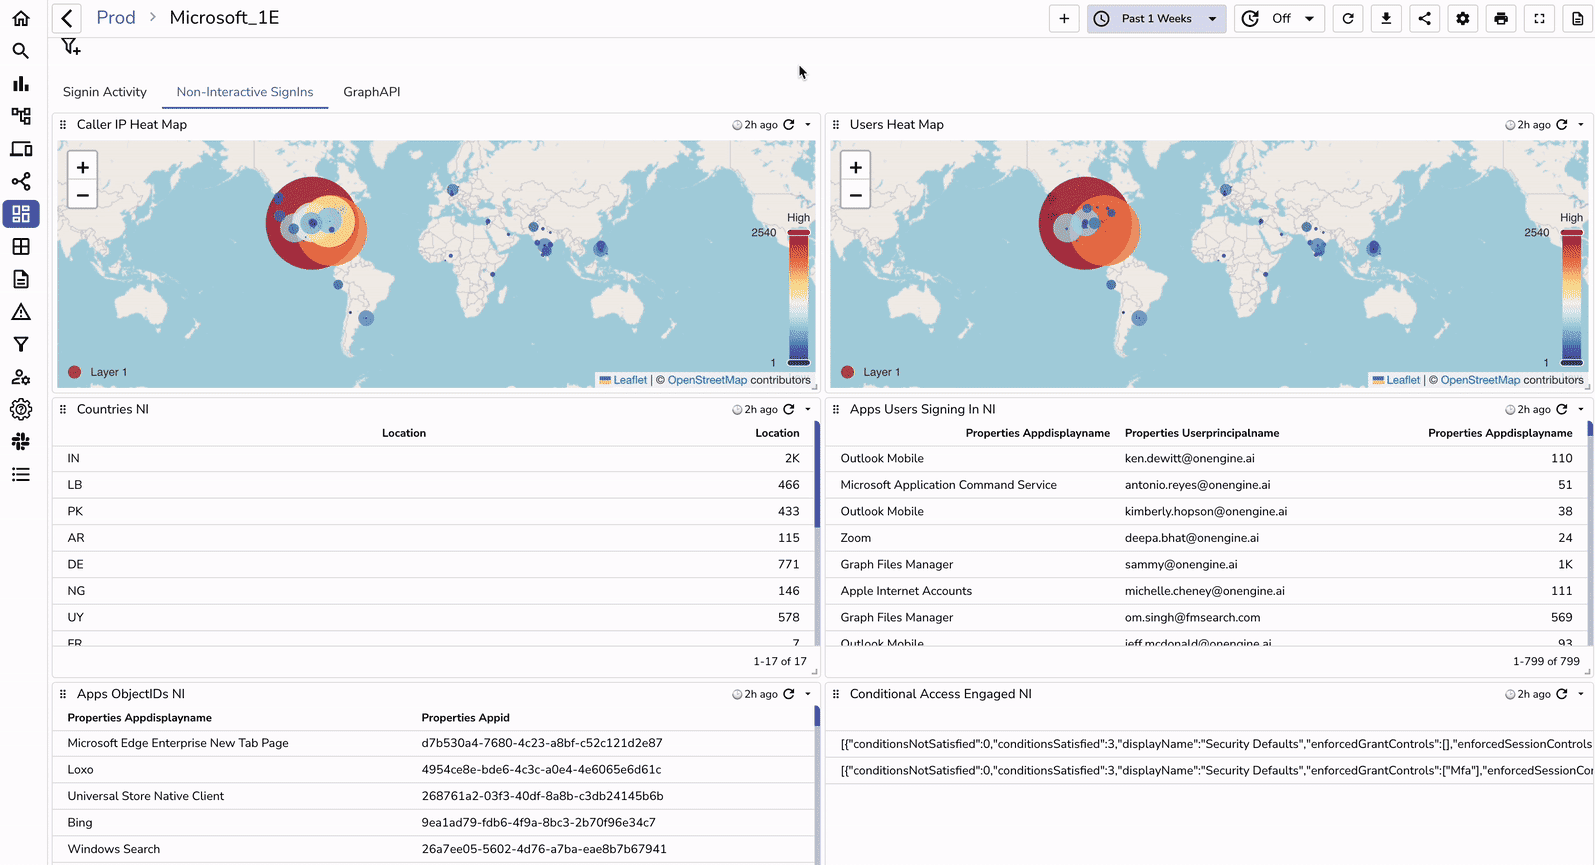
Prebuilt Dashboards
Instantly grok Azure metrics with ready-to-use and customizable visualizations. Spot trends, identify anomalies, and make decisions with confidence using real-time, interactive dashboards.
Azure Monitoring FAQs
Ready to get started?
Try OpenObserve today for more efficient and performant observability.