OpenObserve deployment on Kubernetes

Johnson Huynh
December 14, 2023
10 min read
Don’t forget to share!
Try OpenObserve Cloud today for more efficient and performant observability.

In the dynamic landscape of modern cloud infrastructure, ensuring the reliability and performance of applications is paramount. As our organization embarked on a journey to elevate our monitoring capabilities, the quest for a robust alternative to DataDog led us to OpenObserve—an innovative monitoring solution designed to meet the evolving needs of today's enterprises.
In this blog post, we delve into the heart of our monitoring transformation, sharing insights into how we seamlessly deployed OpenObserve on our Azure Kubernetes Service (AKS) cluster. Our choice of OpenObserve was influenced by its powerful feature set and its ability to adapt to the intricacies of our Azure environment.
Due to OpenObserve's high compression ratio and low memory footprint, we were able to deploy it on our AKS cluster without any performance degradation with noticebly low storage cost compared to other platforms. We also discuss how we leveraged OpenObserve's customizable version of OpenTelemetry collector to collect logs, metrics, and traces from our applications. Finally, we share our experience of using OpenObserve to monitor our applications and the benefits we have realized from this transformation.
This article will assume you have your own AKS cluster deployed and some prior knowledge on deploying applications using helm. Though this article will primarily focus on deploying OpenObserve on AKS, the steps are similar for other Kubernetes clusters with a few minor changes.
Create a namespace in your AKS cluster to deploy OpenObserve to. This is optional but recommended to keep your cluster organized.
kubectl create namespace openobserve
Create a storage account in Azure and a blob container within the storage account. This will be used to store the OpenObserve configuration files. This can be done either utilizing Azure CLI or the Azure portal.
Storage account
az storage account create \
    --name <storage-account> \
    --resource-group <resource-group> \
    --location <location> \
    --sku Standard_ZRS \
     --encryption-services blob
Container
az storage container create \
    --account-name <storage-account> \
    --name <container> \
    --auth-mode login
OpenObserve can be deployed one of two ways but for this article we will be deploying as helm.
If you prefer to deploy using kubectl (single node mode) you can follow their quickstart guide here.
As for the helm chart (for HA deployment), it can be found here and the values.yaml file can be found here. The values.yaml file can be modified to fit your needs. The following values are required to be modified when deploying in AKS:
    auth:
      ZO_ROOT_USER_EMAIL: "your email"
      ZO_ROOT_USER_PASSWORD: "your password"
      AZURE_STORAGE_ACCOUNT_KEY: "azure storage account key"
      AZURE_STORAGE_ACCOUNT_NAME: "azure storage account name"
    config:
      ZO_LOCAL_MODE: "false"
      ZO_S3_PROVIDER: azure
      ZO_S3_BUCKET_NAME: "name of container"
      ZO_META_STORE: postgres
      ZO_META_POSTGRES_DSN: "postgresql://[user]:[password]@[host]:[port]/[database]"
Notice that the ZO_META_STORE is set to postgres. This is because we will be using a PostgreSQL database to store the OpenObserve metadata. If you prefer to use default etcd, you can change the ZO_META_STORE from postgres to etcd and remove ZO_META_POSTGRES_DSN values from the values.yaml file. Advantage of using postgres as meta store is that we can use a hosted service like Azure Database for PostgreSQL. This will reduce the overhead of managing the database. Choosing etcd as metastore will require you to manage the etcd cluster yourself, take backups and have restoration plan in place. etcd will still be installed, hiwever its purpose will only be cluster coordination. If the etcd cluster goes down for whatever reason you can bring another cluster up and OpenObserve will automatically recover and start working.
ZO_LOCAL_MODE should be set to false to since we're deploying to a production environment.
Within the auth section, you will also need to modify the AZURE_STORAGE_ACCOUNT_NAME and AZURE_STORAGE_ACCOUNT_KEY values to match your Azure storage account name and key. The ZO_S3_BUCKET_NAME value should be set to the name of the blob container you created earlier.
You can access OpenObserve either by port-forwarding for local acesss or using external access using ingress. For this article within our production environment we wanted to access OpenObserve via an nginx ingress controller. To do this, we modified the values.yaml file to include the following:
ingress:
  enabled: "true"
  className: nginx
  annotations:
    cert-manager.io/issuer: "your issuer"
    kubernetes.io/tls-acme: true
  hosts:
    - host: example.host.com
      paths:
        - path: /
          pathType: ImplementationSpecific
  tls:
    - secretName: example.host.com
      hosts:
        - example.host.com
Once the values.yaml file has been modified, you can deploy OpenObserve using helm.
helm repo add openobserve https://charts.openobserve.ai
 helm repo update
 helm install openobserve openobserve/openobserve -n openobserve -f values.yaml
You can validate that the pods are running by running the following command:
kubectl get pods -n openobserve
You can access the OpenObserve UI by accessing the hostname that was set within the values.ingress.hosts section of the values.yaml file. Once you access the UI, you will be prompted to login. The username and password is the email and password you set within values.auth.
OpenObserve is a monitoring solution that is designed to be vendor agnostic. This means that it can be used to monitor any application regardless of the language or framework and can be used to collect logs, metrics, and traces from your applications. To do this, OpenObserve utilizes an optimized pre-configured version of OpenTelemetry collector called OpenObserve-collector.
The below steps are here for completeness. You can get the most updated version of installing openobserve-collector from Ingestion page in OpenObserve UI.
cert-manager
cert-manager is required to be installed in the cluster. If you already have cert-manager installed then you can skip this step. You can install cert-manager using the following command:
kubectl apply -f https://github.com/cert-manager/cert-manager/releases/download/v1.13.1/cert-manager.yaml
Wait for 2 minutes after installing cert-manger for the webhook to be ready before installing OpenTelemetry operator.
OpenTelemetry operator
If you already have OpenTelemetry operator installed then you can skip this step.
kubectl apply -f https://github.com/open-telemetry/opentelemetry-operator/releases/latest/download/opentelemetry-operator.yaml
OpenObserve-collector can be deployed using helm. The helm chart and values file can be found here.
The values.yaml file can be modified to fit your needs. The following values are required to be modified when deploying on AKS cluster:
exporters:
  otlphttp/openobserve:
    endpoint: https://example.host.com/api/default/
    headers:
      Authorization: Basic "base64 encoded username:password"
  otlphttp/openobserve_k8s_events:
    endpoint: https://example.host.com/api/default/
    headers:
      Authorization: Basic "base64 encoded username:password"
      stream-name: k8s_events
Note: For starting quickly with default settings, follow the instructions on the Ingestion page in OpenObserve UI.
The endpoint value should be set to the hostname of your OpenObserve instance. The Authorization value should be set to credentials you get get from Ingestion page in OpenObserve UI . The stream-name value should be set to the name of the stream you want to send the data to.
Opentelemetry collector scrapes metrics using receivers. With OpenObserve-collector, you can use all the receivers that are available with OpenTelemetry collector. For this article, we will want to monitor our AKS cluster and run http checks against a few of our endpoints. OpenObserve-collector already has a few receivers enabled by default that allows us to monitor our AKS cluster. These receivers are:
You can find the default values for these receivers here, under the values.gateway.receiver section.
In addition we want to check whether our application/website is up and running. To do this, we will use the http receiver. The http receiver can be enabled by adding the following to the values.gateway.receiver section:
gateway
  receivers:
    httpcheck:
      targets:
        - endpoint: https:/example.com
          method: GET
      collection_interval: 10s
We will need to add the httpcheck to the services section located under values.gateway.services like so:
service:
  pipelines:
    logs/k8s_events:
      receivers: [k8s_events]
      processors: [batch, k8sattributes, resourcedetection]
      exporters: [otlphttp/openobserve_k8s_events]
    metrics:
      receivers: [httpcheck, k8s_cluster, prometheus, spanmetrics, servicegraph]
      processors: [batch, k8sattributes, resourcedetection]
      exporters: [otlphttp/openobserve]
    traces:
      receivers: [otlp]
      processors: [batch, k8sattributes, resourcedetection]
      exporters: [otlphttp/openobserve, spanmetrics, servicegraph]
Once the values.yaml file has been modified, you can deploy OpenObserve-collector using helm.
kubectl create namespace openobserve-collector
helm --namespace openobserve-collector -f values.yaml install o2c openobserve/openobserve-collector
You can validate that the pods are running by running the following command:
kubectl get pods -n openobserve-collector
Now that we have OpenObserve and OpenObserve-collector deployed, we can start monitoring our cluster and applications.
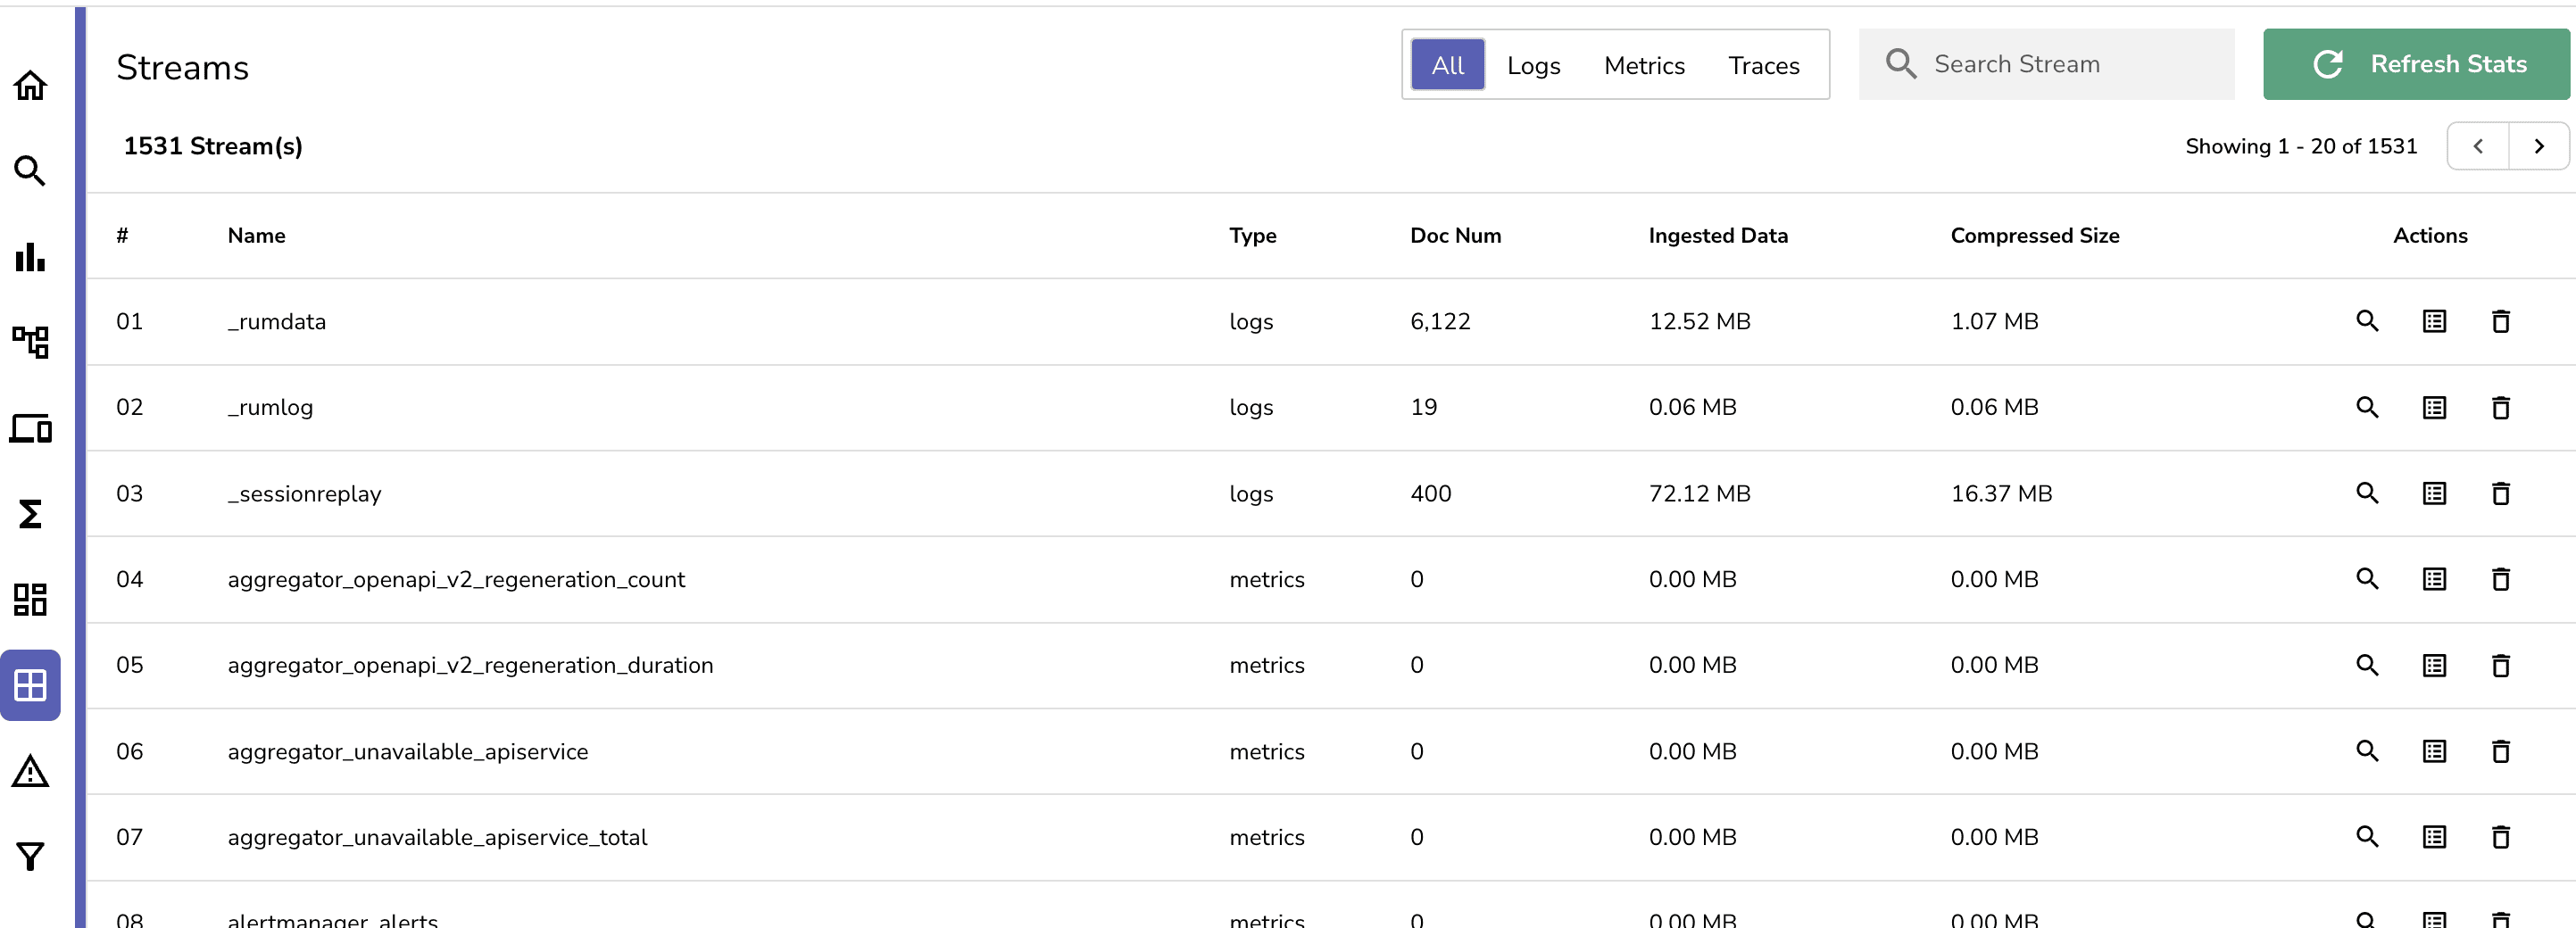
Access the OpenObserve UI dashboard and navigate to the Streams tab. You should see the streams that the openobserve-collecter has been scraping. You can click on the stream to view the data that is being sent to that stream.
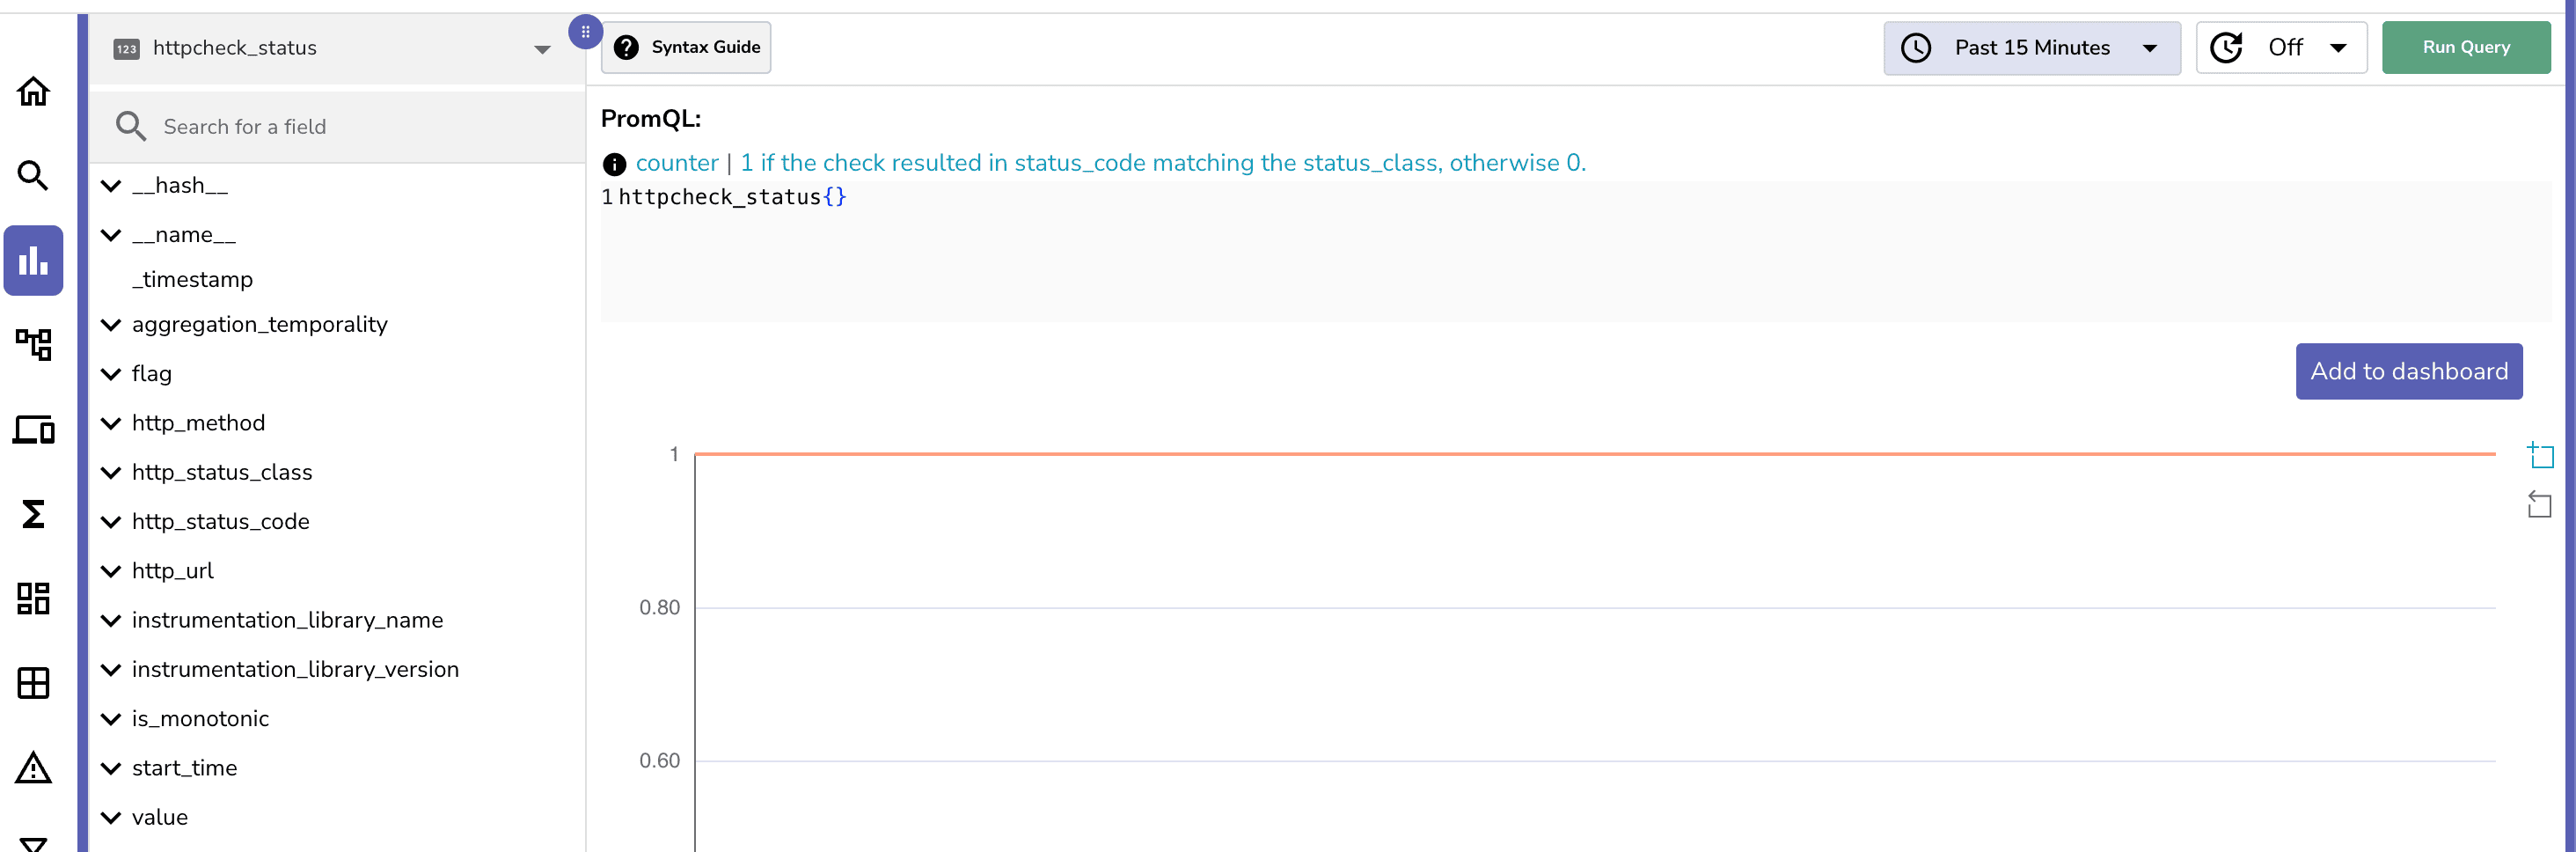
You can also navigate to the Metrics tab to view the metrics that are being collected. You can also create dashboards to visualize the metrics.
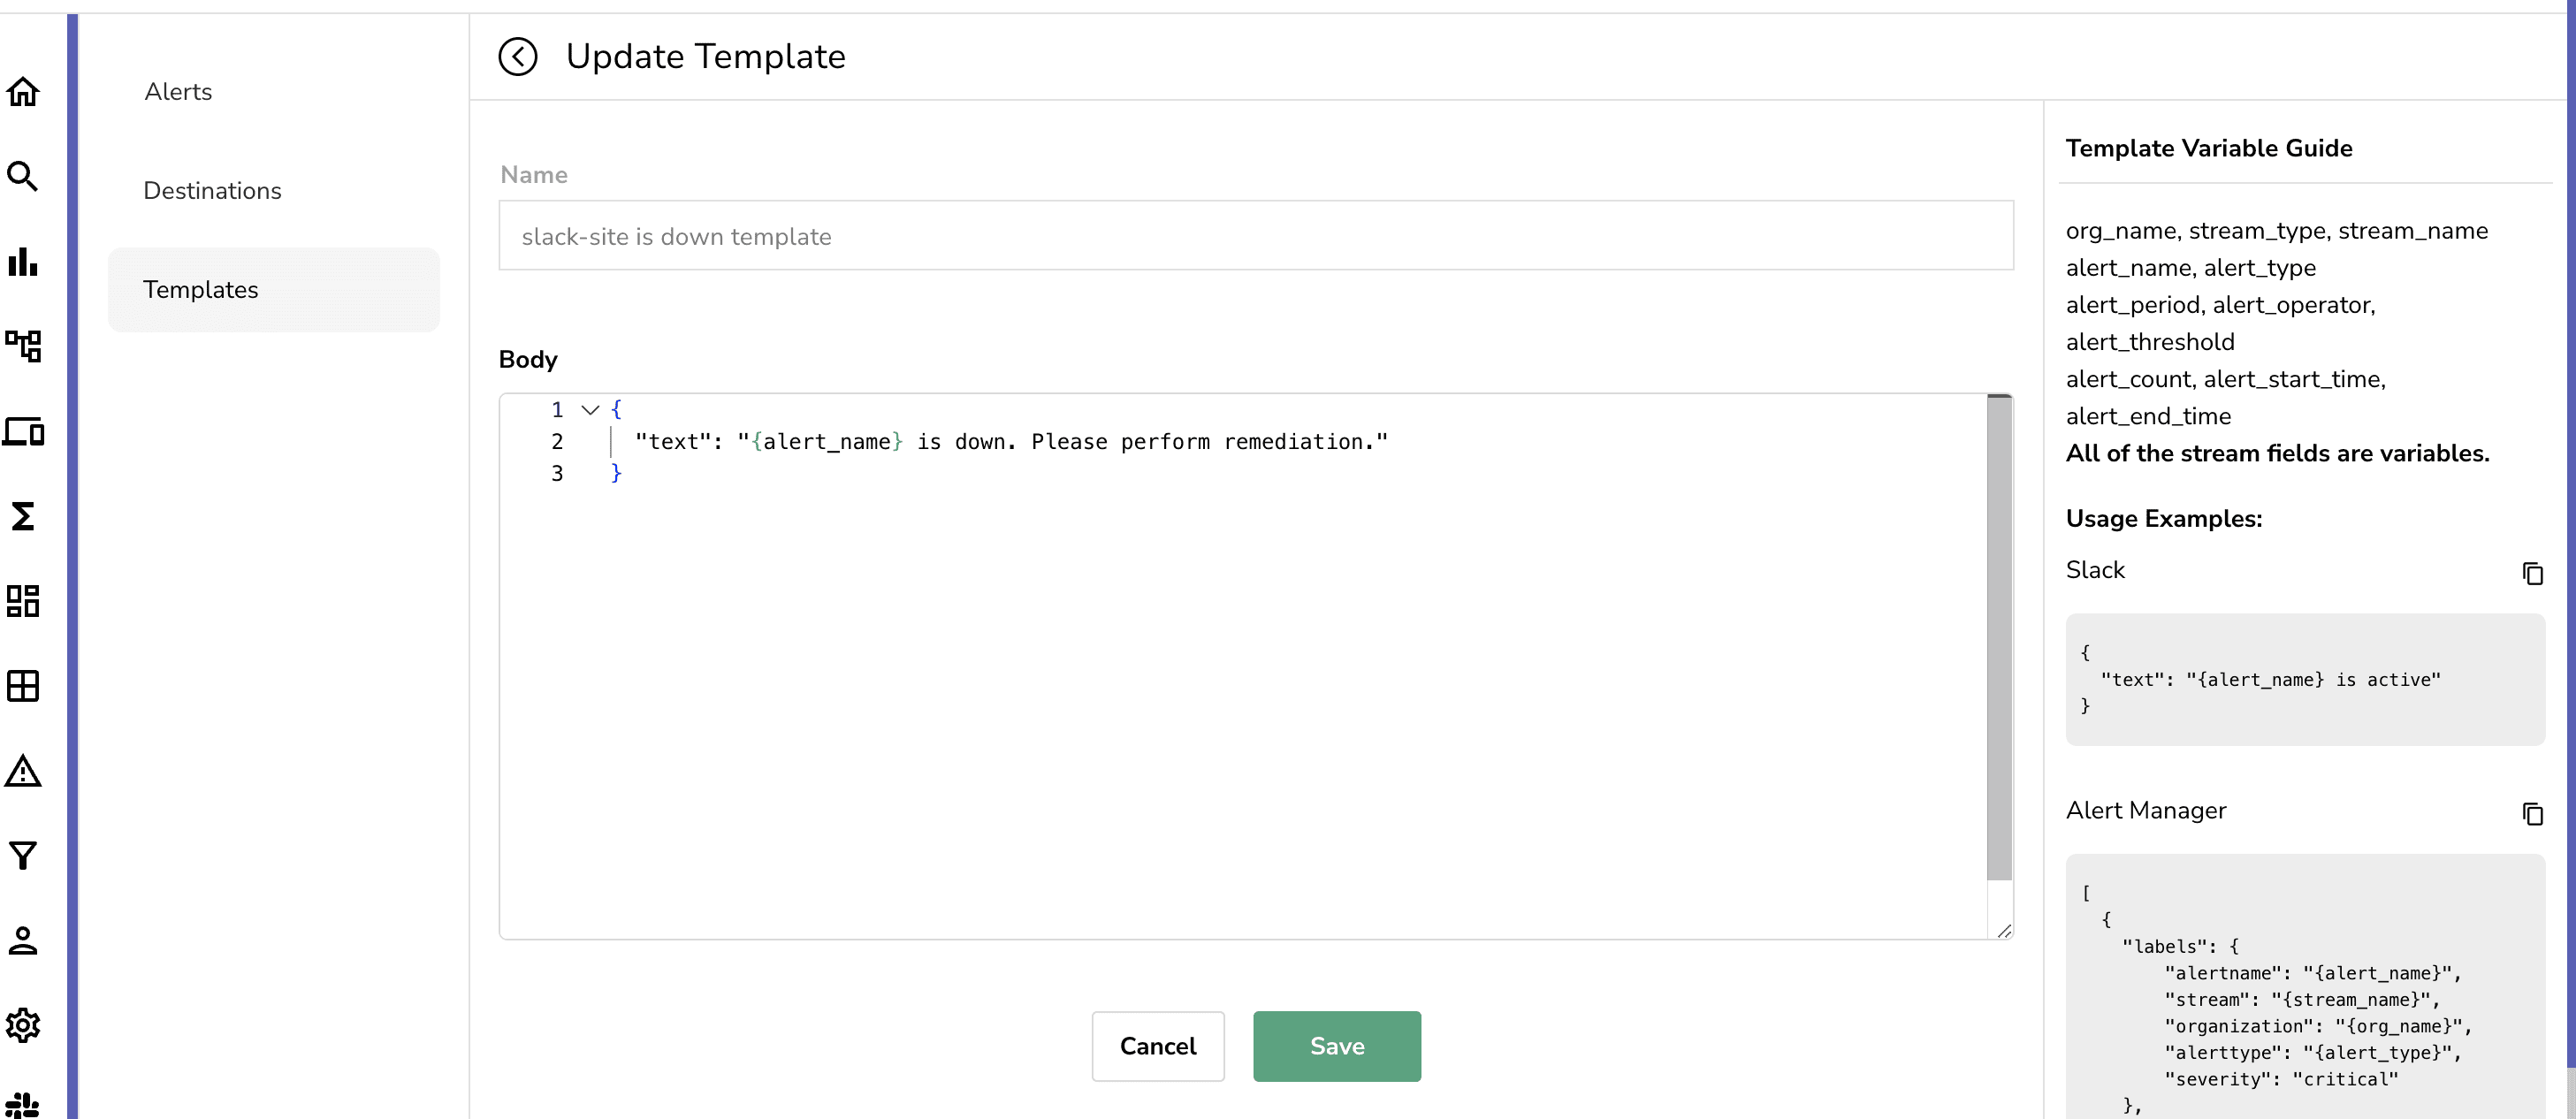
OpenObserve also has an alerting feature that allows you to create alerts based on the metrics that are being collected. In order to create an alert you would need to set a template for the alert and then the destination of where the alert will be sent to for notification. You can set the template by navigating to the Templates tab and clicking on Add Template. You can then select the type of template you want to create. For this article, we will be creating a Slack template. You can create a Slack template by setting the name of the template first and then setting the message in the body. As of writing of this blog there are only a few variables you can use but access to a lot more variables is coming soon that will make the message more robust.
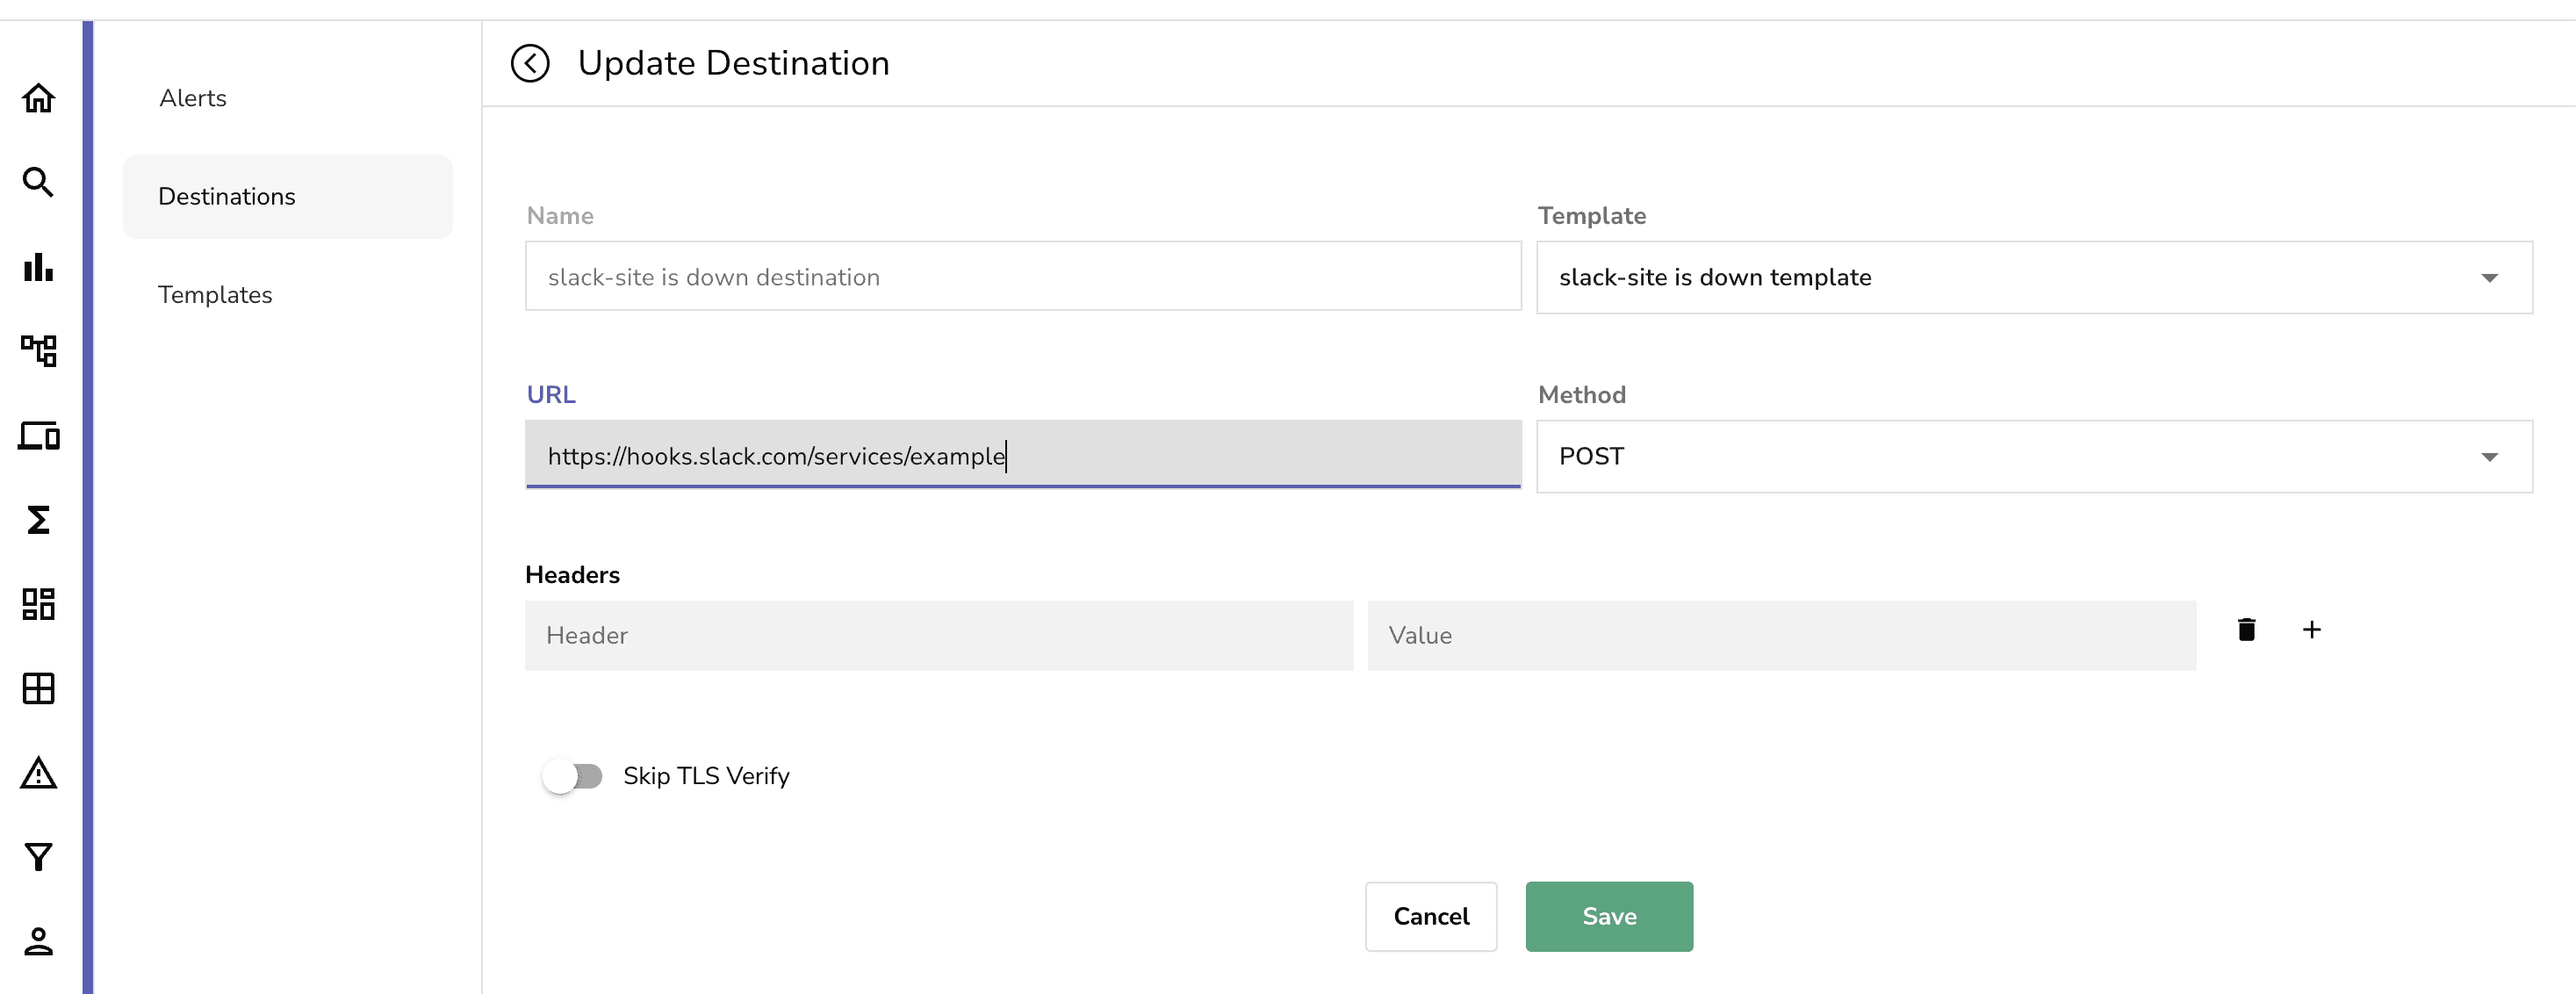
Once you have created the template, you can set the notification channel to send the alert to. You can set the notification channel by navigating to the Destinations tab and clicking on Add Destination. From here you can set the name and then the template that you want to use. For this article, we will be using the Slack template we created earlier. You can then set the slack webhook within the URL section. You can find more details on how to configure a slack webhook here. Once you have set the webhook, you can click on Save.
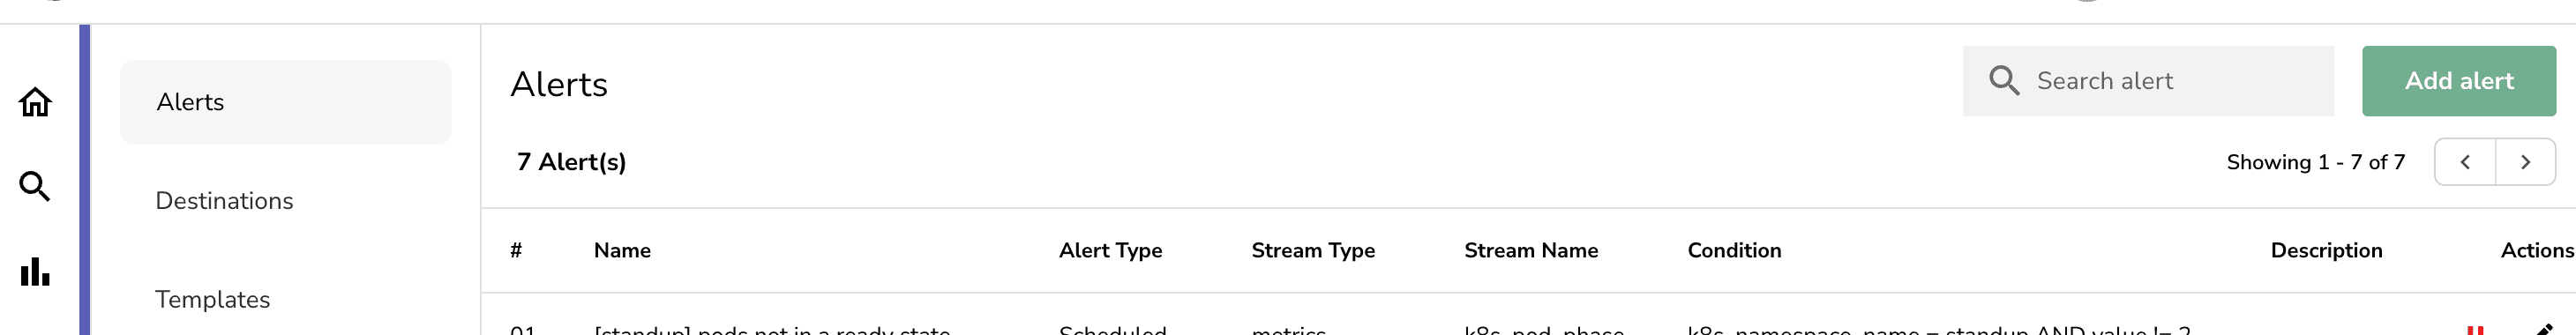
Now last but not least is setting up the alerts. You can create alerts by navigating to the Alerts tab and clicking on Add Alert.
You can then select the stream and metric you want to create an alert for. You can also set the threshold and the time period for the alert.
For example:
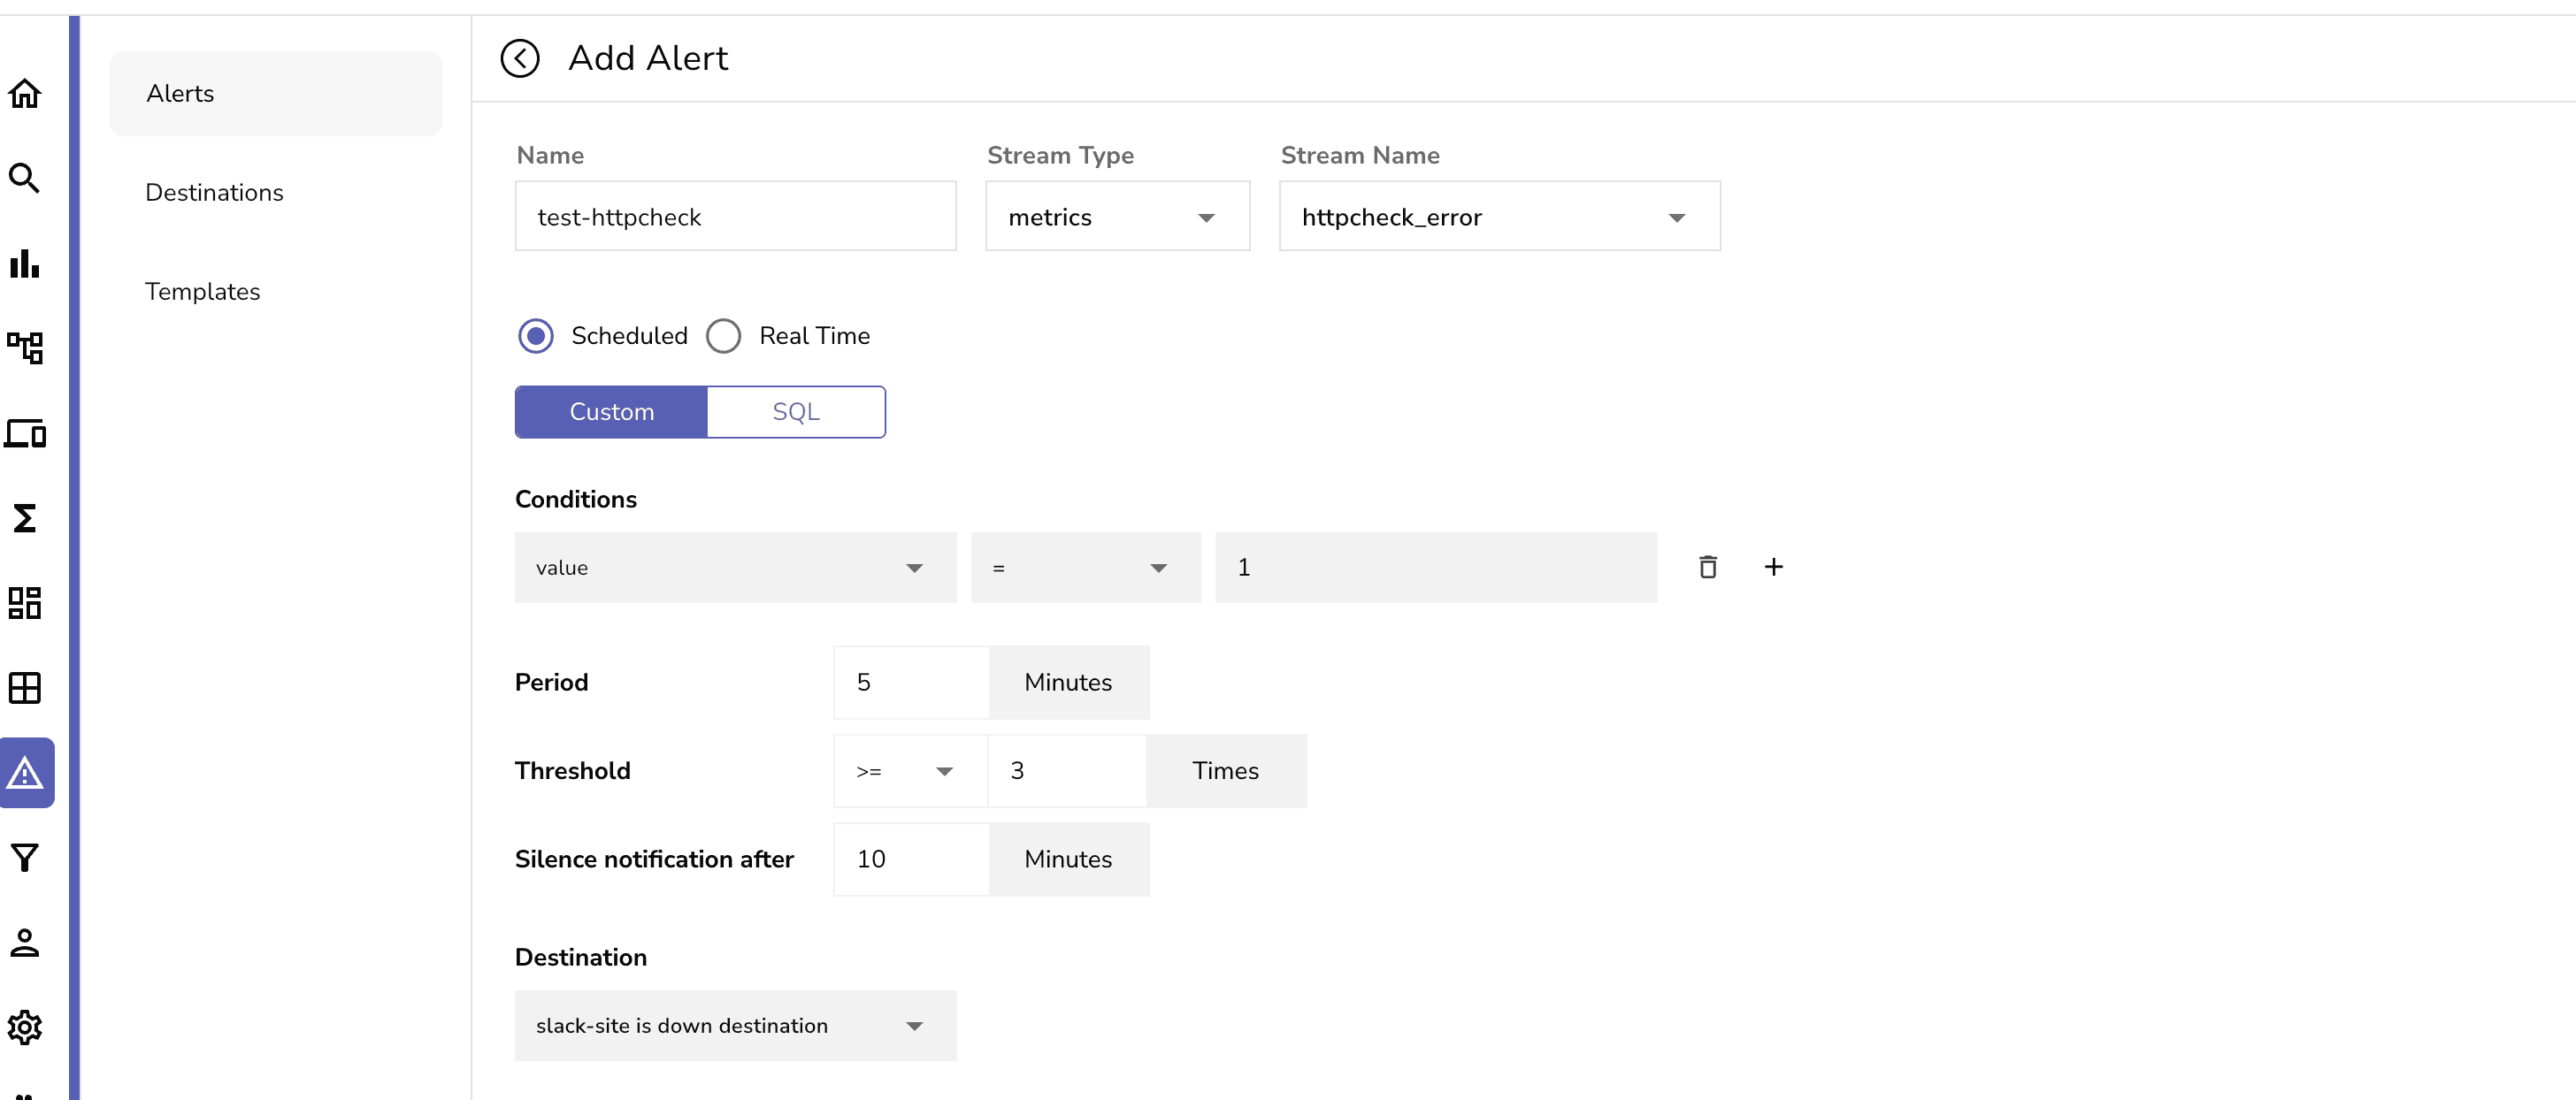
This example above demonstrates how to create an alert for a application that is not receiving a HTTP status code of 200 for the httpreceiver we set up earlier in the values section of openobserve-collector. This alert will trigger if the value of 1 is seen more than 3 times within a 5 minute period.
OpenObserve is a powerful monitoring solution that can be used to monitor any application regardless of the language or framework. It is also a great alternative to other monitoring solutions such as DataDog. OpenObserve is cloud agnostic so it could be deployed to any cloud and storage provider. In this article we demonstrated how to deploy OpenObserve on Azure Kubernetes Service (AKS) and how to use OpenObserve-collector to collect logs, metrics, and traces from our applications. We also demonstrated how to use OpenObserve to monitor our applications and how to set up alerts to notify us when something goes wrong.
Johnson, a DevOps Engineer at Standup AI, boasts a rich tapestry of expertise across diverse Information Technology domains. Armed with a comprehensive skill set ranging from virtualization to the latest advancements in cloud technologies, he is unwaveringly committed to propelling innovation and operational efficiency within the field. With a thirst for continuous improvement, Johnson is currently focused on expanding his knowledge and mastering new dimensions within his role as a DevOps Engineer. Beyond the professional sphere, he dedicates his spare time to quality moments with his first son and wife.