Kubernetes Monitoring
Complete Kubernetes visibility, from cluster to pod, in minutes.
Why use OpenObserve for Kubernetes?
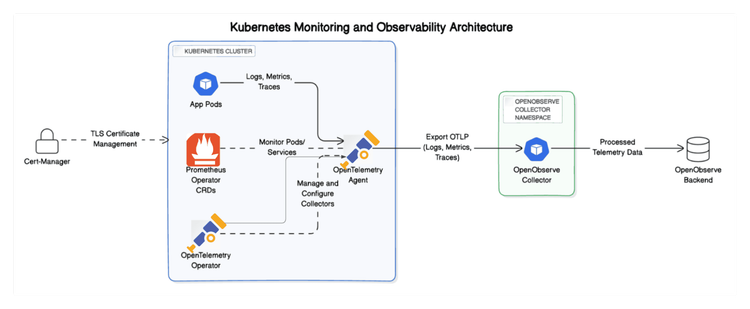
Full visibility into containers, workloads, and infrastructure performance across clusters.
Complete Kubernetes Observability
Full visibility into containers, workloads, and infrastructure performance across clusters.
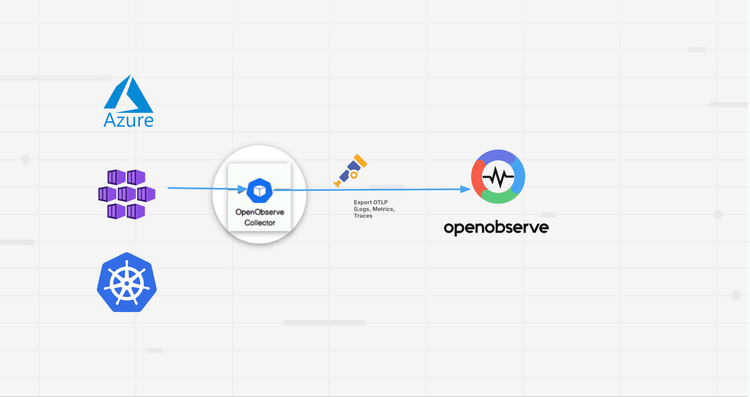
Stand Up In Minutes
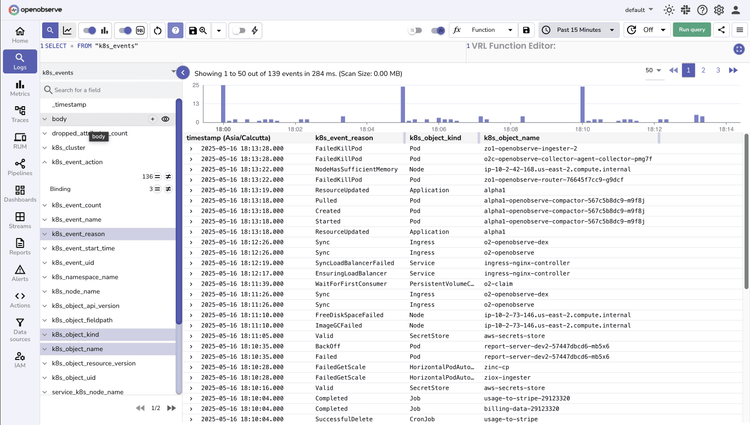
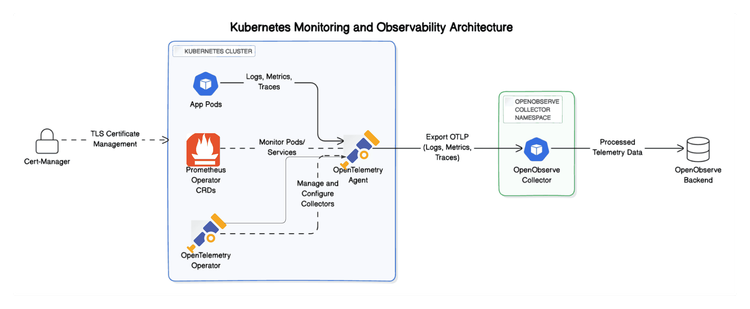
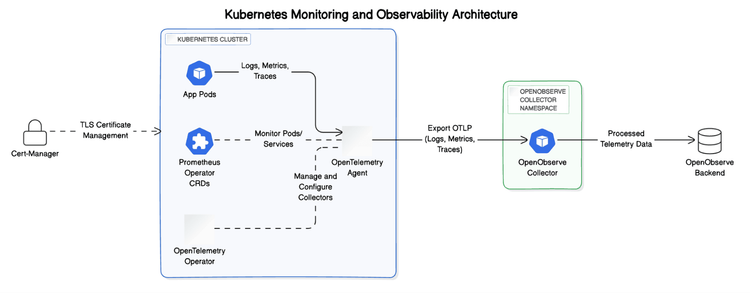
Monitor your Kubernetes environment instantly with the OpenObserve Collector. Automatically capture metrics, logs, and traces.
Reduce Kubernetes Costs
Identify Kubernetes inefficiencies and optimize resources for immediate cost savings.
OpenObserve’s Key Kubernetes Monitoring Capabilities
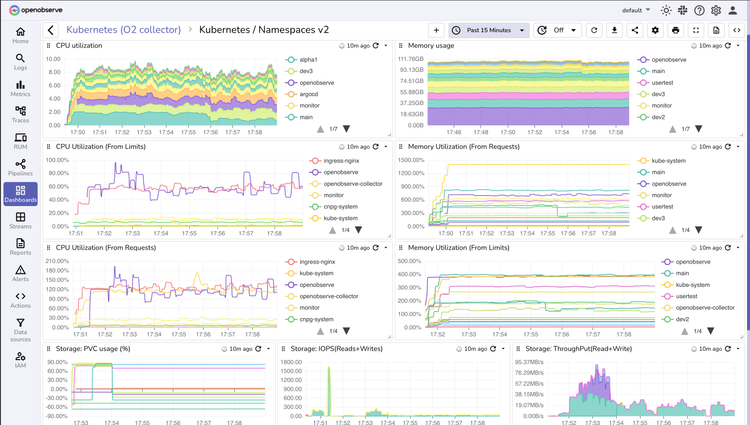
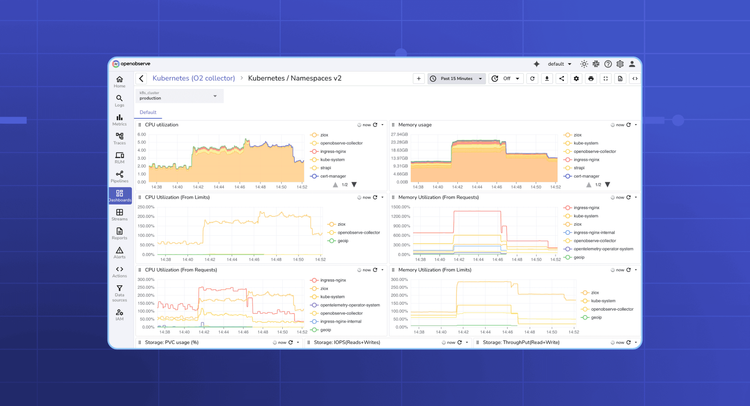
Unified Kubernetes Monitoring
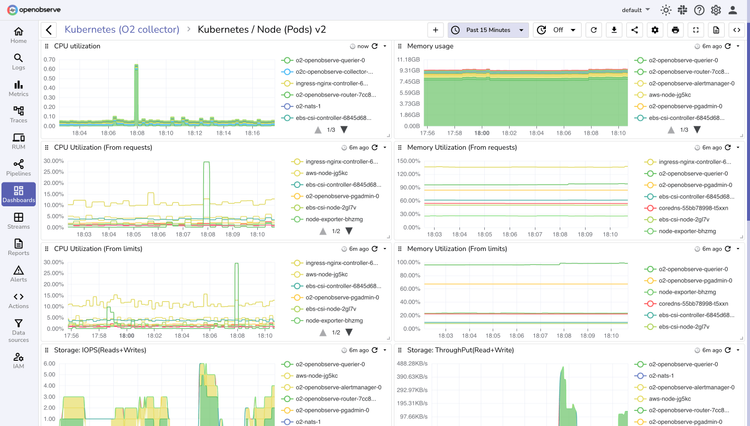
Pod-Level Observability
Monitor detailed CPU, memory, and network metrics at the pod level for precise performance optimization and capacity planning.
Real-Time Insights
View application performance and infrastructure health through intuitive dashboards that update in real-time.
Kubernetes Monitoring FAQs
Latest From Our Blogs


Ready to get started?
Try OpenObserve today for more efficient and performant observability.