Introduction
OpenObserve is an open source, cloud native observability platform that provides ~140x (YMMV. Could be higher or lower based on data entropy) lower storage costs compared to Elasticsearch. Use cases include real-life log data search/analysis and overall observability needs with significantly reduced operational costs, and ease of use. It can scale to petabytes of data, is highly performant, and allows you to sleep better at night 😴. If you are looking for an observability tool for logs, metrics, and traces, take a look at OpenObserve and how its approach towards observability could help you build better software and save money on observability costs.
We built OpenObserve with the following design principles and architecture in mind:
- Fast and efficient log search: We consider efficiency as the ability to do maximum data searches or process data for minimum amount of money spent on compute, storage and anything else (minus human effort).
- Rust as the programming language for its safety and performance
- s3/minio/gcs/azure blob for observability data storage
- Storage of data in columnar format to speed up analytics
- Support very high cardinality
- True compute and storage decoupling with stateless nodes
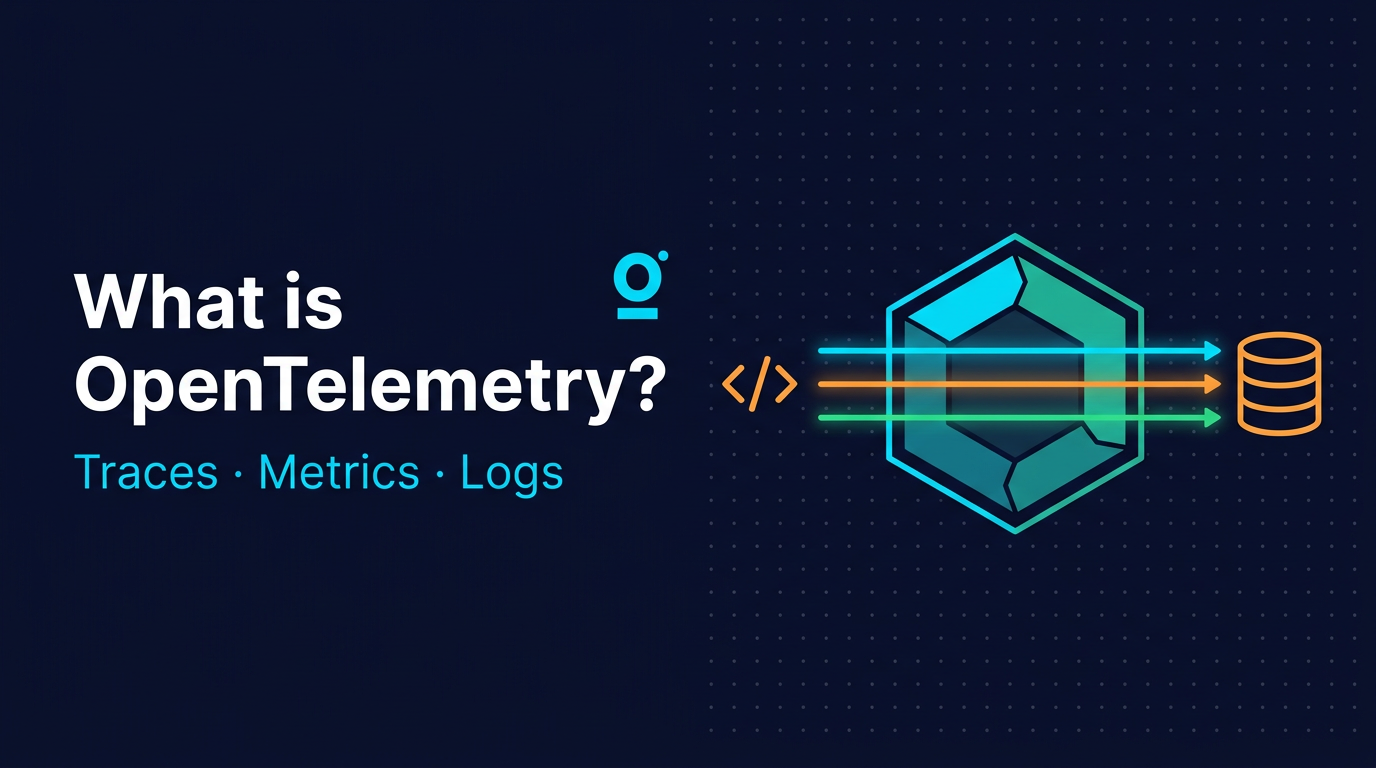
- Core engine designed to offer a complete observability solution (logs, metrics, traces) from the ground up and not just some features as an afterthought retrofitting things
We will dig deeper into how we achieve massively higher efficiency compared to existing observability tools in a series of blogs. But for now let’s take a look at why we even thought of building OpenObserve in the first place.
Yet another log search engine!!! Why?
The vast majority of customers that we talked to indicated the following pain points with their existing observability solutions:
- Day 1 - Setup: Difficulty in getting started. This generally involves:
- Installing it in the user’s environment
- Upfront planning, such as number of shards, which fields to index, set mappings (Elasticsearch), as well as defining labels upfront (Loki)
- Configuring it to be usable by the users
- Some of the systems even require the user to have Kafka operating at large scale to avoid any data loss
- Day 2 - Keeping it up and running: Difficulty in maintenance. We have all heard horror stories around Elasticsearch regarding:
- Provisioning
- Backups
- Upgrades
- Bringing the system back up, upon failures
- Scaling number of nodes up and down as need arises
- Features and Usability: Amazon CloudWatch has, for a long time, received logs by default from across the AWS services, but it has been so unusable that users set up logging using Elasticsearch on their own, or straight up use SaaS platforms like Datadog. When I first found Elasticsearch, I liked that the UX was vastly superior to CloudWatch. Datadog built an even better UI, and I loved using it. Point being, even if you have something as easily available as CloudWatch, it still has to be usable and should have the features to do its intended job efficiently, otherwise users will find alternatives.
- Cost: Some of the players like Splunk and Datadog, while providing great software, can become prohibitively expensive. Take a look at this reddit thread about Datadog’s pricing and costs. In general, cost breaks down into the following categories:
- Licensing
- Infrastructure costs: This comes in three forms:
- Compute: How many servers does the user need for search and analysis.
- Storage: How much storage is the user using for observability data (logs and traces data can quickly become huge). EBS volumes can become very expensive at large scale. (Planning for volumes and their lifecycle management is yet another headache.) This also puts constraints on the duration of data you can actually store, as the cost of data stored can exceed the perceived value it provides.
- Network: How much data is being transferred out of the system. Primarily egress costs by cloud service providers. ~$0.09/GB for AWS, GCP and Azure.
- Human resources: Generally relates to two kind of roles:
- DevOps/SRE/administration employees who need to spend time setting up and making sure that the system is up and running.
- Developers who are being told that they need to decide on how much observability data they can push and keep them manageable by keeping a tight watch on what they are logging. It is also the time spent to learn the vagaries of the platform like index mapping, query syntax, cardinality, etc. together with admins.
- For most SaaS platforms, the pricing is based on the amount of data that you throw at it.
- Learning curve: As much as I enjoy learning things, I hate learning different ways of doing the same thing for different tools. I also dislike learning things that can possibly be avoided. All the logging engines seem to bring their own query language for advanced querying.
- Elasticsearch has a custom DSL that you need to learn. Lately, SQL is supported though.
- Grafana Loki has LogQL.
- Datadog has its own query language.
- Performance: This was an area where fewer people complained considering they could just throw in a couple more servers if all other things are working fine. Nevertheless, this was a concern for many. Lower performance either results in degraded performance, elevated compute costs, or sometimes a simple inability to do the job at all when the query times out. Performance includes the following items:
- Ingestion: How fast can the user ingest
- Search: e.g. search for error in all of the log data
- Aggregations: e.g. give me totals for HTTP status codes from NGINX logs’
We also saw the limitations of SaaS platforms like Datadog, Loggly, Papertrail, Splunk, and Sumologic, which can be extremely expensive. In addition, many users prefer to keep their data private in their own data centers or AWS accounts. Our team took these challenges into account, and designed a system from the ground up that addresses each one.
Drawing on the experience of our team members and mine working with hundreds of AWS customers as an AWS Solutions Architect, we built a system that's both simple for beginners and sophisticated for advanced users.
Unlike existing systems built with outdated technologies, we're building a full observability platform using modern technologies that encompasses logs, metrics, and traces.
Guiding principles
When we decided to finally build, we had the following principles that we wanted to uphold:
- Day 1: Ease of getting started
- Users should be able to install (for the self-hosted option) or sign up (for SaaS platform) in less than two minutes.
- Users should be able to begin ingesting data in under two minutes and start observing the behavior of the applications without any major configuration.
- Day 2: Keep it up and running
- Application should be stable and in case of issues, it should be able to heal itself automatically.
- Majority of the users should be able to start using the system efficiently with ZERO configuration.
- Scaling up/down should be as easy as changing the number of nodes in an autoscaling group (in AWS) or changing the number of replicas (in k8s).
- Majority of users should not need backups or should be able to do it without DBA level skills.
- Upgrades should be easy and smooth and account for differences in different versions, and not cause system downtime or data loss.
- Features and Usability
- System should be highly usable from the get go - providing excellent ROI on the invested time. A great UI and API are important to achieve it.
- Logs themselves do not provide visibility into the application. Users need metrics and traces as well.
- Cost
- Users should not have to mortgage their house or company assets in order to run the system either in a self-hosted option (with or without licensing cost) or for a SaaS platform.
- Learning curve
- A user who has never used the system should be able to set up and use the system efficiently for basic needs or should be able to use existing skills for advanced purposes.
- Performance
- System should be highly performant for most of the use cases in the real world.
- Performance is generally a tradeoff. In situations of tradeoffs, it should be generally acceptable to the majority of the users with excellent tradeoff value in return.
Next step was to build the actual system which took us several months.
So what am I getting?
We built an open source observability platform OpenObserve that is:
Super easy to setup/use
- Users can try it on a laptop in less than two minutes utilizing less than 150 MB RAM and notice the superior performance.
- Users can install it in a k8s cluster in under two minutes and get the system up and running.
- Users will love the full featured no-nonsense powerful GUI.
- Users can use their existing skills of SQL for advanced query if they wish to do so.
Low operational overheads
- All user data goes to S3 (or stays local, as specified by user), nothing to manage there.
- Scale horizontally or vertically per users’ needs, quickly.
- Metadata is in sqlite/postgres/mysql. Proven external systems that are easy to manage.
Low cost
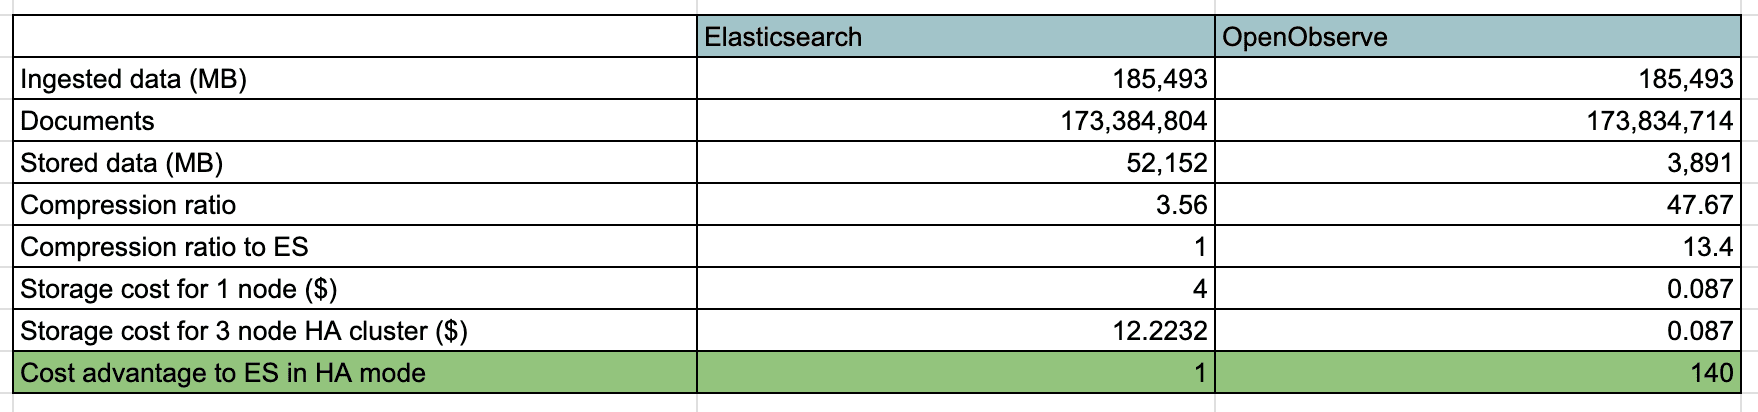
- Use of S3 for data storage allows users to lower their cost of storage compared to Elasticsearch by a factor of ~140x, which is a major cost for logging systems.
- Extremely low compute requirements during ingestion (~6x YMMV based on data and hardware).
High performance engine
- OpenObserve is built in Rust, leveraging its high performance.
- We use automatic and manual partitioning of data for better performance.
- We also use in-memory caching where we store the compressed data in memory and can store 1 TB of data in under 35 GB RAM (at ~30x compression, although you get much higher compression for real life logs).
Advanced features:
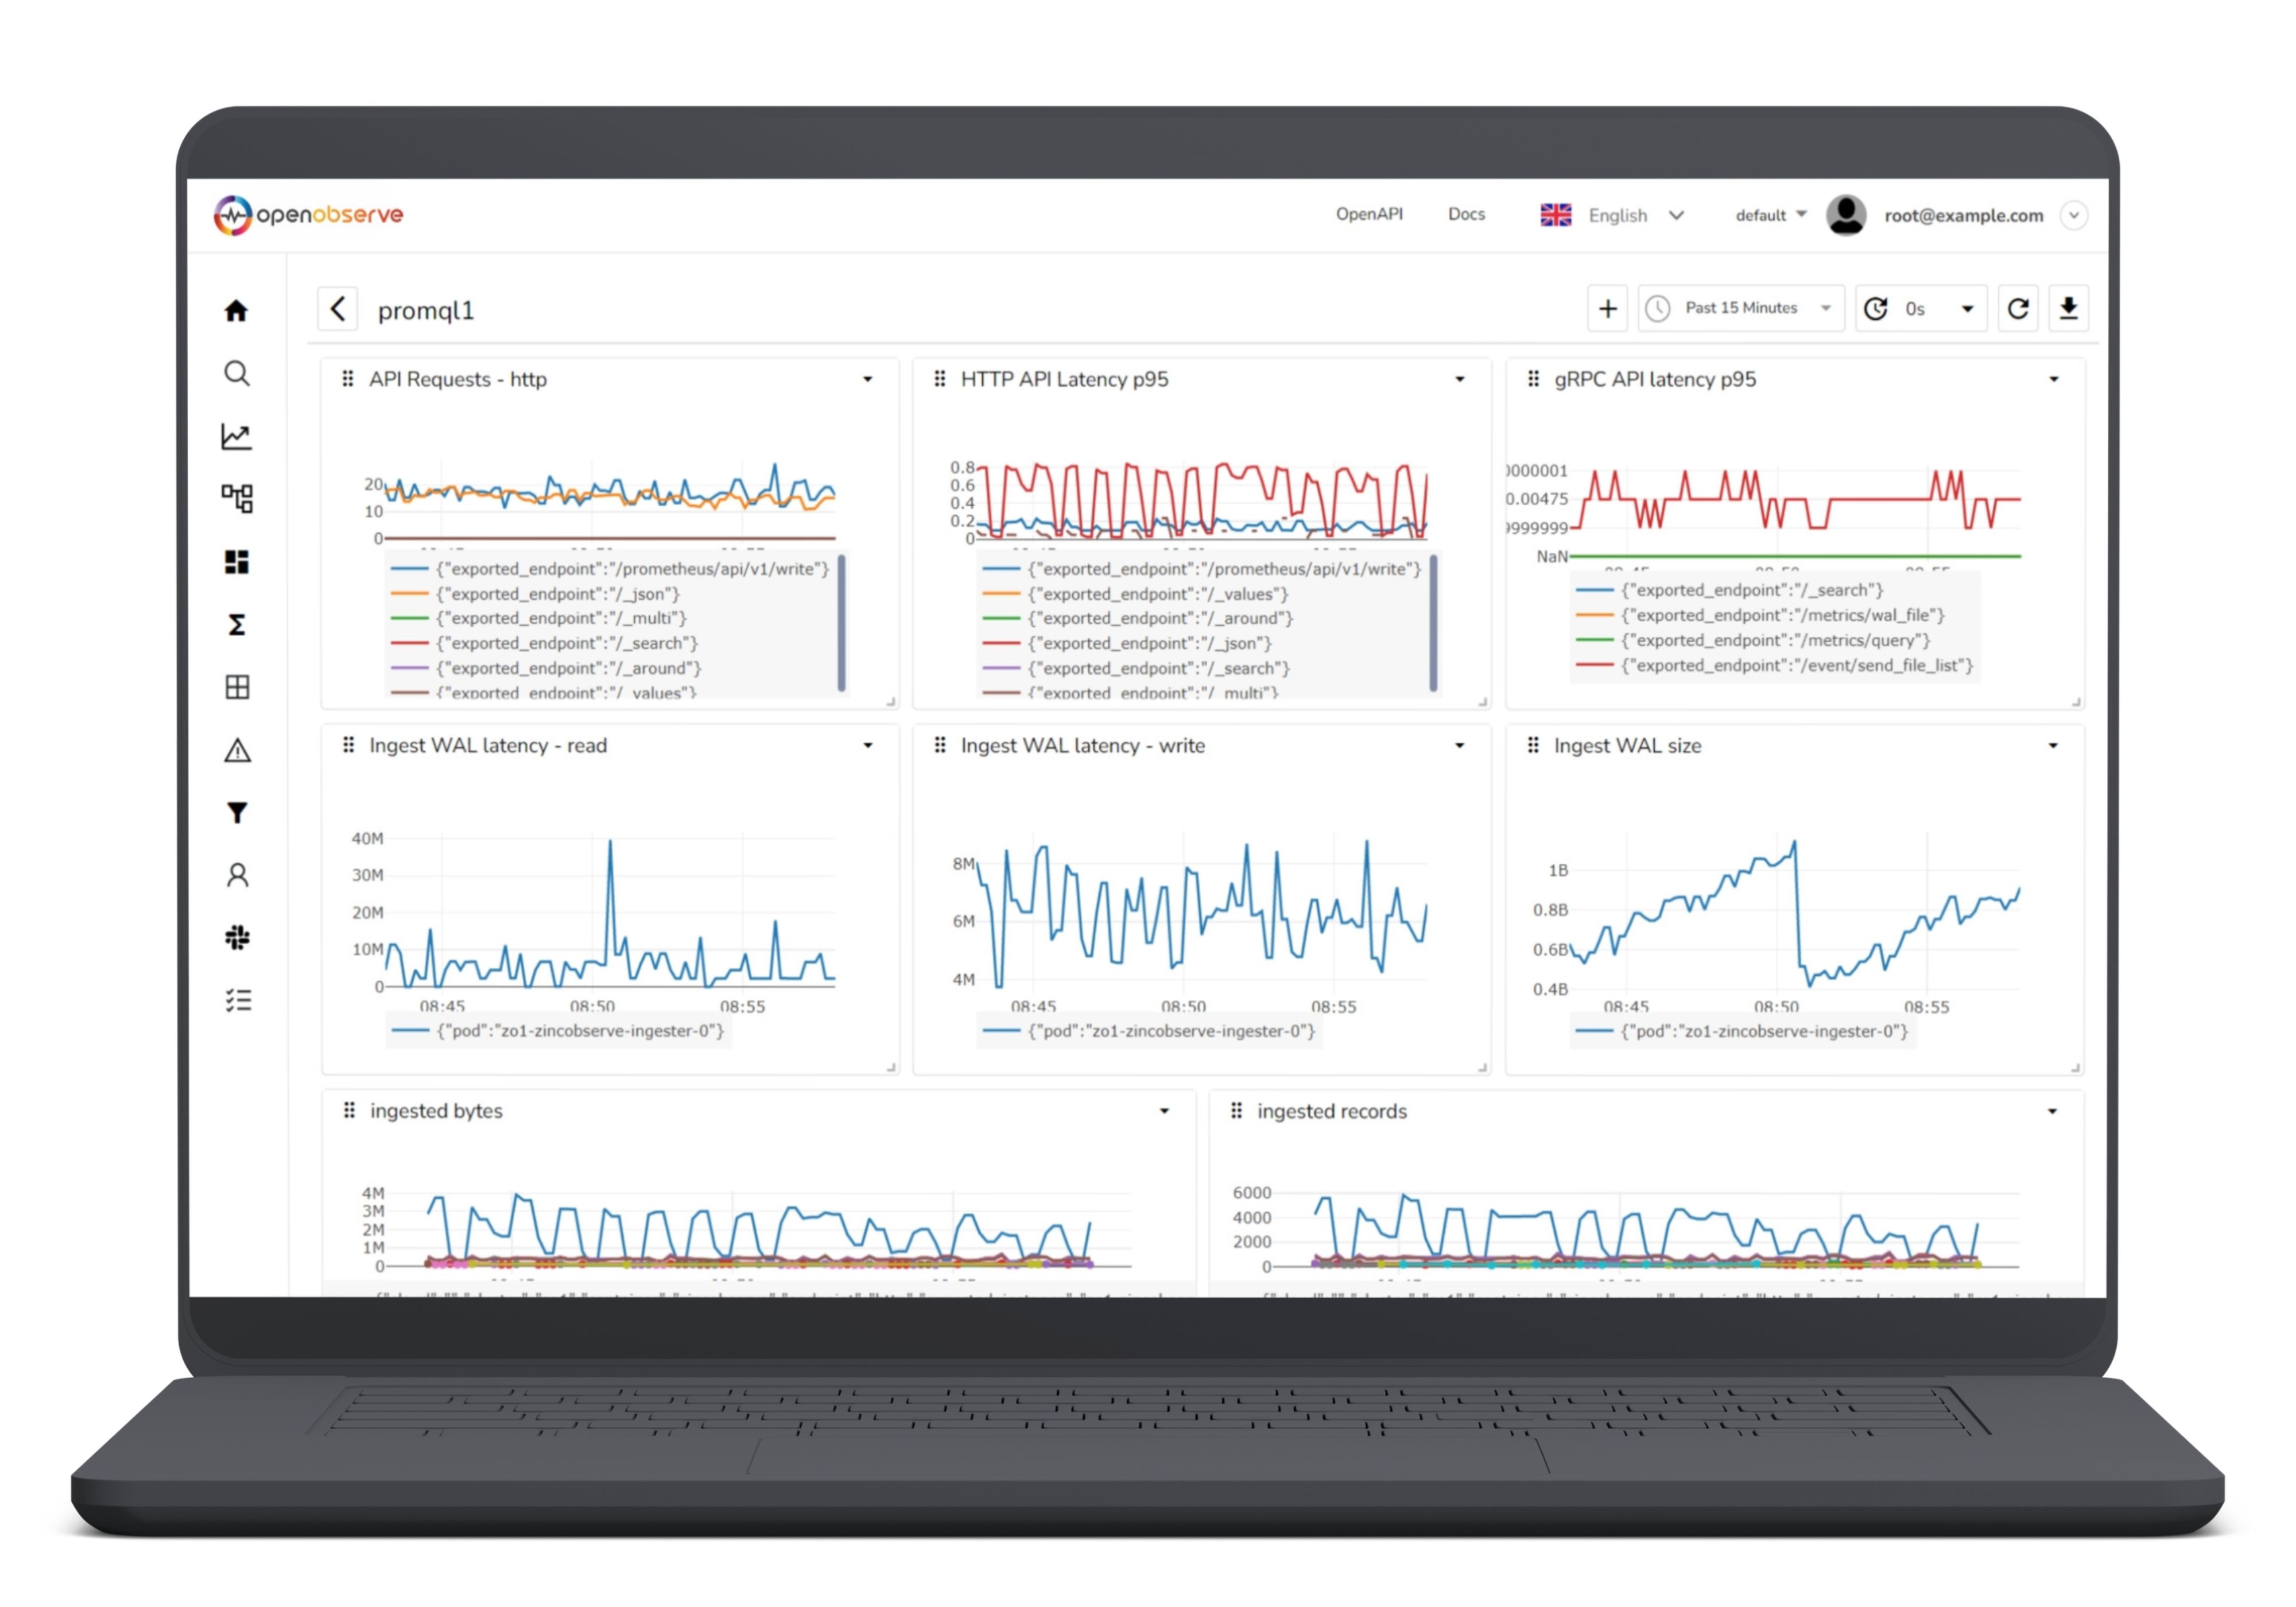
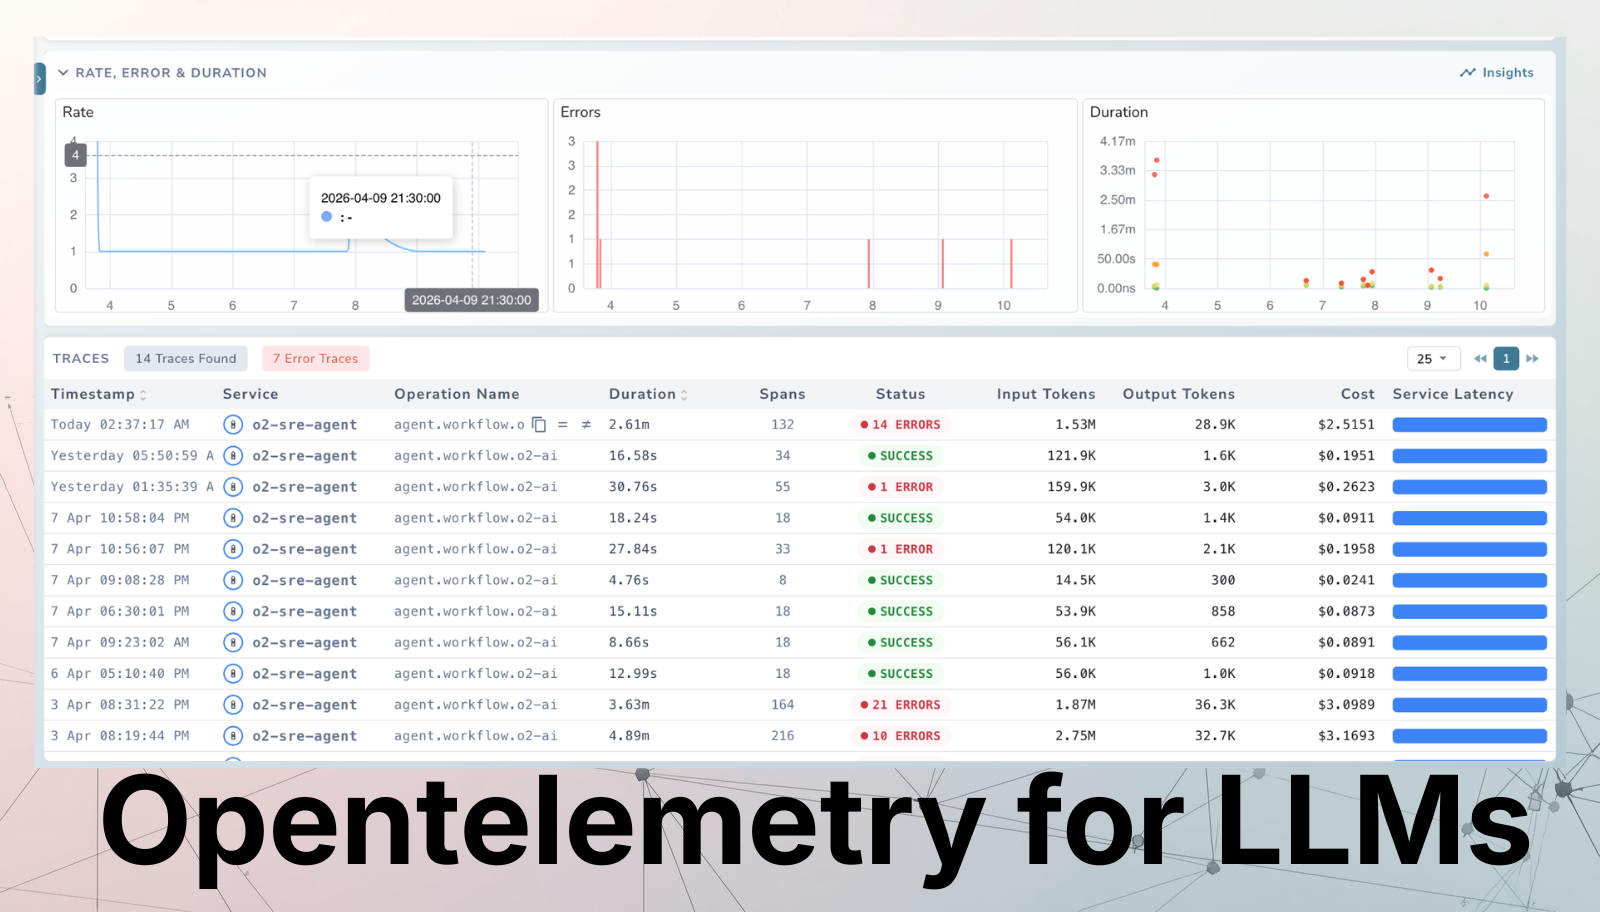
- Logs, Metrics, Traces, RUM, Session Replay, Dashboards, Alerts, Reports, Functions, Pipelines and more.
- Multi-tenancy
- Embedded scripting
- Ingest functions - think of it like an AWS lambda function that you can run on every record to modify during ingestion. It allows for reduction, redaction, and enrichment of log data as it enters OpenObserve. Users could pre-process log records as they are entering the system. Users could build whatever function they can imagine.
- Query functions - think of it like a lambda function that can run on every log line during query after log records have already been ingested. E.g. if a user has a log record like “1.2.3.4 - POST prabhat@zinc https://openobserve.ai”, you could parse it during query time and filter against it at query time. Users could build whatever function they can imagine.
- Super cluster: Large organizations can setup multiple OpenObserve clusters and chain them up as a super cluster that will allow searching across all the clusters at once.
Sleep better at night knowing your system will keep running even if the nodes crash through autohealing.
Below is the result of storage utilization when we ingested our kubernetes cluster logs in both OpenObserve and Elasticsearch for a couple of hours.
OpenObserve provides various indexing schemes - partitioning, bloom filter, inverted index - to provide the best performance for different use cases while still being highly efficient. It's design is heavily influenced by big data systems like spark and cassandra (with some of it's own twists) with the ability to scale large amount of data at scale.
Due to it's design and the use of columnar storage, OpenObserve is much faster at ingestion, search and analytics queries compared to competitors while still providing a much lower compute and storage cost.
Instead of using raft/paxos for cluster coordination, NATS is used for cluster coordination that provides much easier management and better scaling.
Conclusion
There are over four dozen observability tools out there (probably a lot more), some of which are open source, some are closed source, and others are available only as SaaS. But we still see people struggling with these existing tools for one or more reasons (feature, cost, difficulty in management, and so on).
So we have decided to build OpenObserve to allow teams to do their job efficiently, solve problems effectively, and sleep well at night. To quote one of my mentors, Anand Babu Periasamy (CEO - MinIO), on entering the crowded market of observability -
Why build another mouse trap when so many already exist? Because the rodent problem still exists (and existing mouse traps are not solving the problem).
Check the documentation to install OpenObserve in under two minutes or simply try the OpenObserve Cloud platform.