Unifying Observability and Troubleshooting: The Power of Observability Dashboards

As application architecture evolves and cloud infrastructure expands, maintaining visibility and control over your systems becomes increasingly challenging. Observability dashboards provide a unified view of your entire IT landscape, enabling you to monitor, troubleshoot, and optimize your applications and infrastructure effectively. Discover how observability dashboards empower you to overcome the complexities of modern distributed systems and deliver exceptional user experiences.
The Importance of Observability Dashboards in Cloud Environments
Traditional monitoring approaches often need to catch up in the era of cloud computing and microservices. Observability dashboards offer a robust solution, providing:
- Real-time insights into application and infrastructure health
- Centralized visibility across distributed systems
- Correlation of metrics, logs, and traces for rapid issue identification
- Proactive monitoring and alerting to prevent downtime
Imagine having a control center that gives you a bird's eye view of your entire IT ecosystem. That's precisely what observability dashboards do. They bring together data from every corner of your infrastructure, giving you a holistic understanding of how your applications perform and how your users are experiencing them.
Observability dashboards are critical for measuring and improving the performance of cloud-based applications. By providing a unified view of metrics, logs, and traces, they enable teams to quickly identify and resolve issues, ensuring the reliability and availability of services. A comprehensive observability platform simplifies monitoring and troubleshooting with intuitive dashboards and advanced analytics.
OpenObserve brings logs, metrics, and traces together for effortless system visibility. Jump in with a free cloud trial and see the difference unified monitoring makes.
Types of Observability Dashboards

Let's break down the different types of observability dashboards you can utilize:
- Built-in Dashboards and Dashboard Groups:
- Purpose: Provide out-of-the-box visibility into crucial system metrics and performance indicators
- Creation: Preconfigured by the observability platform
- Modification: Customizable to suit specific monitoring needs
These dashboards are like your trusty sidekick, ready to give you a quick overview of your system's health. They come preloaded with the essentials, but you can tweak them to match your unique monitoring requirements.
- Custom Dashboards and Dashboard Groups:
- Definition: User-created dashboards tailored to specific applications, services, or infrastructure components
- Creation process: Drag-and-drop widgets, flexible layout options, and customizable data sources
- Intended use: In-depth monitoring and analysis of critical systems.
Think of custom dashboards as your command center. You can design them from the ground up, choosing the metrics, logs, and traces that most matter to you. It's like having a bespoke suit for your monitoring needs. With OpenObserve's drag-and-drop widget functionality and its robust, user-friendly GUI, creating your personalized command center becomes an intuitive experience, even for the most complex environments.
- User Dashboards and Dashboard Groups:
- Automatic provision: Personalized dashboards for individual users based on their roles and responsibilities
- Contents: Relevant metrics, logs, and traces for the user's area of focus, tailored to their specific needs
- Access methods: Role-based access control ensures users only see the data relevant to their responsibilities, while secure sharing options allow for collaboration
User dashboards are like having a personal assistant who knows exactly what you need to see. They automatically adapt to your role, ensuring that you have all the relevant information at your fingertips. No more sifting through irrelevant data—just the insights you need to excel in your job.
Features and Capabilities of Observability Dashboards:
Observability dashboards are packed with features that make monitoring and troubleshooting a breeze. Let's dive into some of the key capabilities:
- Customization options:
- Add or remove charts and widgets
- Modify data sources and visualization settings
- Tailor dashboards to specific monitoring requirements
With observability dashboards, you're in the driver's seat. You can customize every aspect of your dashboards to match your unique monitoring needs. Want to add a new chart? No problem. Need to change the data source? Done. It's like having a dashboard that adapts to your every whim. OpenObserve's single binary implementation allows rapid customization without the complexity, ensuring your dashboards reflect the unique monitoring needs of your system.
- Integration with popular platforms and tools:
- Seamless integration with cloud platforms like AWS, Azure, and Google Cloud
- Compatibility with monitoring tools like Prometheus and Grafana, enabling you to leverage their powerful querying and visualization capabilities
- Extensibility through APIs and plugins, allowing you to integrate with your existing toolchain.
Observability dashboards play well with others. They integrate seamlessly with your existing cloud platforms and monitoring tools, making bringing together data from different sources easy. It's like having a team of experts working to give you a complete picture of your system's health.
- Flexible data collection and analysis:
- Define relevant metrics and logs for services and applications
- Perform ad-hoc queries and aggregations
- Create custom alerts based on specific thresholds and conditions
With observability dashboards, you're not limited to predefined metrics and logs. You can collect and analyze data in meaningful ways for your organization. Want to define a new metric? Go for it. Need to perform a complex query? No sweat. It's like having a data scientist at your fingertips.
- Contextual alerting and visualization:
- In-context alerts for rapid issue identification
- Visualization of telemetry data across services and infrastructure
- Correlation of metrics, logs, and traces for holistic system understanding
Observability dashboards don't just show you data - they help you make sense of it. With contextual alerts and visualizations, you can quickly identify issues and understand how different parts of your system are related. It's like having a detective that connects the dots for you.
- Granular customization and filtering:
- Per-instance or per-service customization options
- Filtering and grouping based on tags, labels, and metadata
- Drill-down capabilities for root cause analysis
Sometimes, the devil is in the details. Observability dashboards let you zoom in on specific instances, services, or components, giving you a granular view of your system's behavior. You can filter and group data based on tags, labels, and metadata, making finding the needle in the haystack easy.
Common Mistakes and How to Avoid Them
Implementing observability dashboards can be tricky, but don't worry - we've got your back. Here are some common pitfalls and how to steer clear of them:
- Lack of Clear Objectives:
- Define specific goals and KPIs for your dashboards
- Align dashboard design with business requirements and user needs
Make sure to create dashboards for the sake of creating them. Take the time to understand what you want to achieve and who will use them. It's like planning a road trip—you need to know your destination and who's coming along.
- Overloading Dashboards with Metrics:
- Focus on the most critical metrics for each dashboard
- Use progressive disclosure techniques to manage information overload
It's tempting to cram every metric under the sun into your dashboards, but resist the urge! Too much information can be overwhelming and counterproductive. Stick to the metrics that matter most and use progressive disclosure techniques to reveal additional details when needed.
- Neglecting User Experience:
- Design dashboards with usability and readability in mind
- Ensure consistent layout, color schemes, and navigation
Your dashboards are not just for you - they're for your entire team. Make sure they're easy to use and understand. Stick to a consistent layout, color scheme, and navigation to ensure a seamless user experience.
- Failure to Set Appropriate Alerts and Thresholds:
- Determine meaningful thresholds based on historical data and business impact
- Regularly review and adjust alert settings to minimize noise
Alerts are great, but too many can be a nightmare. Set meaningful thresholds based on historical data and business impact to ensure you're only alerted when it matters. And remember to review and adjust your alert settings regularly to reduce the noise.
- Not Utilizing Data Rollups for Scalability:
- Implement data aggregation and summarization techniques
- Balance granularity and performance to handle large-scale data
As your system grows, so does the data you need to monitor. To keep your dashboards snappy, implement data aggregation and summarization techniques. It's like using a map instead of a microscope - you get the big picture without getting lost in the details. Discover how OpenObserve's scalable architecture can help manage large-scale data with ease, making data aggregation straightforward and cost-effective.
Architecting Observability Dashboards: A Technical Deep Dive
Let's roll up our sleeves for a technical deep dive into architecting your observability dashboards. We'll walk through the steps of implementing observability dashboards, complete with code snippets and visual aids. Get ready to dive in!
Step 1: Set Up the Infrastructure
First things first - you need to lay the foundation. Here's how to set up the necessary infrastructure components for your observability dashboards:
- Dashboard Proxy Service
- Prometheus Export Service
- Grafana Service
You can use containerization technologies like Docker and orchestration platforms like Kubernetes to streamline the deployment process. Here's an example of a docker-compose.yml file that defines the services:
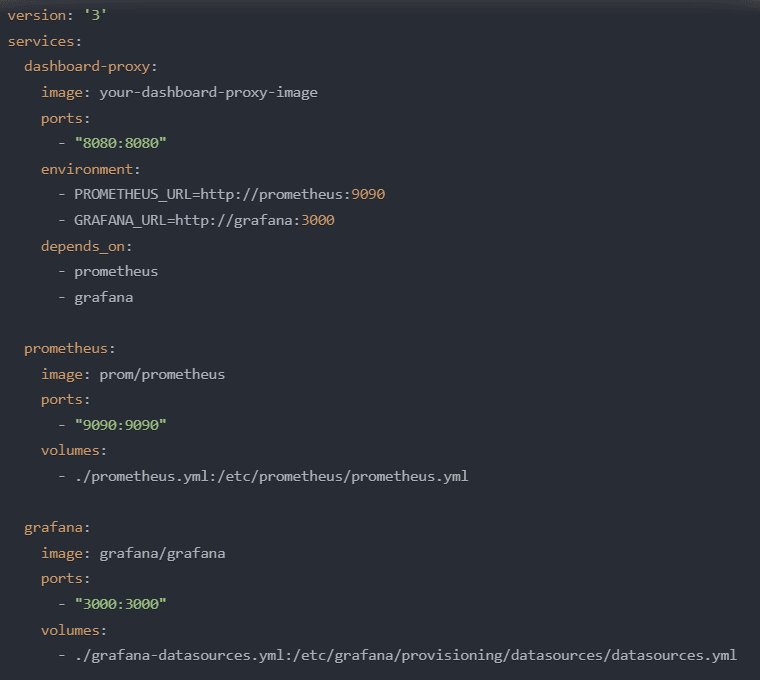
This configuration file defines the Dashboard Proxy Service, Prometheus, and Grafana as separate services. It specifies each service's necessary image, port mappings, environment variables, and volume mounts.
First things first - you need to lay the foundation. Follow the steps in the OpenObserve Quickstart Guide to set up the necessary infrastructure components for your observability dashboards.
You would need ZO_ROOT_USER_EMAIL and ZO_ROOT_USER_PASSWORD environment variables when you start OpenObserve for the first time. You don't need them on subsequent runs of OpenObserve.
Binaries can be downloaded from the releases page for the appropriate platform.
set ZO_ROOT_USER_EMAIL=root@example.com
set ZO_ROOT_USER_PASSWORD=Complexpass#123
openobserve.exe
Now point your browser to http://localhost:5080 and login.
For OpenObserve Cloud, navigate to https://cloud.openobserve.ai, use a social login or create an account using email / password.
Now head over to Ingestion section and grab CURL command.
Step 2: Load Sample Data
We will use JSON API to load sample log data.
Below commands will download a sample file of real life log data, unzip it and load it in OpenObserve using the JSON ingestion API.
Step 2: Configure Prometheus
Next, you must configure Prometheus to scrape metrics from your applications and infrastructure components. Create a prometheus.yml file that defines the scrape targets and intervals. Here's an example:
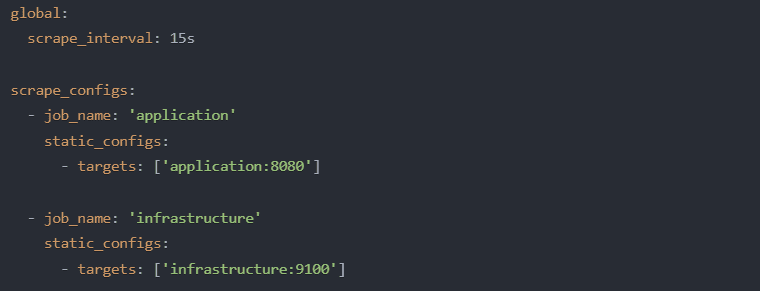
In this example, Prometheus is configured to scrape metrics from two targets: an application on port 8080 and an infrastructure component on port 9100. The scrape_interval is set to 15 seconds, determining how frequently Prometheus will collect metrics.
Step 3: Set Up Log Collection and Storage
To collect and store log data, you can use tools like Fluentd or Logstash. These tools allow you to ingest log data from various sources and store it in a centralized location, such as Elasticsearch or Couchbase.
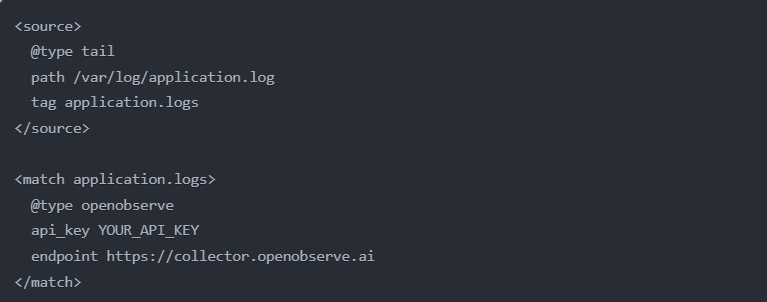
Here's an example of a Fluentd configuration file (fluent.conf) that collects logs from a file and sends them to OpenObserve:
For time-series metrics management, databases like Couchbase provide high performance and scalability. By integrating Couchbase into your observability architecture, you can efficiently store and query large volumes of metrics data.
Step 4: Load Sample Data
We will use JSON API to load sample log data.
Below commands will download a sample file of real life log data, unzip it and load it in OpenObserve using the JSON ingestion API.
Download sample data
curl -L https://zinc-public-data.s3.us-west-2.amazonaws.com/zinc-enl/sample-k8s-logs/k8slog_json.json.zip -o k8slog_json.json.zip
unzip k8slog_json.json.zip
Load sample data
Note: Replace the URL you got from OpenObserve Cloud and append it with @k8slog_json.json
For OpenObserve Cloud:
curl -u user@domain.com:abqlg4b673465w46hR2905 -k https://api.openobserve.ai/api/User_organization_435345/default/\_json -d "@k8slog_json.json"
For self hosted installation:
curl http://localhost:5080/api/default/default/\_json -i -u "root@example.com:Complexpass#123" -d "@k8slog_json.json"
Step 5: Search for Data
Point your browser to http://cloud.openobserve.ai (for OpenObserve Cloud) / http://localhost:5080 (for self hosted) and login
- Visit logs page
- Select the index default from drop down in the left
- Type
match_all('error') in search bar and click the search button on right.
Click on the "syntax guide" button next to the search bar to see examples on how to search.
Step 6: Configure OpenObserve Collector
Next, you must configure the OpenObserve Collector to scrape metrics, logs, and traces from your applications and infrastructure components. Follow the steps in the OpenObserve Collector Configuration Guide to set up the collection of logs, metrics, and traces in a Kubernetes cluster.
Prerequisites
Official documentation can be found at https://cert-manager.io/docs/installation/. Wait for 2 minutes after installing cert-manger for the webhook to be ready before installing OpenTelemetry operator.
Official documentation can be found at https://opentelemetry.io/docs/kubernetes/operator/
Installing the Chart
kubectl create ns openobserve-collector
helm --namespace openobserve-collector -f values.yaml install o2c openobserve/openobserve-collector
Step 7: Import Prebuilt Dashboards
OpenObserve provides a collection of prebuilt dashboards that cover common monitoring scenarios. You can easily import these dashboards into your OpenObserve instance. Check out the OpenObserve Dashboards Repository to explore the available dashboards and import the ones that suit your needs.
- Download the json dashboard you want to use.
- In OpenObserve, click on the "Dashboards".
- Click on the "Import" button.
- Select the json file you downloaded.
- Click on the "Import" button.
Step 8: Set Up Alerts and Notifications
You can set up alert rules and notification channels to proactively monitor your system and be notified of anomalies or critical events. Refer to the OpenObserve Alerts Documentation to learn how to define alert rules and configure notification channels.
OpenObserve supports the following kinds of alerts:
- Standard alerts: Standard alerts are evaluated at a specified frequency (every 1 minute by default) for the condition of the alert, over the duration specified as part of the alert. If the condition evaluates to true, a notification is sent to the alert destination. Additionally, users can delay notifications after a notification is generated once for a specified time duration. For example, let's create a standard alert to notify us if the error code 500 occurs more than 15 times within a duration of 2 minutes, and we want this evaluation to happen every 1 minute:
- In the OpenObserve web UI, navigate to the "Alerts" section.
- Click on "Create Alert" and select "Standard Alert."
- Set the alert name to "High Error 500 Occurrences."
- In the "Condition" field, enter:
error_code = 500
- Set the "Threshold" to 15.
- Set the "Duration" to 2 minutes.
- Set the "Frequency" to 1 minute.
- Configure the desired notification channel (e.g., email, Slack).
- Click "Create" to save the alert.
- Real-time alerts: Real-time alerts are evaluated at ingestion time based on the specified condition. They are evaluated per record. For example, let's create a real-time alert to notify us when the API response time is more than 100 ms:
- In the OpenObserve web UI, navigate to the "Alerts" section.
- Click on "Create Alert" and select "Real-time Alert."
- Set the alert name to "High API Response Time."
- In the "Condition" field, enter:
api_response_time > 100
- Configure the desired notification channel (e.g., email, Slack).
- Click "Create" to save the alert.
With these examples, you can see how to create both standard and real-time alerts in OpenObserve. Standard alerts are useful for monitoring conditions over a specific duration and frequency, while real-time alerts are ideal for detecting and notifying about critical events as they occur in real-time.
Remember to customize the alert conditions, thresholds, and notification channels based on your specific requirements and monitoring needs.
Step 9: Define Dashboard Configuration
To create an observability dashboard, you must define its structure and content using a JSON configuration file. Here's an example of a simple dashboard configuration:
The JSON metadata in the configuration file defines the dashboard's structure and behavior, specifying the widgets and charts and their arrangement. Data source definitions establish connections to Prometheus and OpenObserve, enabling the retrieval of relevant metrics and logs. The layout template, often based on frameworks like Grafana, provides the visual foundation for rendering the dashboard.
Step 10: Connect Data Sources and Visualize
With the dashboard configuration defined, you can now connect the data sources and visualize the data in your observability platform.
In Grafana, you can create a new dashboard and import the JSON configuration file. Grafana will automatically recognize the data sources specified in the configuration and retrieve the relevant data.
Step 11: Set Up Alerts and Notifications
You can set up alert rules and notification channels to proactively monitor your system and be notified of anomalies or critical events.
In Prometheus, you can define alert rules based on specific metrics and thresholds. Here's an example of an alert rule:
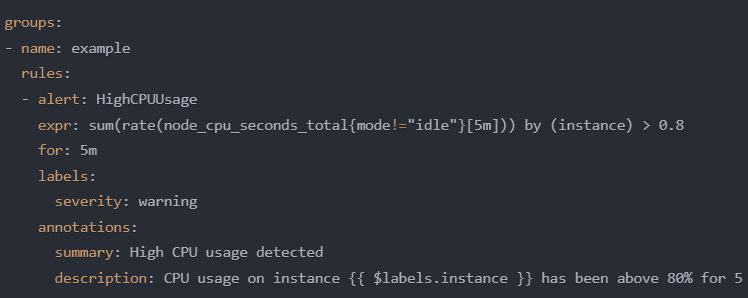
This rule triggers an alert named "HighCPUUsage" when the CPU usage on any instance exceeds 80% for 5 minutes. It sets the severity label to "warning" and includes a summary and description annotation.
You can configure Prometheus to send alerts to various notification channels, such as email, Slack, or PagerDuty, using the Alertmanager component.
Effective alert management ensures that you are promptly informed of any critical issues, allowing you to take timely action and maintain your system's health and performance.
Step 12: Perform Regular Maintenance
As your system evolves and monitoring requirements change, performing regular maintenance on your observability dashboards is crucial. This includes:
- Modifying dashboard layouts to accommodate new metrics and visualizations
- Incorporating new data sources in the collector, such as databases or message queues, to enhance visibility
- Optimizing dashboard performance by fine-tuning queries and aggregations
Regular maintenance ensures that your observability dashboards remain relevant, accurate, and efficient, providing the insights you need to manage your system effectively.
Future Developments and Enhancements
The future looks bright and full of exciting developments for observability dashboards. Let's peek into what's on the horizon:
- Ongoing work to support multiple custom dashboards from predefined templates:
While custom dashboards offer flexibility, creating them from scratch can be time-consuming. Wouldn't it be great if you could start with a predefined template and customize it to your needs?
Imagine having a library of carefully crafted dashboard templates that cover common monitoring scenarios, such as application performance, infrastructure health, and user behavior analytics. These templates will serve as a starting point, allowing you to quickly create custom dashboards by modifying and extending them to suit your specific requirements.
- Enhancing observability experience through user feedback and collaboration: Observability dashboards are not just about displaying data - they're about fostering collaboration and driving continuous improvement. User feedback and collaboration enhances the observability experience. Imagine being able to leave comments and annotations directly on your dashboards, sharing insights and suggestions with your team.
Collaborative features like real-time editing and shared cursors will allow multiple users to work on the same dashboard simultaneously, fostering teamwork and knowledge sharing.
These are just a few exciting developments and enhancements in the pipeline for observability dashboards.
Final Steps
Alright, let's wrap this up and bring it all together. Observability dashboards are a game-changer for managing complex cloud environments. A unified view of your systems enables proactive monitoring, rapid troubleshooting, and data-driven decision-making.
Looking ahead, the future of observability dashboards is bright, with exciting developments like Terraform support, predefined templates, and enhanced collaboration features on the horizon.
With **OpenObserve** by your side, you'll be well-equipped to navigate any upcoming challenges and deliver exceptional user experiences.
Stay tuned for more updates and enhancements from OpenObserve, and don't forget to join our community to join the conversation and shape the future of observability dashboards together!