Observability ToolsObservability PlatformsObservability SolutionsObservability CompaniesObservability SolutionBest Observability ToolsObservability ToolCloud Observability Tools
Top 10 Observability Tools for 2024
Don’t forget to share!

What Are Observability Tools? Peeking Under the Hood
When we talk about observability tools, we're diving deep into the diagnostic cockpit of modern software management. Think of these tools as your all-seeing eye, equipped to provide comprehensive insights into the internal states of your systems based on the external outputs.
The core purpose?
To not just catch issues as they occur but to provide you with the capabilities to predict and prevent them. These tools help you understand complex systems from the inside out, ensuring you're not just reacting to problems, but you're staying several steps ahead of them.
The Critical Role of Observability in Modern Application Maintenance
Let's start by addressing the elephant in the room. Maintaining modern applications isn't just about ensuring they run smoothly—it's about understanding how they run in the wild.
That's where observability comes into play. You see, it’s not merely about watching systems operate; it’s about gaining the insight needed to anticipate issues before they become problems.
Observability provides a comprehensive view of your systems' health and performance, enabling you to optimize operations and ensure stability across the board.
Observability vs. Monitoring: Understanding the Distinction
Now, you might wonder, "Isn't observability just a fancy term for monitoring?" Well, not quite.
While monitoring tells you if your system is functioning correctly, observability goes deeper. It tells you why things are working the way they are—or why they aren't.
Monitoring might alert you to a spike in error rates, but observability lets you dissect these errors to understand their origins and implications. It’s about peeling back the layers of your systems to expose the underlying mechanics.
What Are Observability Tools? Peeking Under the Hood
When we talk about observability tools, we're diving deep into the diagnostic cockpit of modern software management.
Think of these tools as your all-seeing eye, equipped to provide comprehensive insights into the internal states of your systems based on the external outputs.
The core purpose?
To not just catch issues as they occur but to provide you with the capabilities to predict and prevent them. These tools help you understand complex systems from the inside out, ensuring you're not just reacting to problems, but you're staying several steps ahead of them.
Observability Tools vs. Observability Platforms: Choosing Your Arsenal
While you might hear 'observability tools' and 'observability platforms' used interchangeably, there's a subtle difference worth noting.
Observability tools often refer to solutions that tackle specific aspects of observability—like logging errors or monitoring network traffic.
On the other hand, observability platforms encompass a broader scope, integrating various tools into a unified system that provides a holistic view of your network's health.
So, when you're deciding between the two, ask yourself: Do you need a sniper rifle or a full arsenal?
The Three Pillars of Observability: Building a Sturdy Foundation
To truly grasp the essence of observability, you need to understand its three foundational pillars: logs, metrics, and traces.
Together, these pillars support a robust observability strategy, providing the insights needed to ensure your applications are not only performing optimally but also resilient under pressure.
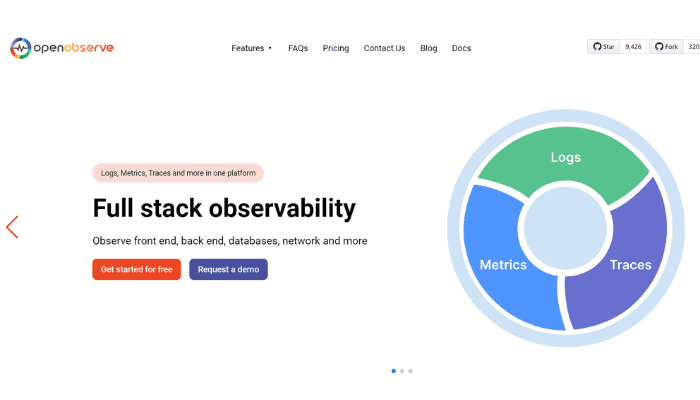
OpenObserve is making waves in the observability landscape with its user-friendly yet powerful approach to data monitoring. This cloud-native platform is engineered to handle logs, metrics, traces, and analytics at a massive scale, making it an ideal choice for businesses operating in data-intensive environments.
Features:
Sign up now or reach out to us book a demo!
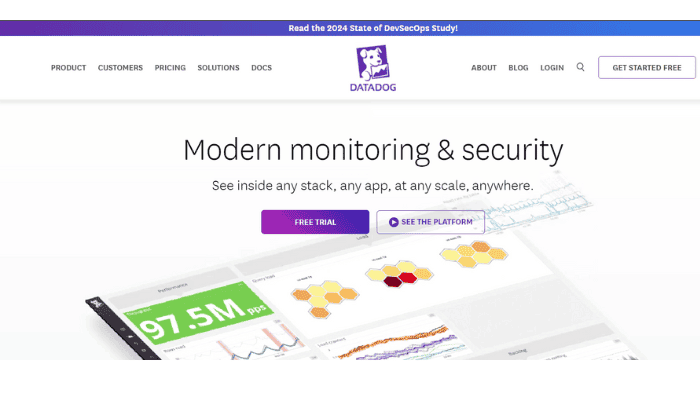
Datadog excels in providing a seamless observability experience, integrating real-time metrics and performance data across your full tech stack. From infrastructure to application monitoring, it offers a unified view to streamline operations management.
Features:
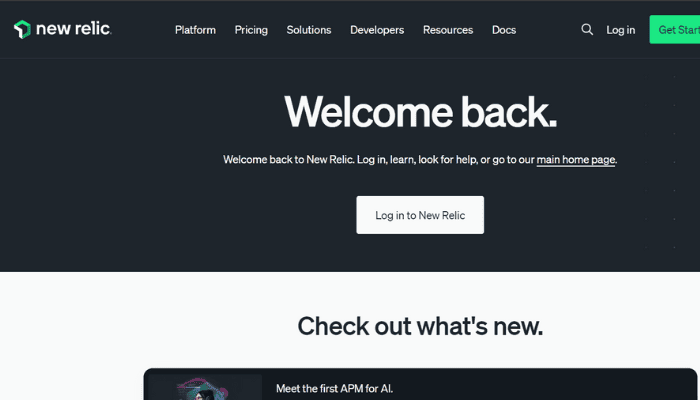
New Relic offers a powerful observability platform that allows teams to diagnose and fix issues before they affect the user experience. Its toolkit is designed to monitor everything from applications to server health.
Features:
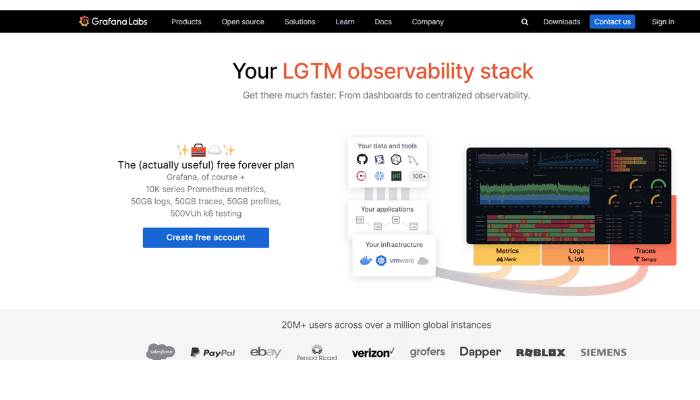
Grafana is renowned for its advanced data visualization capabilities, enabling teams to monitor their applications' performance effectively. Its flexibility in dashboard creation helps teams visualize complex data effortlessly.
Features:
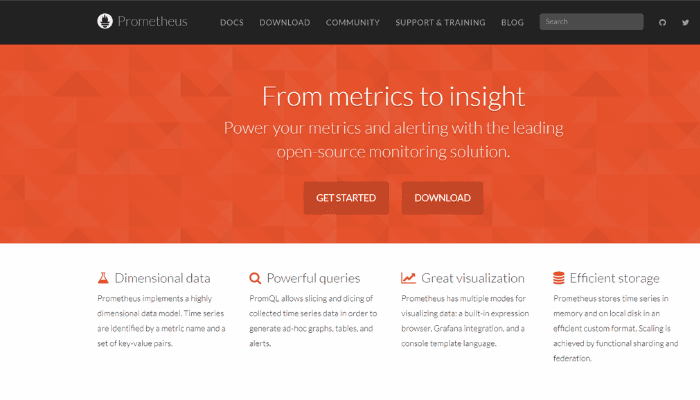
Prometheus is a vital tool for monitoring cloud-native systems, offering robust support for time-series data management. It's particularly well-suited for environments running Kubernetes.
Features:

Splunk remains a leader in turning data into answers with its comprehensive approach to security, IT troubleshooting, and operational intelligence. It's designed to make data accessible across all levels of an organization.
Features:
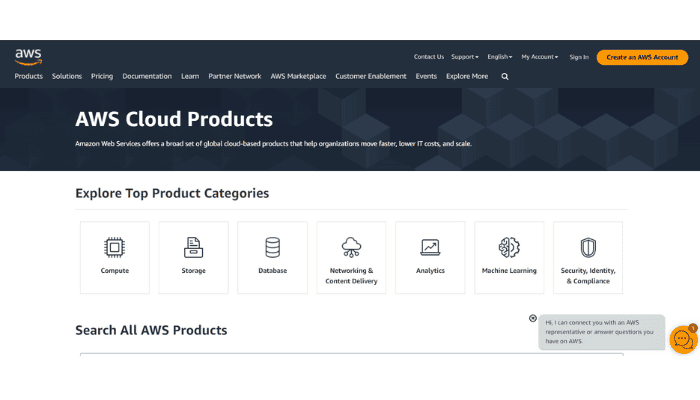
The AWS Suite offers a robust collection of monitoring tools designed to ensure comprehensive oversight of cloud operations. From performance metrics to security management, AWS provides integrated solutions to support all aspects of cloud observability.
Features:
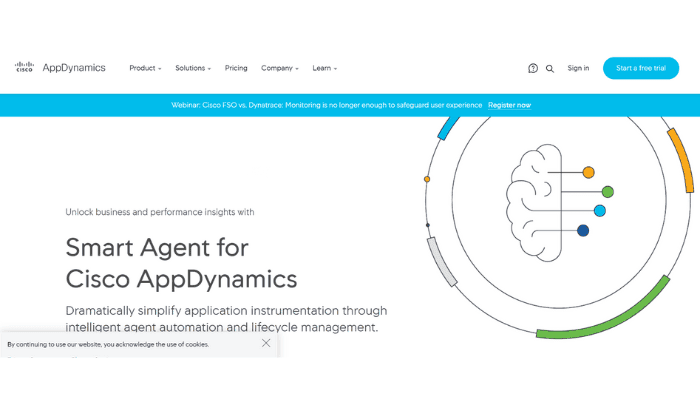
AppDynamics specializes in application performance management and monitoring, providing insights into the performance of mobile and web applications to drive better business outcomes.
Features:
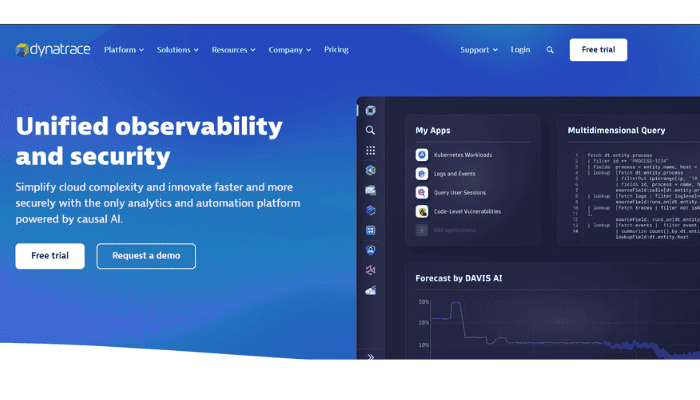
Dynatrace offers an end-to-end observability platform that uses AI to automate enterprise cloud complexity and provide actionable insights into applications and infrastructure.
Features:
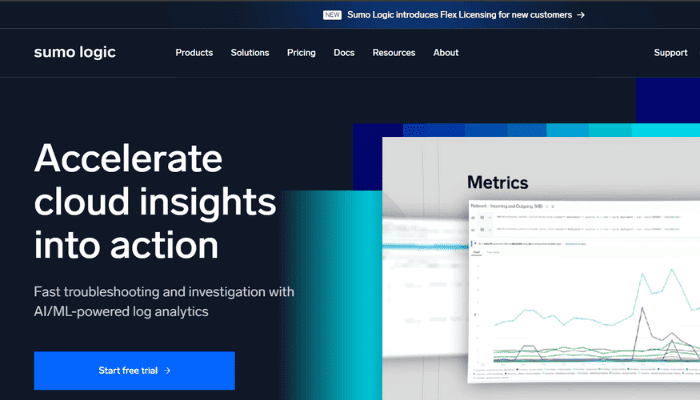
Sumo Logic delivers cloud-native, machine data analytics for logs and time-series metrics, helping enterprises harness their data for comprehensive real-time analytics.
Features:
When the time comes to choose an observability platform, the sheer number of options might seem overwhelming. But don't worry, I'm here to help you break down the essentials to consider, ensuring you select a tool that not only meets but exceeds your expectations.
Your first checkpoint should be data source compatibility. An observability tool is only as good as the data it can access.
Ensure the platform can seamlessly integrate with your current infrastructure, be it cloud-native or on-premise solutions. This compatibility ensures that you can monitor all relevant data points without cumbersome workarounds.
Next up, think about ease of use and scalability. A platform that's intuitive not only shortens the learning curve but also empowers your team to start leveraging its capabilities without extensive training.
Scalability is crucial as well—choose a tool that grows with your business. As your system expands, your observability platform should easily keep pace, providing consistent performance without lag.
Real-time monitoring is a must for timely insights. It's all about how quickly the tool can provide feedback that you can act on. Additionally, customization options play a significant role.
Can you tweak the platform to meet your specific needs?
Whether it's dashboard configurations or alert settings, a customizable platform can significantly enhance your monitoring efficiency.
For instance, platforms like OpenObserve offer customization that seamlessly integrates with your existing systems, ensuring you don't miss a beat in monitoring and managing your operations.
Alerting features are your first line of defense against potential issues.
Look for a platform that offers configurable alerts that are both accurate and timely. Effective alert management helps prevent false alarms and ensures that you focus on genuine threats and anomalies.
Performance impact is another critical factor. The ideal observability tool should have minimal impact on your system performance. It should run efficiently in the background, providing insights without slowing down your operations.
Security and compliance cannot be overlooked either. Ensure the tool adheres to industry standards and helps you meet regulatory requirements, protecting both your data and your customer's privacy.
Lastly, consider the vendor's reputation. A vendor with a strong track record of reliability and excellent customer service can be as crucial as the tool itself. Support during setup and troubleshooting can vastly improve your experience.
Why Consider OpenObserve?
As you weigh these factors, consider a tool like OpenObserve. It's designed to offer scalability, robust customization, and excellent data compatibility, all while ensuring compliance with the latest security standards.
Plus, its user-friendly interface and efficient data handling make it a top contender for any tech team looking to enhance their operational observability.
Ready to take your observability to the next level? Explore OpenObserve today and see how it can transform your monitoring strategy into one that's not just reactive, but proactive.
As technology evolves, so too will the tools and strategies at your disposal. Staying ahead in this fast-paced environment means continuously adapting and updating your tools and practices.
Platforms like OpenObserve represent the forefront of this evolution, combining robust functionality with user-friendly interfaces to deliver top-notch observability solutions.
Whether you're already implementing observability practices or just starting to consider them, the benefits of investing in a comprehensive observability platform are clear. These tools not only safeguard your systems but also enhance your team's ability to deliver excellent software products consistently.
So, as you move forward, remember that choosing the right observability platform can transform the way you manage incidents and maintain systems.