Observability Stack OverviewUnderstanding Observability StackCore Pillars Of Observability StackImportance Of Telemetry DataSystem Performance MonitoringTelemetry Data In Observability
Understanding the Observability Stack
Don’t forget to share!
What if you could predict and solve issues in your system before it even impacts the user experience, guaranteeing a flawless experience every single time. Pretty cool, huh? ‘Observability stack’ is not just a buzzword, companies all around the world are leveraging a strong observability stack for their systems. But, what is observability in the first place and what are the practices and tools you need to implement it? Intrigued? Let’s talk about observability and how it can be your solution to not just monitor but actively maintain your systems and infrastructure for an ultimate user satisfaction and unparalleled system performance.
Before we dive into the details, let's first get clear on what Observability actually means.
In simple terms, Observability gives you a window seat to everything in your system. You measure the internal state of your system by analyzing its outputs. With traditional monitoring processes, you can be notified when something is wrong, such as an outage or a performance issue, but with Observability, you get a broader approach, which includes telemetry data gathering and advanced analytics.
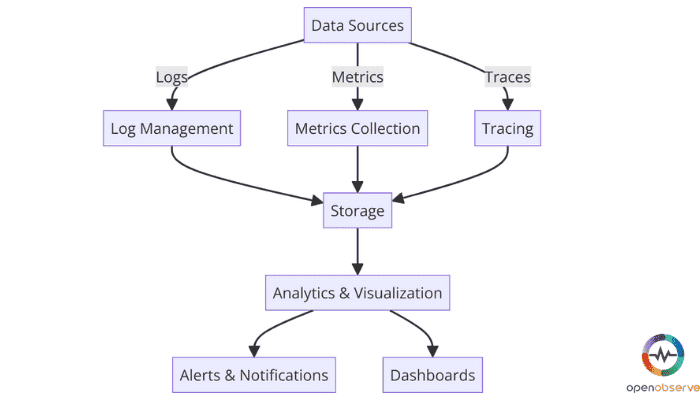
Now, Observability utilizes three types of telemetry data;

Here's a flow of how the trio works together to provide system insights regarding performance and health:
Together, these pillars are way faster in responding to and analyzing the root causes of problems.
Telemetry is crucial as it provides the raw material needed to gauge the states of your systems and applications in order to achieve effective Observability. It simply collects, aggregates, and analyzes system data so that organizations can go from a reactive approach to a proactive management approach to their IT environment. You get real-time monitoring and notifications that can help teams detect anomalies beforehand. 'A goodbye to full-blown issue escalations and hello to reliable and efficient operational systems'
Now that we understand the crucial role of telemetry, let's look at how to put theory into practice by implementing a robust observability stack.

Scalability and flexibility play an important role in ensuring that the system can handle ever-increasing data volumes and adapt to evolving technology environments without compromising its performance. The best approach is to invest in a full stack observability system that can scale horizontally and is compatible with cloud environments.
Observability is not just about the technologies implemented but also about the people operating them. It is important to ensure that every team is aligned with the right observability strategies. Regular training and workshops are a big help in such cases.
Full stack observability has a lot of scope. It has everything you need to monitor and manage every layer of your technology stack, 'right from frontend to backend infrastructure' and everything and anything in between. This holistic approach ensures you get all the visibility you need in all the aspects of your system, allowing teams to track down any issues in the stack, optimize its performance, and ultimately improve the user experience. That's just the tip of the iceberg! It helps pinpoint problems and gives you a broader picture of the impact of specific configurations and deployments across the entire system.
A full-stack observability solution consists of several key components and technologies;
Together, these components form a cohesive framework that enables extensive monitoring, quick troubleshooting, and effective optimization of IT resources.
Optimize your observability strategy with cost-effective solutions!
OpenTelemetry is a set of APIs, libraries, agents, and instrumentation that standardizes the creation and collection of telemetry data across cloud-native applications. As an open-source project, it can bring about interoperability and offer a vendor-neutral way to collect logs, metrics, and traces.
When you adopt OpenTelemetry, you can enjoy seamless integration with different tools and platforms, ensuring consistent observability practices across the systems development and production. This standardization is essential for organizations as it can reduce the complexity and cost associated with maintaining custom instrumentation and ensures effective communication throughout all parts of the observability stack.
Alright, with the standards in place, let's move on to the nuts and bolts of data collection and instrumentation. Collecting telemetry data is an important step when you want to build a comprehensive and effective observability stack. The techniques to go about it may vary, but generally, it involves gathering logs, metrics and traces from across your systems.
As mentioned, logs provide a record of events, metrics give you numerical data points over time, and traces take you through the journey of requests taken through your applications. For this comprehensive data collection, it is essential to integrate telemetry at every layer of your infrastructure and application stack. With this, teams can monitor and troubleshoot systems effectively.
Instrumentation strategies gather data insights from applications and infrastructures by embedding monitoring and tracking codes in your applications. Which might involve capturing response times, error rates, or application system calls.
It might also mean monitoring system performance indicators like memory consumption rate, network latency, or CPU usage for infrastructure. These strategies can either be built into the application or infrastructure from the outset or added later on. With effective instrumentation strategies, you are blessed with raw data that can be utilized to underpin robust Observability.
Choosing between auto and manual instrumentation depends on the specific needs and capacities of your operations and development teams. With auto instrumentation, you get a lower barrier to entry, as the tools automatically identify and monitor key metrics and events. This is especially useful in complex environments where manual instrumentation can be too hectic or error-prone.
However, when you talk about manual instrumentation, while yes, it is more labor intensive, it undoubtedly allows for customized data collection that can be finely tuned to meet the specific needs of the business. The choice is yours, depending on the trade-offs between precision and simplified deployment.
Engineers and developers can take advantage of the comprehensive visibility that Observability provides in the entire architecture. This type of visibility can make it easier for engineers and developers to troubleshoot and prevent future issues. With a robust observability stack, teams can spend more time on strategic initiatives that drive business values.

What can visualization tools do for you? They can make data comprehensible at a glance, which plays a great role in the observability stack. These tools can support various forms of data representation, such as graphs, maps, and charts, which can be very useful in identifying trends or anomalies rather quickly. This can ultimately aid in quick decision-making and efficient troubleshooting.
Let's take a deeper dive into the telemetry data; we engage in analyzing logs, metrics, and traces to unwrap more detailed insights into the system's behavior and health. Top-notch analysis tools like Elasticsearch or Prometheus can perform complex queries, aggregations, and machine learning to forecast potential issues and optimize system performance proactively. Implementing tools that can correlate and visualize data effectively ensures quicker resolution times and minimizes downtime, ultimately enhancing the overall system reliability.
One of the biggest challenges in Observability is the sheer volume and diversity of telemetry data. As IT businesses get more complex, the amount of data generated by various sources (logs, metrics, tr, and traces) increases. This explosion of data can lead to issues like storage costs, longer processing times, and data noise, this means that you lose more crucial insights than gain it.
In order to get this right, many organizations are adopting strategies like data sampling, utilizing advanced data tools that can smartly filter and aggregate data upfront, and prioritizing data streams.
Another obstacle to tackle is the fragmentation of responsibilities and data across DevOps, IT operations, and security departments. Each team operates in a silo with its own set of tools and data, which can lead to a lack of visibility and collaboration across organizations. Such a setback can delay incident response times and hinder the overall effectiveness of observability practices.
The only way to overcome this pitfall is for companies to start moving towards a culture full of collaboration and shared access to observability tools and dashboards.
As the point of Observability involves collecting and analyzing data, ensuring privacy and adherence to compliance standards can be a nightmare. Still, it is, in fact, the essential part of the observability stack. Companies need to implement robust data governance practices, such as data anonymization, compliance audits, secure data storage, and transport mechanisms to mitigate the risk of sensitive data getting exposed to unauthorized parties during observability processes.
Adding more to this is establishing clear data usage policies and access rights that can help maintain international standardized compliance regulations such as GDPR and HIPAA.
Observability pipelines manage telemetry data effectively by filtering, enriching, and routing it in real-time, often to cost-effective data storage options. They also help reformat data, converting legacy structured data into standard-based formats without changing the codes.
LLMs help simplify user interactions in observability platforms by translating natural language prompts into platform-specific commands and syntax. This model enhances configuration instrumentation and understands the complexity of system alerts, potentially turning this into autonomous decisions in incident response.
Advanced monitoring tools ensure the reliability of AI/ML applications by monitoring their metrics like model performance, data quality, and drift. With LLM observability in place, capturing signals to build, fine-tune, and operate LLMs can improve transparency and decision-making.
By offering vendor-neutral telemetry data collection, OpenTelemetry drives standardization in Observability. Efforts are made to ensure standardization of query languages and improve data compression.
The next-gen observability tools are set to enable customers to use their preferred storage solutions, improving overall control of data residency and access.
Efficiency in engineering platforms provides excellent insights into CI/CD performance, which can help pinpoint and fix any bottlenecks. CI analytic tools detect flaky tests and offer live debugging capabilities, enhanced developer visibility, and productivity.
Convergence of product experience and system monitoring enables a better understanding of the correlation between end-user behaviors and system-level signals, facilitating decision-making and problem-solving.
Here's why OpenObserve stands out as your gateway to advanced Observability:
Sign up now and start your brilliant journey with OpenObserve!
As we approach this topic's end, 'Understanding the observability stack.'
Here are some key takeaways:
And that's a wrap


