Learn how to implement distributed tracing in a Java Spring Boot microservices application using the OpenTelemetry Java Agent and OpenObserve. Covers zero-code auto-instrumentation, JVM metrics, cross-service trace propagation, flamegraphs, and Gantt charts , with working source code and curl examples.
Learn the difference between head-based and tail-based sampling in observability. Compare pros, cons, and use cases to choose the right strategy for tracing.
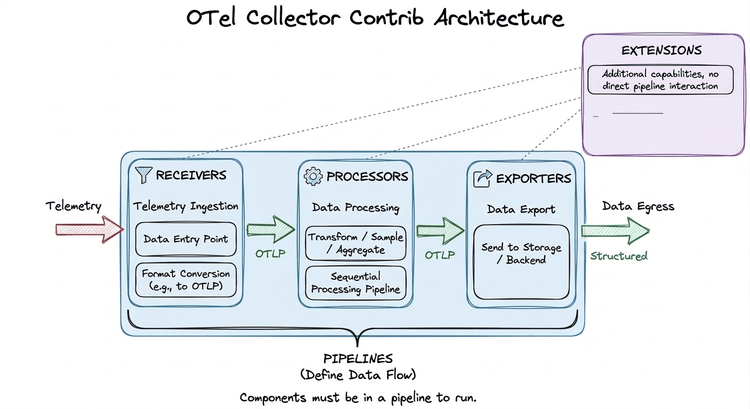
Learn how to use the OpenTelemetry Collector Contrib distribution to collect, process, and export telemetry data. This guide covers architecture, key components, configuration examples, and practical deployment tips.
DataDog vs OpenObserve APM comparison: $120/day LLM charge, SQL trace dashboards, OTel native, service dependency mapping, and 60-90% cost savings with real data.
DataDog vs OpenObserve metrics comparison: PromQL support, high-cardinality handling, custom metrics auto-generation, and 60-90% cost savings with real data.
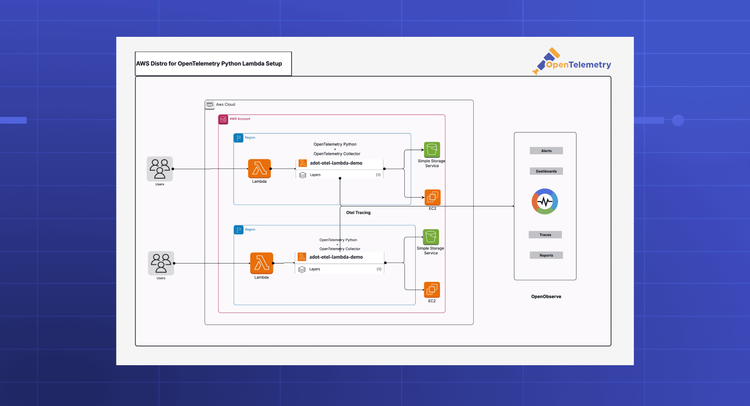
Learn how to implement distributed tracing for AWS Lambda using the AWS Distro for OpenTelemetry (ADOT) layer. This step-by-step guide shows you how to automatically capture traces from AWS SDK calls and send them to OpenObserve without writing any instrumentation code. Get full visibility into your serverless applications with open standards.
Discover how full-stack observability helps teams correlate telemetry across systems to cut MTTR, reduce data costs, and improve performance.
Learn how to add complete observability to your microservices for distributed tracing without changing a single line of code. This hands-on demo shows auto-instrumentation across Go, Node.js, Java, Python, and .NET using OpenTelemetry and OpenObserve.
Discover how to effectively handle multi-line log events, such as application stack traces, using OpenObserve Collector. This comprehensive guide covers configuring the filelog receiver, deploying changes with Helm, and verifying proper ingestion in OpenObserve. Improve log readability and troubleshooting with practical examples and solutions.
Deploy the OpenTelemetry Astronomy Shop demo and stream traces, metrics, and logs to OpenObserve with Helm. Easily configure OTLP and visualize everything in dashboards.
This guide explains OpenTelemery OTLP Exporters, provides an overview and setup with simple step-by-step instructions.
Learn how to implement effective SNMP monitoring using OpenTelemetry and OpenObserve. Monitor network devices, servers, and infrastructure with real-time insights and improved troubleshooting.
Learn how to monitor Docker container metrics using OpenTelemetry and OpenObserve. Collect CPU, memory, network, and disk metrics without modifying your applications.
Learn how to set up real-time GitHub metrics monitoring using OpenTelemetry Collector and OpenObserve. This step-by-step guide covers installation, configuration, and visualization of repository analytics, PR metrics, and contributor statistics. Perfect for DevOps teams looking to gain deeper insights into their development workflows and improve productivity with data-driven decisions.
Boost your NATS infrastructure reliability with comprehensive observability. This guide covers log collection, metric analysis, visualization tools, and best practices for effective monitoring.
Learn how to monitor Apache Kafka metrics effectively using OpenTelemetry Collector Contrib and OpenObserve. This detailed guide covers Kafka installation, setting up OpenTelemetry for real-time Kafka monitoring, configuring dashboards, and tracking key Kafka metrics like brokers, consumer groups, partition offsets, replicas, and message rates. Discover the benefits of monitoring Kafka with OpenObserve, including automated alerts, performance insights, and data integrity checks. Optimize your Kafka infrastructure with proactive monitoring and real-time observability—boost system reliability, detect issues early, and scale efficiently.
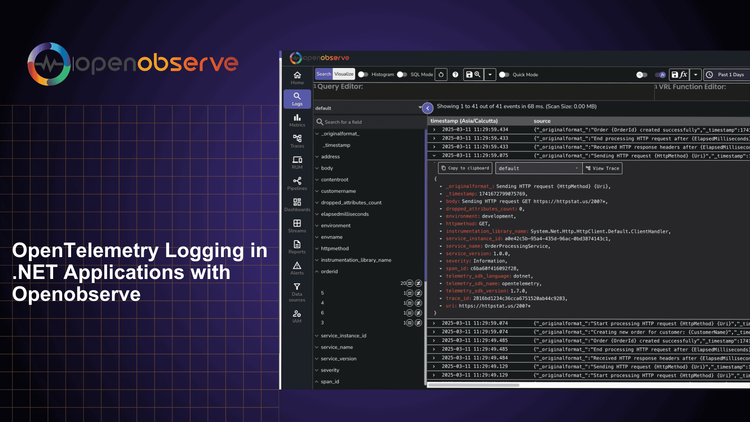
Learn how to implement OpenTelemetry logging in .NET applications using OpenObserve. Step-by-step guide to configure, collect, and analyze logs.
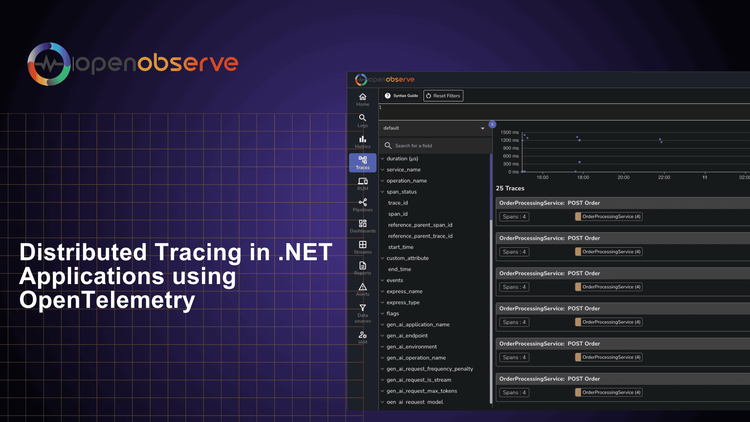
Learn how to implement distributed tracing in your .NET applications using OpenTelemetry. This guide covers the benefits of distributed tracing, how to get started with OpenTelemetry, and best practices for implementation.
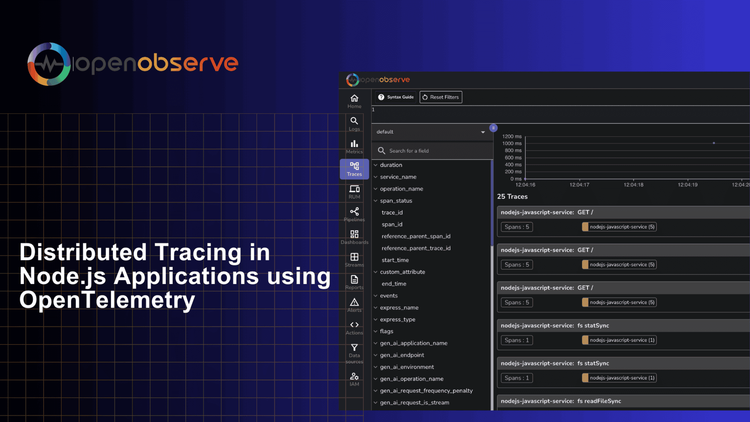
Learn how to implement distributed tracing in your Node.js applications using OpenTelemetry. Complete guide covering auto & manual instrumentation, trace visualization, and monitoring with OpenObserve.
Learn how to effectively monitor RabbitMQ performance metrics using OpenTelemetry Collector. Master message queue monitoring, track broker health, and optimize your messaging infrastructure with our comprehensive guide.
Learn how to monitor Apache Airflow logs, metrics, and traces using OpenTelemetry and OpenObserve. Set up Airflow logging, configure OpenTelemetry, and visualize insights with pre-built dashboards.