Looking for a monitoring tool that can keep up with your growing systems?
Prometheus and Grafana – both are great options.
But which one should you choose? And what’s the exact difference between them?
In this post, we’ll do a detailed side-by-side comparison of Prometheus vs. Grafana so that you easily pick the one that best fits your needs.
Ready to learn? Grab your cup of coffee and let’s go!
Prometheus vs. Grafana – Quick Overview
Prometheus and Grafana are two popular tools used for monitoring and understanding the performance of computer systems and applications.
Prometheus – Then And Now
Prometheus was created in 2012 by engineers at SoundCloud, a music streaming company. They needed a better way to monitor their complex systems, which consisted of many different services running on hundreds of servers.
Prometheus was designed to efficiently collect and store large amounts of data, making it possible to quickly identify and diagnose problems.
Grafana – Then And Now
Grafana, on the other hand, started as a simple dashboard for visualizing data from various sources.
It was first released in 2013 and has since evolved into a feature-rich platform for creating interactive dashboards and exploring data.
Grafana supports many different data sources, including Prometheus, and provides a wide range of visualization options, such as graphs, charts, and heatmaps.
Now, let’s compare both tools on important metrics and see how they stack up against each other.
Key Features And Functionalities
| Feature | Prometheus | Grafana |
| Primary Purpose | Monitoring system and time-series database | Data visualization and analytics platform |
| Data Collection | Pull-based model with exporters and client libraries | Supports various data sources, including Prometheus |
| Alerting | Built-in alerting system with flexible rules | Provides alerting capabilities through plugins |
| Visualization | Basic graphing and dashboard capabilities | Rich, interactive dashboards with many visualization options |
| Storage | Local time-series database with a custom format | Relies on external data sources for storage |
| PromQL | Powerful query language for data aggregation and analysis | Supports PromQL for Prometheus data sources |
Prometheus
- Efficient pull-based data collection, ensuring up-to-date metrics.
- Highly scalable and reliable, suitable for large-scale environments.
- Flexible alerting system with customizable rules and notifications.
- Powerful PromQL for querying and analyzing time-series data.
- Extensive ecosystem of exporters and client libraries for various systems.
- Lightweight and easy to set up, with a focus on simplicity.
Grafana
- Versatile data visualization platform supporting multiple data sources.
- Beautiful, interactive dashboards with a wide range of visualization options.
- User-friendly interface for creating and managing dashboards.
- Allows collaboration and sharing of dashboards among team members.
- Provides alerting capabilities through various notification channels.
- Extensive plugin system for extending functionality and integrating with other tools.
The Difference
Prometheus and Grafana are both powerful tools in the world of monitoring and data visualization, each with its own unique strengths in different areas.
Prometheus is known for its efficient pull-based model, making it a go-to choice for collecting and storing time-series data. Its powerful querying language, PromQL, allows for precise monitoring and alerting, making it a favorite for overseeing large-scale systems.
Grafana, on the other hand, shines in the realm of data visualization. It supports a variety of data sources, including Prometheus, and its rich, interactive dashboards enable users to create stunning visualizations and uncover insights from their data.
It's important to note that these tools serve different purposes and are often used together to provide a comprehensive monitoring and visualization solution. Therefore, it's not about which tool is better, but rather how each can be used to its fullest potential in different scenarios.
Data Collection And Storage
Prometheus
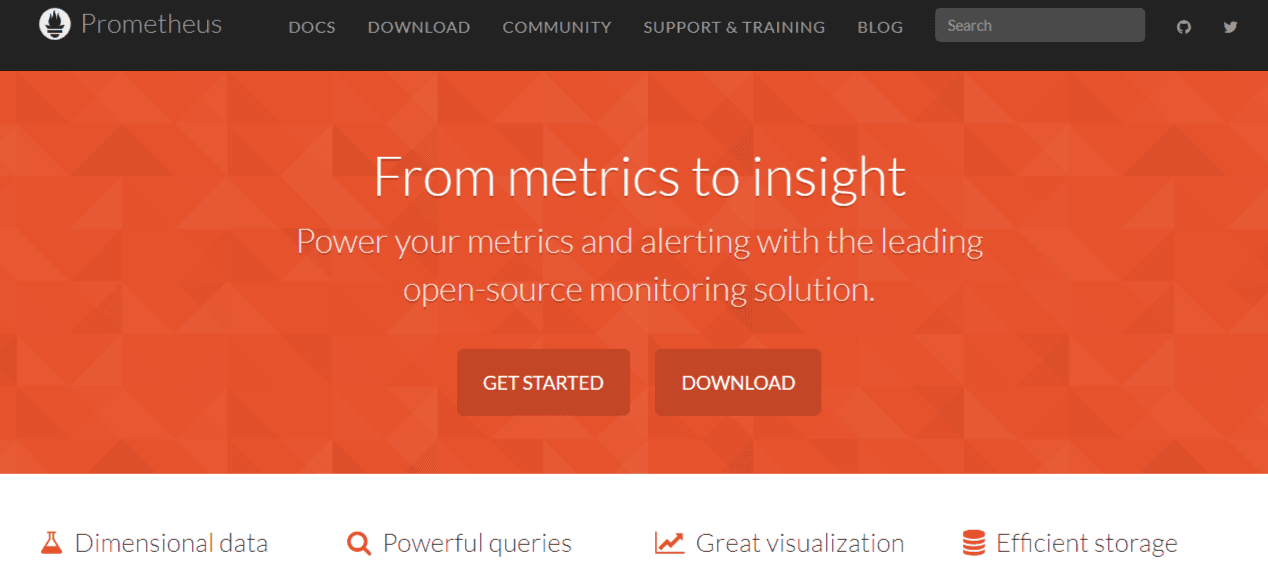
- Scrapes metrics from targets every 30-60 seconds by default, ensuring data is always fresh.
- Stores data locally using a custom time-series database optimized for read performance.
- Comfortably handles millions of active time series, surpassing other monitoring solutions.
- No external storage required, simplifying the overall monitoring architecture.
Grafana
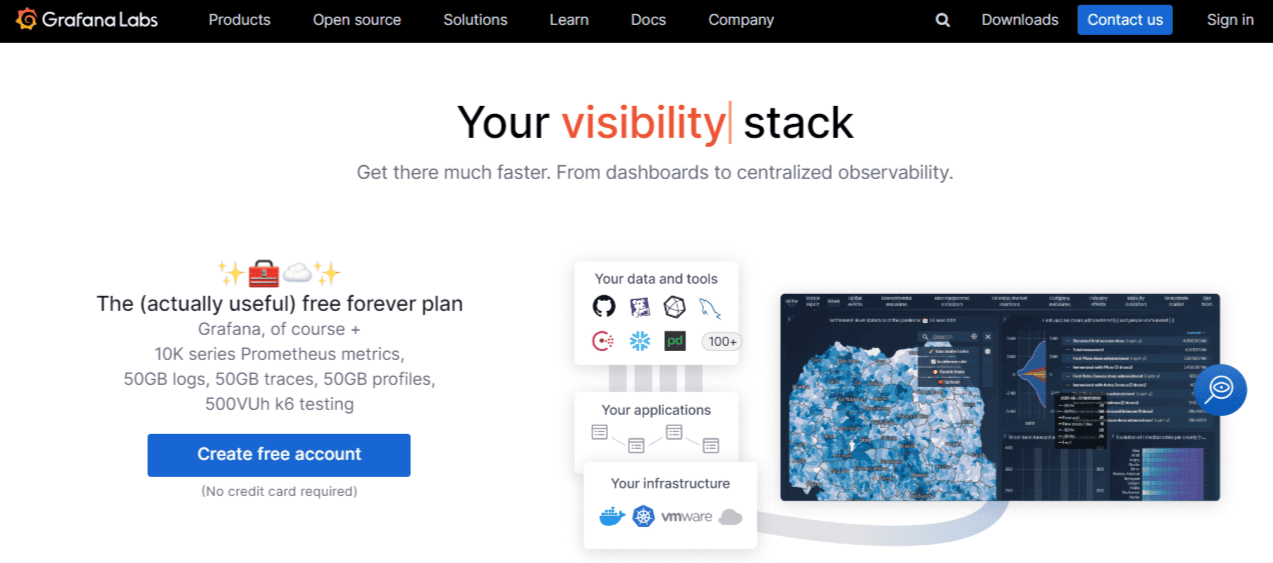
- Supports over 50 data sources, enabling connection to a wide variety of databases.
- Offloads storage and querying to external databases, leveraging their specific strengths.
- Allows using specialized databases like TimescaleDB for high-volume time-series data.
- Seamlessly integrates with Prometheus, making it an ideal companion for visualization.
The Difference
When considering the differences between Prometheus and Grafana, it's essential to recognize their unique features and strengths, especially in terms of data collection and storage.
Prometheus stands out with its pull-based model and local storage, specifically designed for monitoring and alerting. Its custom time-series database excels in efficient storage and querying, enabling it to handle millions of active time series effortlessly.
On the other hand, Grafana's strength lies in its versatility, particularly in connecting to multiple data sources. This allows users to aggregate data from various databases to create comprehensive visualizations. Grafana's flexibility enables the selection of the most suitable database for specific needs, such as opting for InfluxDB for high-cardinality data or Elasticsearch for log analytics.
It's important to note that these tools serve different purposes and are often used together for a complete monitoring and visualization solution. As such, it's not about which tool is better, but rather how each can be leveraged for their distinct advantages in different scenarios.
Visualization And UI/UX
Prometheus
- Offers a simple, no-frills graphing interface for quick data visualization.
- Provides a functional yet minimalistic experience, focusing on core monitoring features.
- Allows creating basic graphs and charts to visualize time-series data.
- Suitable for users who prioritize simplicity and lightweight solutions.
Grafana
- Supports different types of visualizations, from heatmaps to histograms and beyond.
- Enables users to create stunning, information-rich dashboards that tell a story.
- Offers a highly customizable and user-friendly interface, making data exploration easy.
- Dashboard is highly customizable depending on different needs and preferences.
The Difference
When it comes to visualization and UI/UX, Prometheus and Grafana each bring unique features to the table.
Prometheus offers built-in visualization capabilities that are straightforward and effective for basic monitoring needs. It provides a functional interface for querying data and creating simple graphs, making it a reliable choice for quick insights into your metrics.
Grafana, however, elevates the visualization experience with its extensive range of over 15+ visualization options. It allows for the creation of highly customizable and intuitive dashboards, catering to diverse data visualization requirements. Whether you're looking to compare multiple metrics on a single graph or visualize geographic data on a world map, Grafana offers the flexibility and tools to meet those needs.
It's important to recognize that both tools serve different aspects of monitoring and visualization. While Prometheus excels in data collection and alerting, Grafana stands out in its ability to create rich, interactive dashboards. The choice between the two depends on the specific requirements of your use case, and often, they are used together to leverage the strengths of each tool.
Querying And Alerting
Prometheus
- It uses PromQL for complex queries and alerts which is a powerful query language designed specifically for time-series data.
- Allows writing complex queries to analyze metrics in a variety of ways.
- Supports advanced functions like quantile and histogram analysis for deeper insights.
- Built-in alerting system enables creating precise alerts based on PromQL queries.
Grafana
- Supports querying data from multiple sources using their native query languages.
- Offers a unified alerting system that works across all supported data sources.
- Allows setting up alerts based on thresholds, anomalies, or custom criteria.
- Provides a centralized view of all your alerts, making it easy to manage and monitor.
The Difference
If you're dealing with a ton of time-series data and need to ask complex questions, Prometheus and PromQL will be very handy.
Specifically, PromptQL can do everything from basic filtering to advanced statistical analysis. Want to calculate the 95th percentile latency for your API calls? PromQL makes it a piece of cake.
Grafana, on the other hand, is more like an all-in-one suite. It supports multiple query languages, so you can use the one that best fits your data source. And its alerting system keeps a close eye on all your metrics and reports the changes accordingly.
So, if you're mainly working with Prometheus and need to do some serious querying, stick with PromQL. But if you're dealing with multiple data sources and want a unified alerting system, Grafana has got your back.
Ease Of Use And Deployment
Prometheus
- Offers multiple deployment options to suit different environments and needs.
- Can be deployed as a single binary, making it easy to set up and run.
- Provides official Docker images for containerized deployments.
- Supports Kubernetes deployments using the Prometheus Operator for enhanced scalability.
Grafana
- Provides various deployment options, including standalone binaries and Docker images.
- Offers an official Docker image that simplifies the deployment process.
- Supports Kubernetes deployments using the Grafana Operator for improved scalability.
- Offers Grafana Cloud, a fully-managed SaaS offering that eliminates the need for self-hosting.
The Difference
When it comes to ease of use and deployment, both Prometheus and Grafana offer flexible options to suit your needs. You can run them as standalone binaries, containerize them with Docker, or even deploy them in Kubernetes environments using their respective Operators. This versatility ensures that you can integrate them seamlessly into your existing infrastructure.
Grafana, however, adds an extra layer of convenience with Grafana Cloud. This fully-managed SaaS solution handles the nitty-gritty details of server provisioning, upgrades, and maintenance, allowing you to focus on extracting insights from your data.
Grafana Cloud is designed to get your dashboards up and running quickly, with features like built-in high availability and automatic scaling to ensure they're always ready when you need them.
While both tools are user-friendly and offer robust deployment options, Grafana Cloud provides an added level of ease for those looking to offload infrastructure management.
It's important to remember, though, that Prometheus and Grafana serve different purposes in the monitoring and visualization landscape. Each tool has its unique strengths, and choosing between them depends on your specific needs and use cases.
There's no one-size-fits-all answer here; it's all about finding the right tool for the job.
Integration And Synergy When Used Together
Now here’s the thing:
Although Prometheus and Grafana are powerful tools on their own, they form an unbeatable duo when used together.
Why? Because when you use Prometheus and Grafana together, you can get the most out of your data.
Grafana has many different ways to visualize your data, such as heatmaps, histograms, and maps. These help you create dashboards that not only look good but also provide valuable insights into your Prometheus data. You can use Grafana's query editor to explore your data, perform calculations, and even predict future trends.
The real power comes when you combine Prometheus' alerts with Grafana's interactive dashboards.
You can set up specific alerts in Prometheus and then see them on a dedicated Grafana dashboard in real-time. This allows you to quickly identify which alerts are triggering, how long they've been active, and add notes to provide context for your team.
Many companies, from small startups to large enterprises, rely on the combination of Prometheus and Grafana for their monitoring needs.
If you want to improve your monitoring setup, using Prometheus and Grafana together is a great choice. It provides a powerful and effective way to keep track of your systems and applications.
With that said, each tool has its own set of drawbacks and challenges. Let’s have a look:
Limitations and Challenges With Prometheus and Grafana
Prometheus:
When it comes to Prometheus, one of the biggest challenges is its configuration complexity.
Setting up Prometheus can be a bit challenging.
You need to define your scrape configs, set up your alerting rules, and configure your storage backend. It's not exactly a walk in the park, especially if you're new to the tool.
Another issue with Prometheus is long-term data storage. By default, Prometheus stores data locally on disk, which can be great for short-term analysis but not so much for long-term trending.
As your metrics grow over time, you might find yourself running out of disk space faster than you can say "time-series data." A work around this is using remote storage backends like Thanos or Cortex. But that adds another layer of complexity to your setup.
Grafana:
Grafana, on the other hand, has its own set of limitations. One of the biggest is its dependency on external data sources.
This means you need to have your data stored somewhere else, like Prometheus or Elasticsearch, and then connect Grafana to it. It's not a huge deal, but it does add an extra step to your setup along with the need for an additional system.
Another challenge with Grafana is its limited data processing capabilities. While Grafana is great for visualizing data, it's not so great at transforming or changing it.
If you need to do complex data processing, you'll likely need to do it in your data source before bringing it into Grafana. This can be a bit of a hassle, especially if you're dealing with large amounts of data.
But what if you could have the best of both worlds? What if there was a tool that combined the power of Prometheus with the ease of use of Grafana?
Well, that's where OpenObserve comes in.
It's like having the power of Prometheus' monitoring and alerting with the simplicity and flexibility of Grafana's dashboarding, all wrapped up in a single open-source package. And the best part? OpenObserve is designed to handle the limitations of both tools.
Learn more about OpenObserve here.
Conclusion
So, Prometheus vs. Grafana – what’s the difference?
In summary, it's important to recognize that Prometheus and Grafana are distinct tools, each with its unique strengths and purposes.
Prometheus is a powerhouse for data collection, storage, and monitoring, with strong community support. Grafana, on the other hand, excels in data visualization, offering a user-friendly interface and seamless integration with a variety of data sources.
Choosing between these tools isn't about determining which is better; it's about understanding your specific needs and goals.
Ultimately, the decision comes down to being clear about your requirements and selecting the tool that aligns best with your business objectives. Both Prometheus and Grafana have their place in the monitoring and visualization landscape, and understanding their differences will help you make an informed choice.
FAQs:
Do Grafana and Prometheus serve the same purpose?
No, Grafana and Prometheus serve different purposes but work well together. Prometheus is a monitoring system that collects and stores data, while Grafana is a visualization tool that helps you create dashboards and graphs using data from various sources, including Prometheus.
Can Grafana work without Prometheus?
Yes, Grafana can work without Prometheus. Grafana supports many different data sources, such as Elasticsearch, InfluxDB, and MySQL. However, using Prometheus and Grafana together is a popular choice because of how well they complement each other.
What are the advantages of using both tools together?
Using Prometheus and Grafana together offers several benefits:
- Comprehensive monitoring – Prometheus collects and stores data, while Grafana provides a user-friendly way to visualize and analyze that data.
- Flexibility – Grafana's wide range of visualization options and support for multiple data sources make it easy to create custom dashboards that fit your specific needs.
- Real-time alerting – Combining Prometheus' powerful alerting system with Grafana's interactive dashboards allows you to monitor your systems in real-time and quickly respond to issues.
- Scalability – Both tools are designed to handle large amounts of data and can scale to meet the needs of growing organizations.
Overall, using Prometheus and Grafana together provides a powerful and flexible monitoring solution that can help you better understand and manage your systems.


