Stop tab-switching at 3AM. Wire trace_id into logs and exemplars into metrics so you can pivot from alert to root cause in seconds, not hours.
A complete guide to OpenTelemetry: what it is, how the Collector and OTLP work, and how to instrument your first service.
Learn how to add distributed tracing to LangChain and LlamaIndex apps using OpenLLMetry and the OpenTelemetry SDK, with traces flowing into OpenObserve.
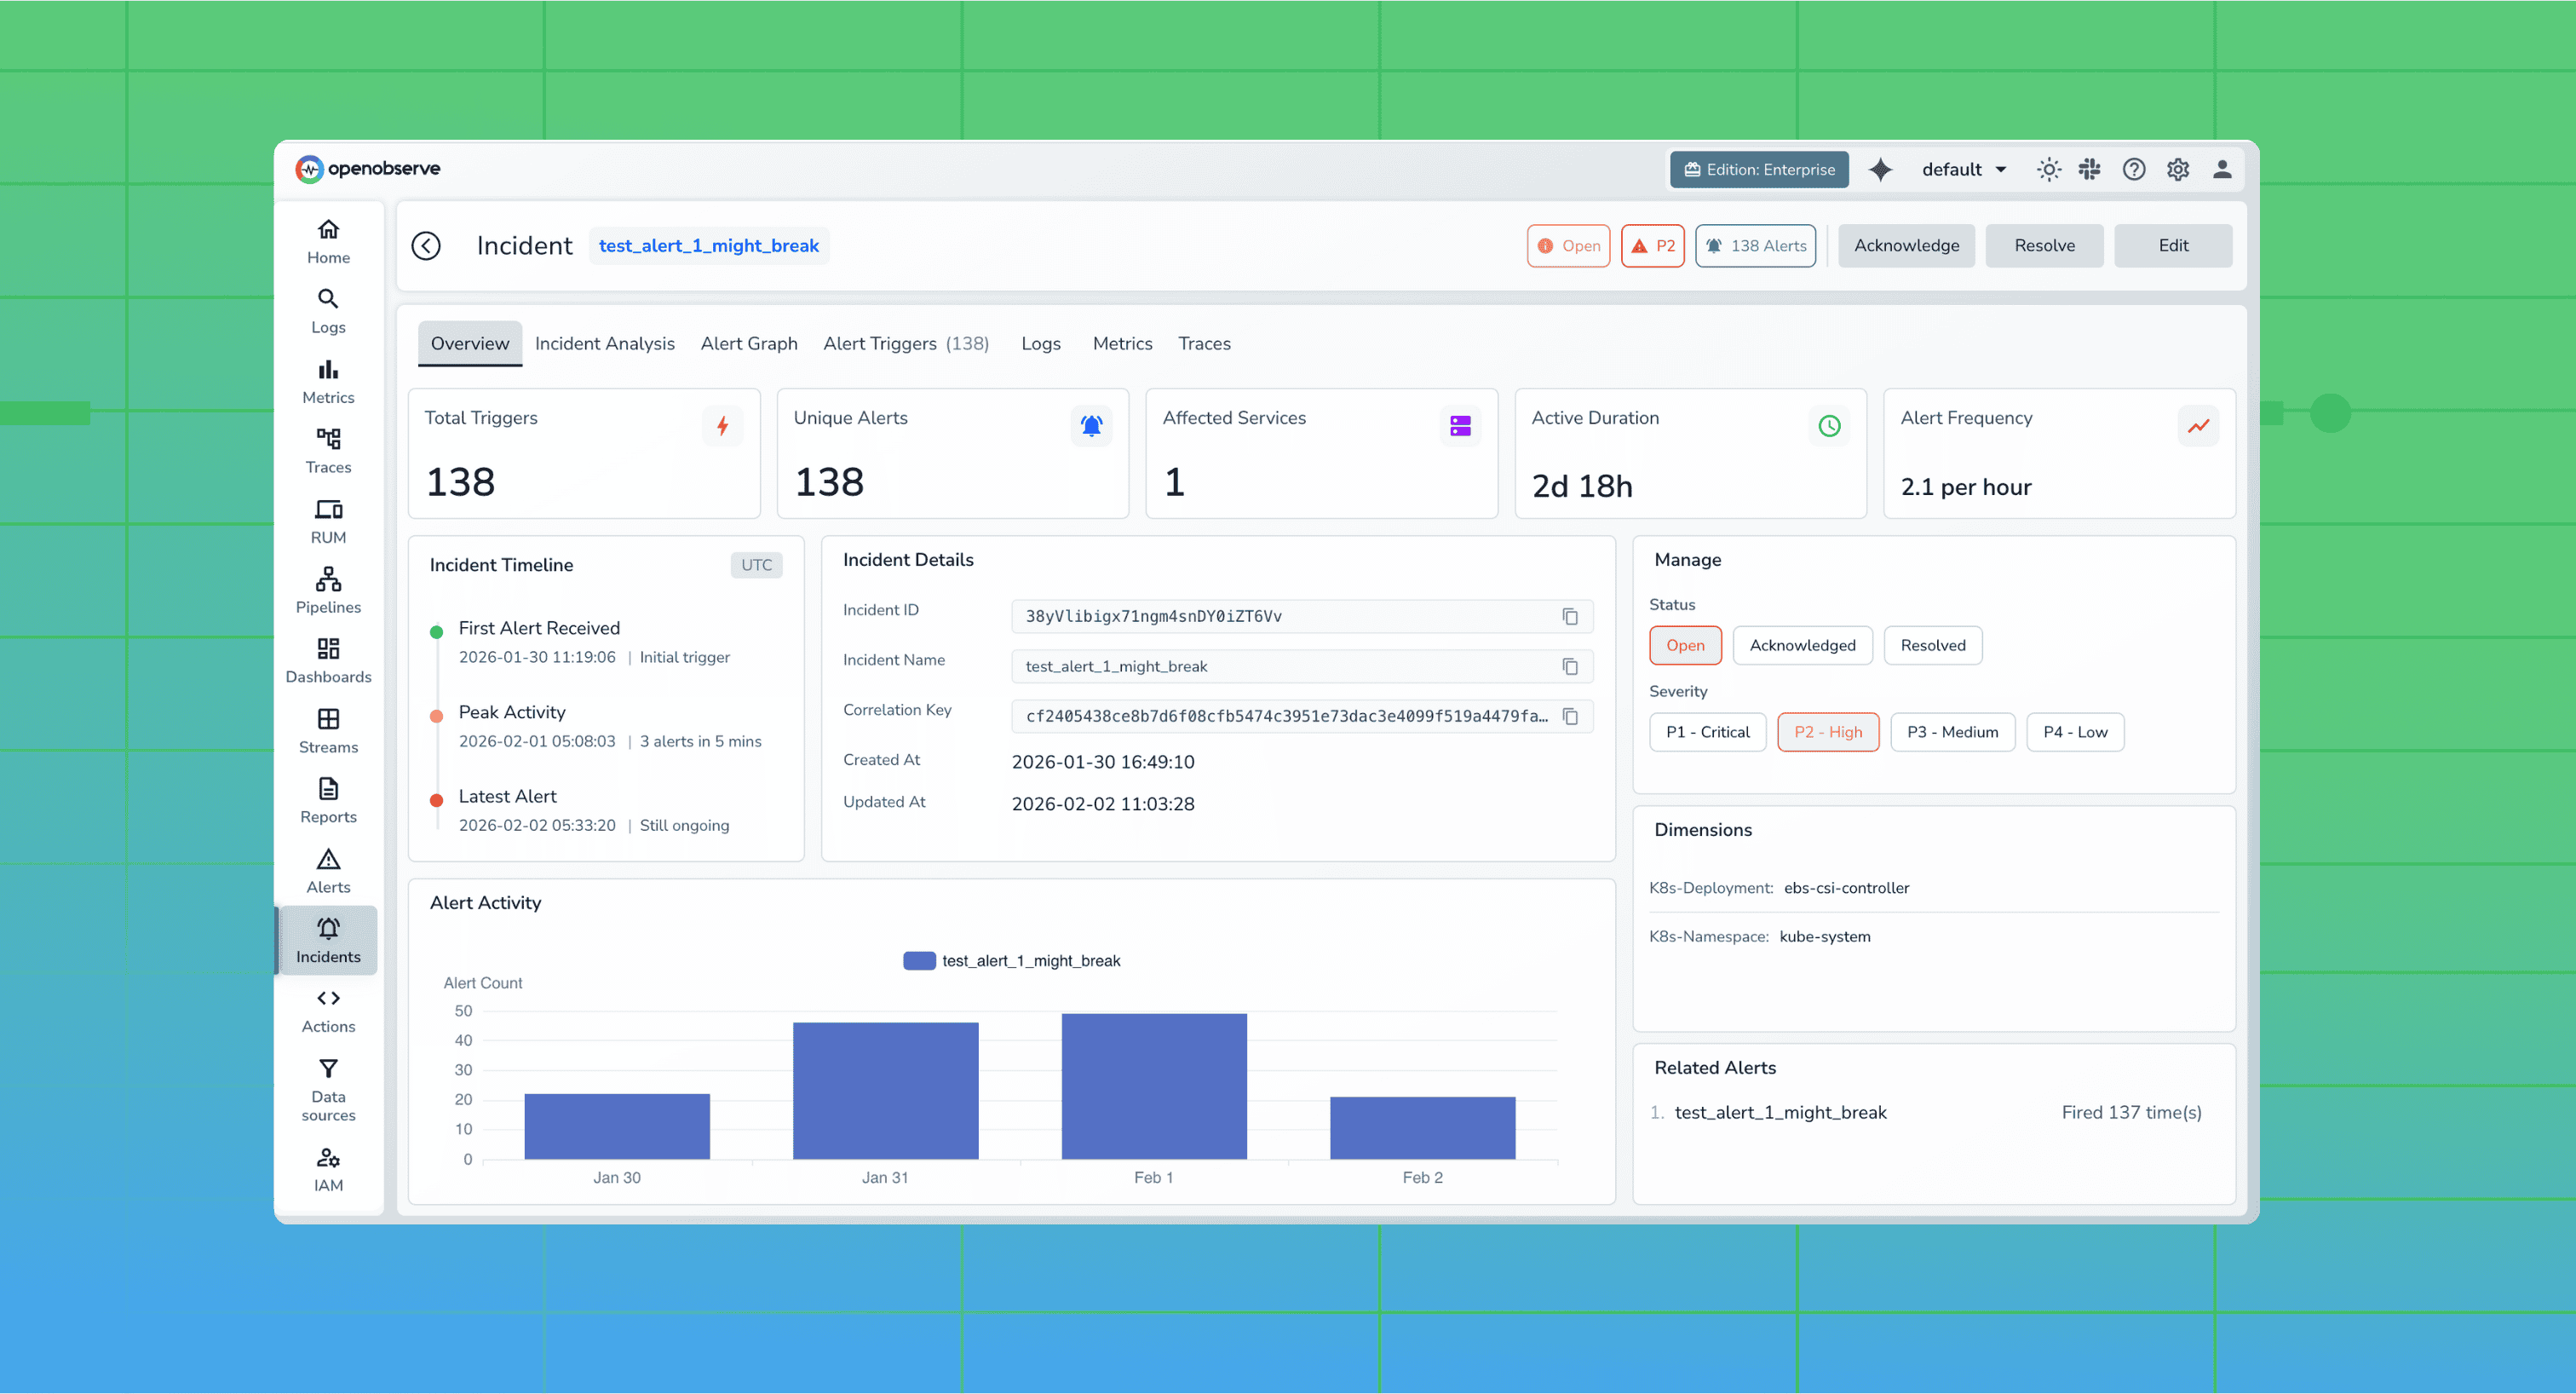
Learn how incident correlation transforms observability by connecting logs, metrics, traces, and alerts into actionable insights. Discover why modern engineering teams rely on correlated telemetry to reduce MTTR and eliminate blind spots in distributed systems.
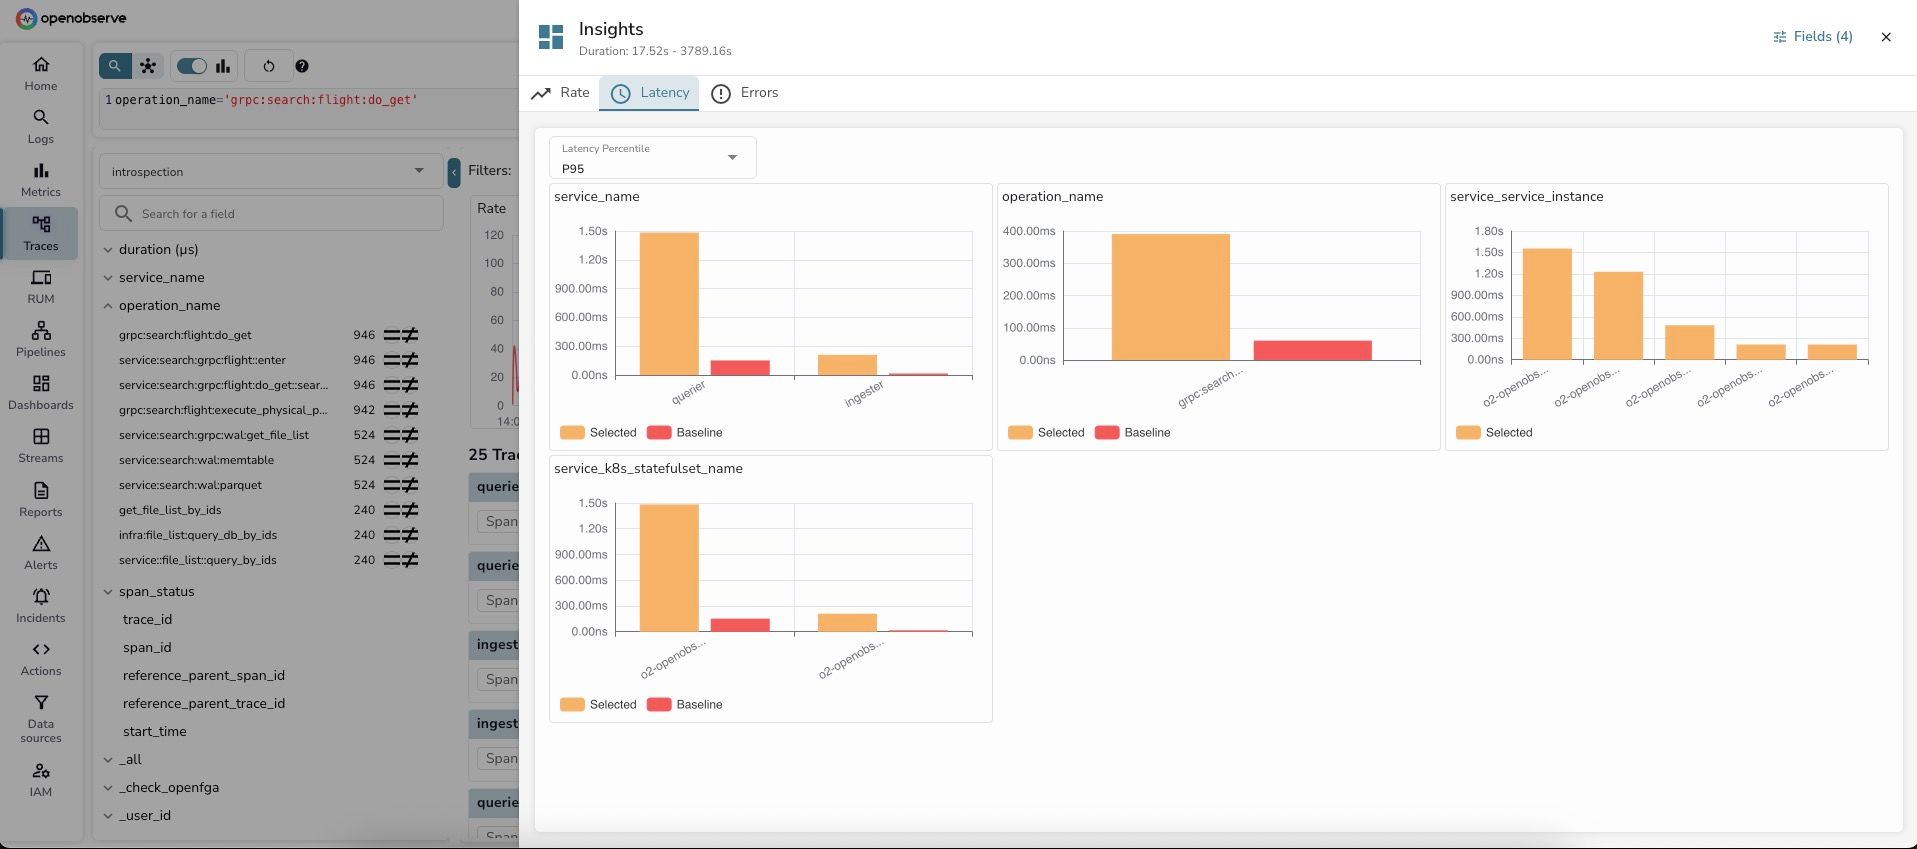
Learn how to use OpenObserve Insights for interactive log and trace analysis. Identify root causes in 60 seconds with dimension analysis. Real examples, step-by-step guides, and troubleshooting tips.
Discover how full-stack observability helps teams correlate telemetry across systems to cut MTTR, reduce data costs, and improve performance.
Learn how to add complete observability to your microservices for distributed tracing without changing a single line of code. This hands-on demo shows auto-instrumentation across Go, Node.js, Java, Python, and .NET using OpenTelemetry and OpenObserve.
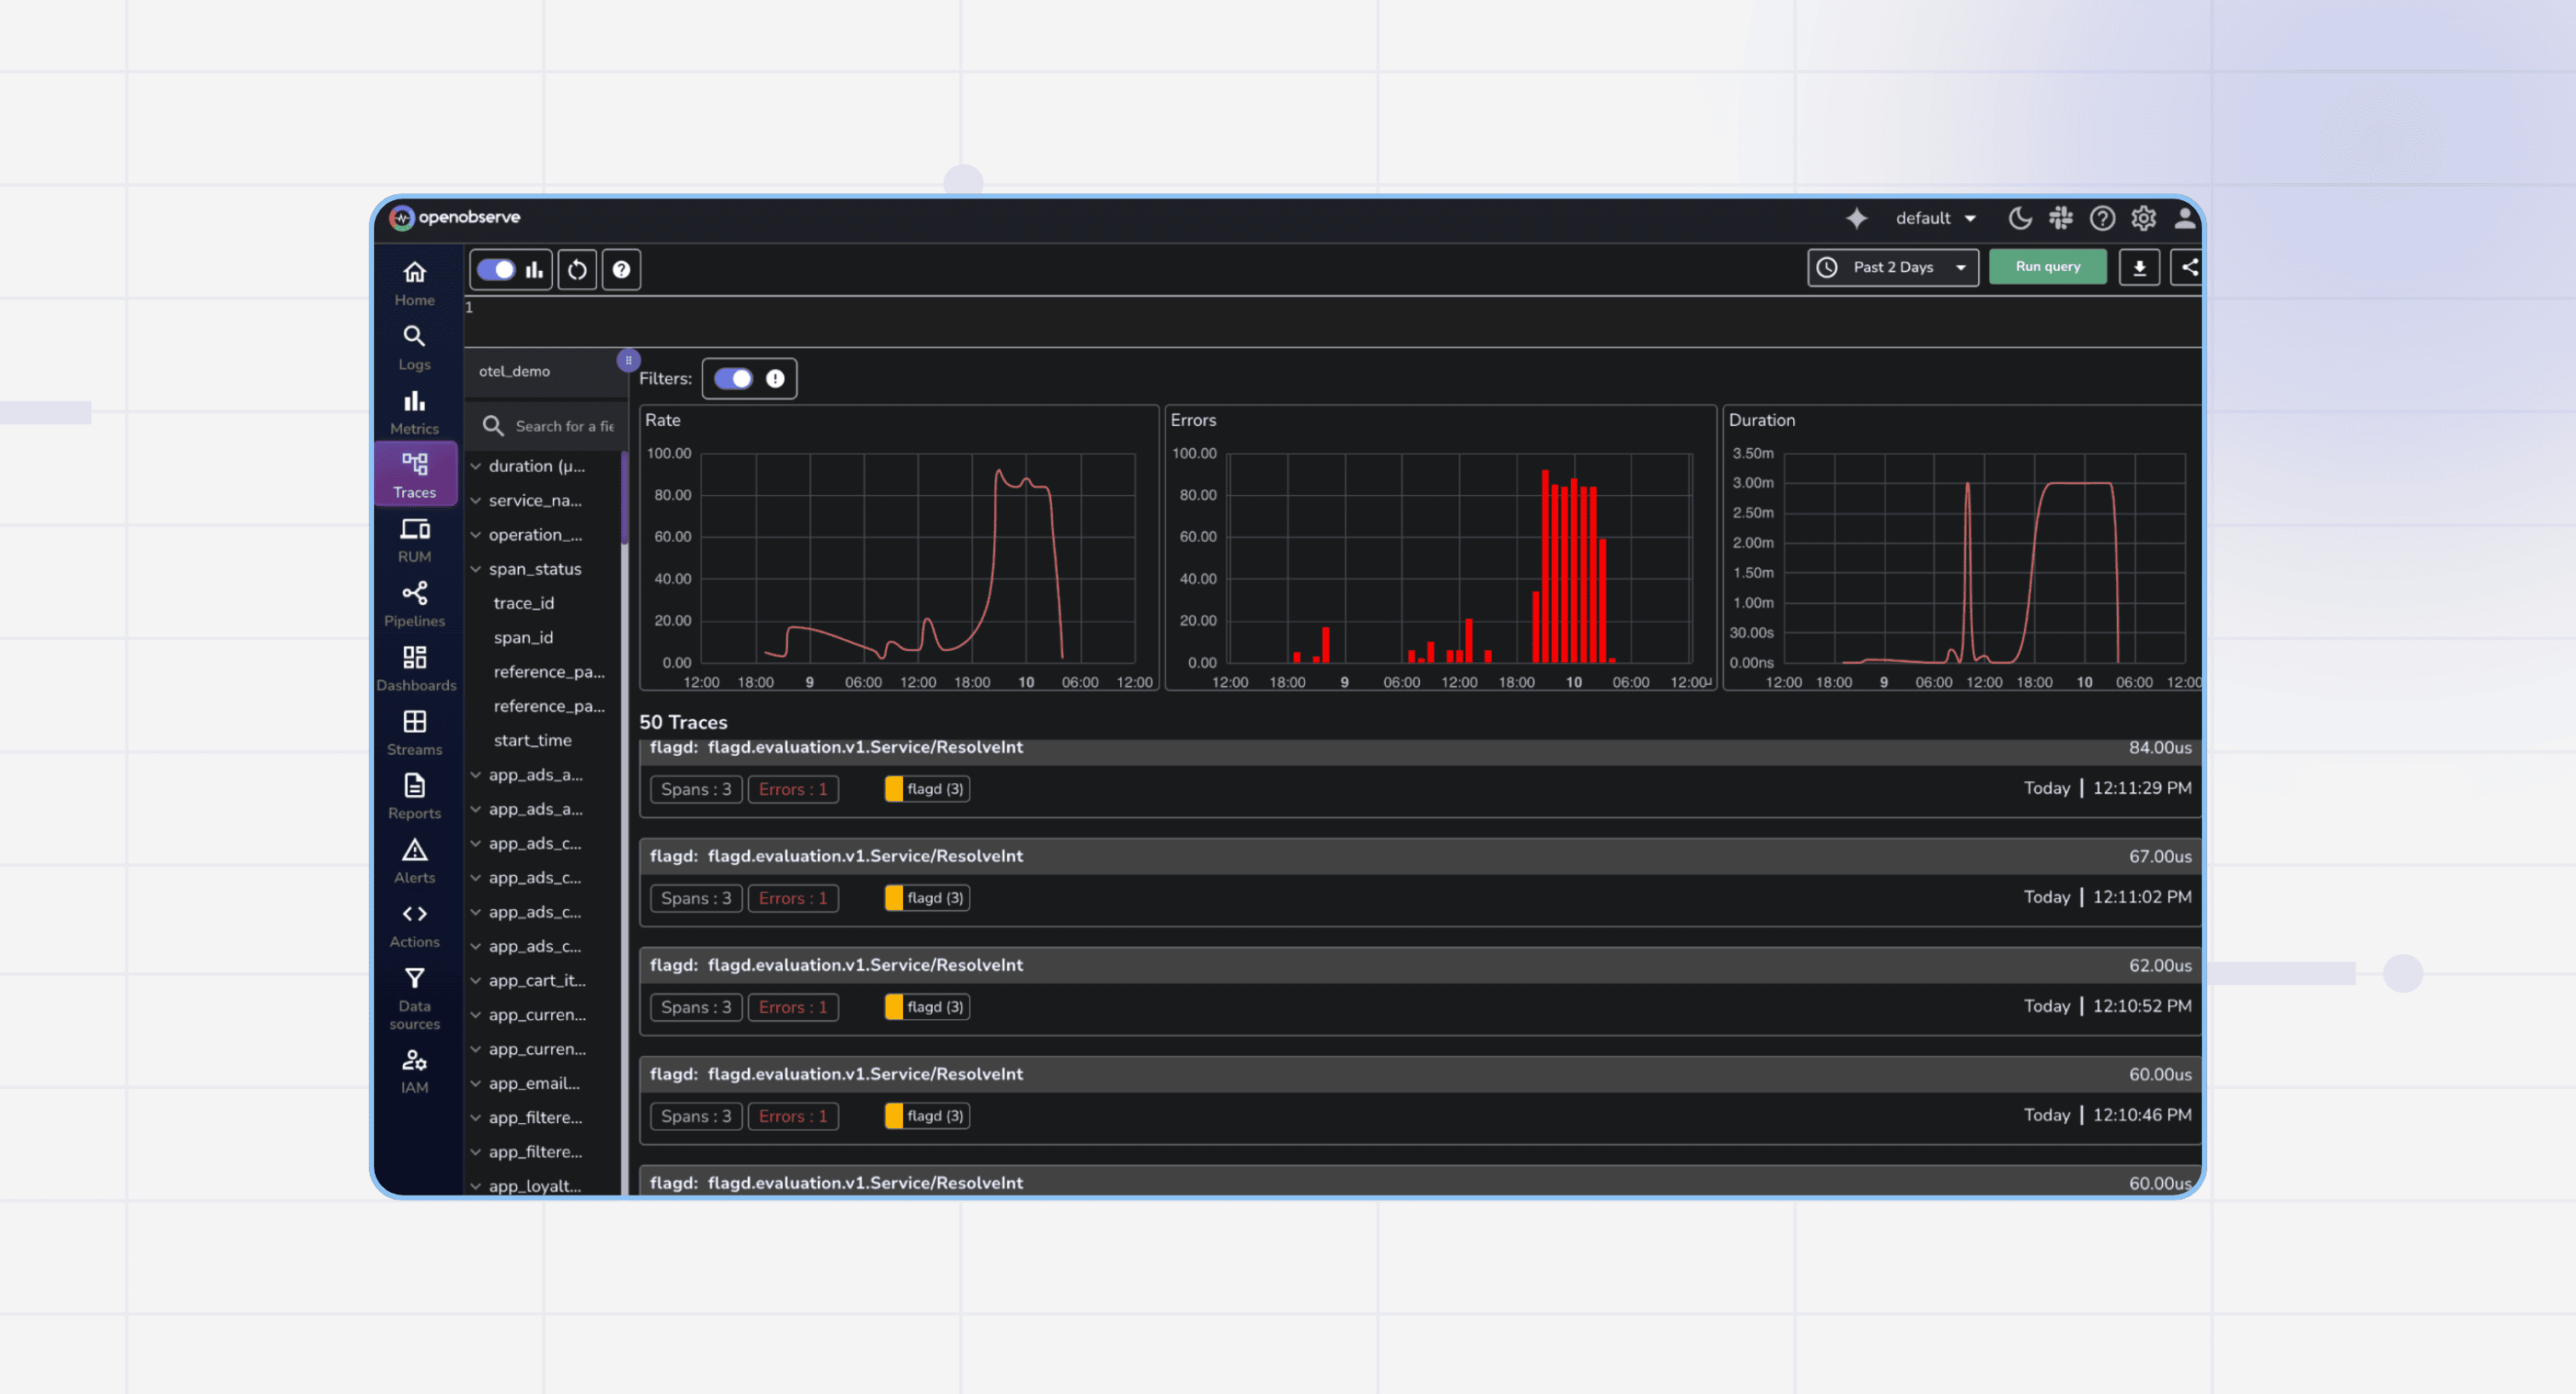
Deploy the OpenTelemetry Astronomy Shop demo and stream traces, metrics, and logs to OpenObserve with Helm. Easily configure OTLP and visualize everything in dashboards.
Master SLO-based alerting in OpenObserve. Easily set reliability targets, track error budgets, and cut alert noise with SQL-driven monitoring.
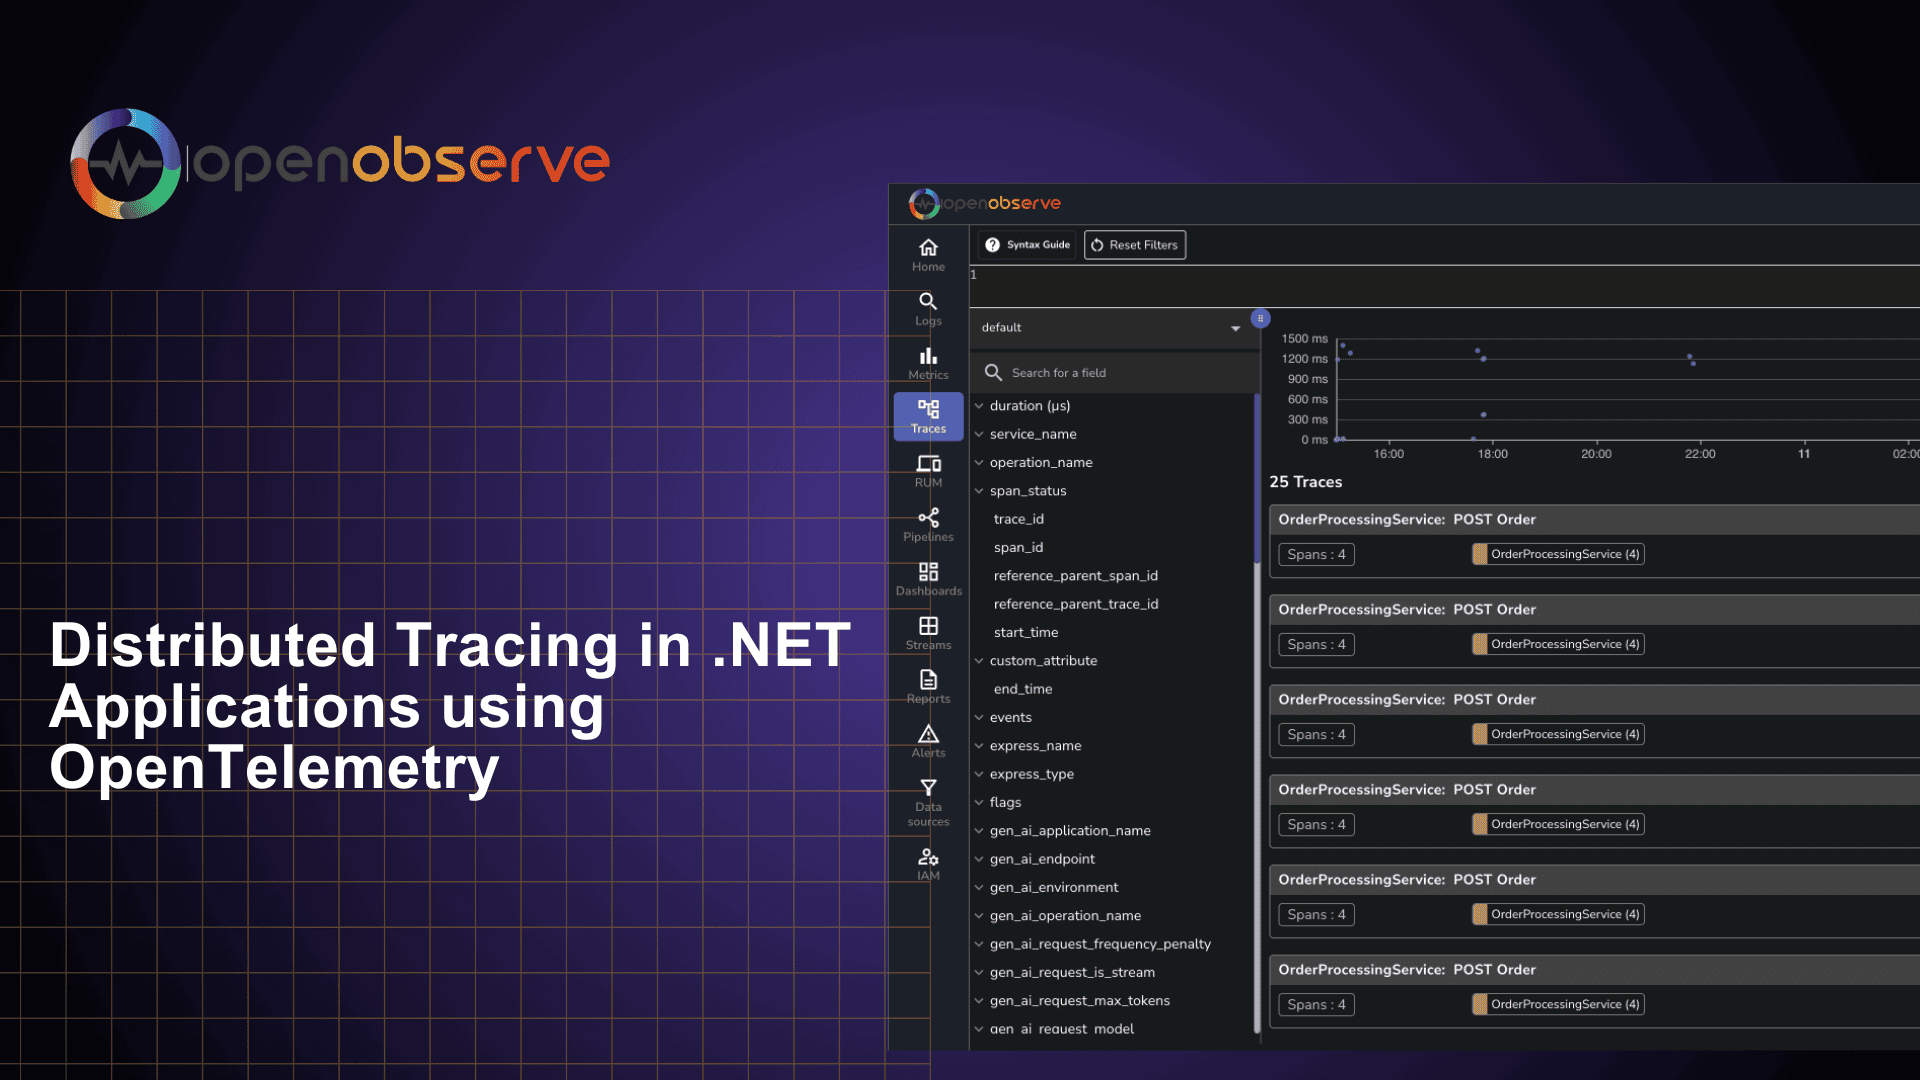
Learn how to implement distributed tracing in your .NET applications using OpenTelemetry. This guide covers the benefits of distributed tracing, how to get started with OpenTelemetry, and best practices for implementation.
Learn how to implement distributed tracing in Go applications using OpenTelemetry. This comprehensive guide covers auto and manual instrumentation, correlating traces, metrics, and logs, and visualizing data in OpenObserve for complete observability.
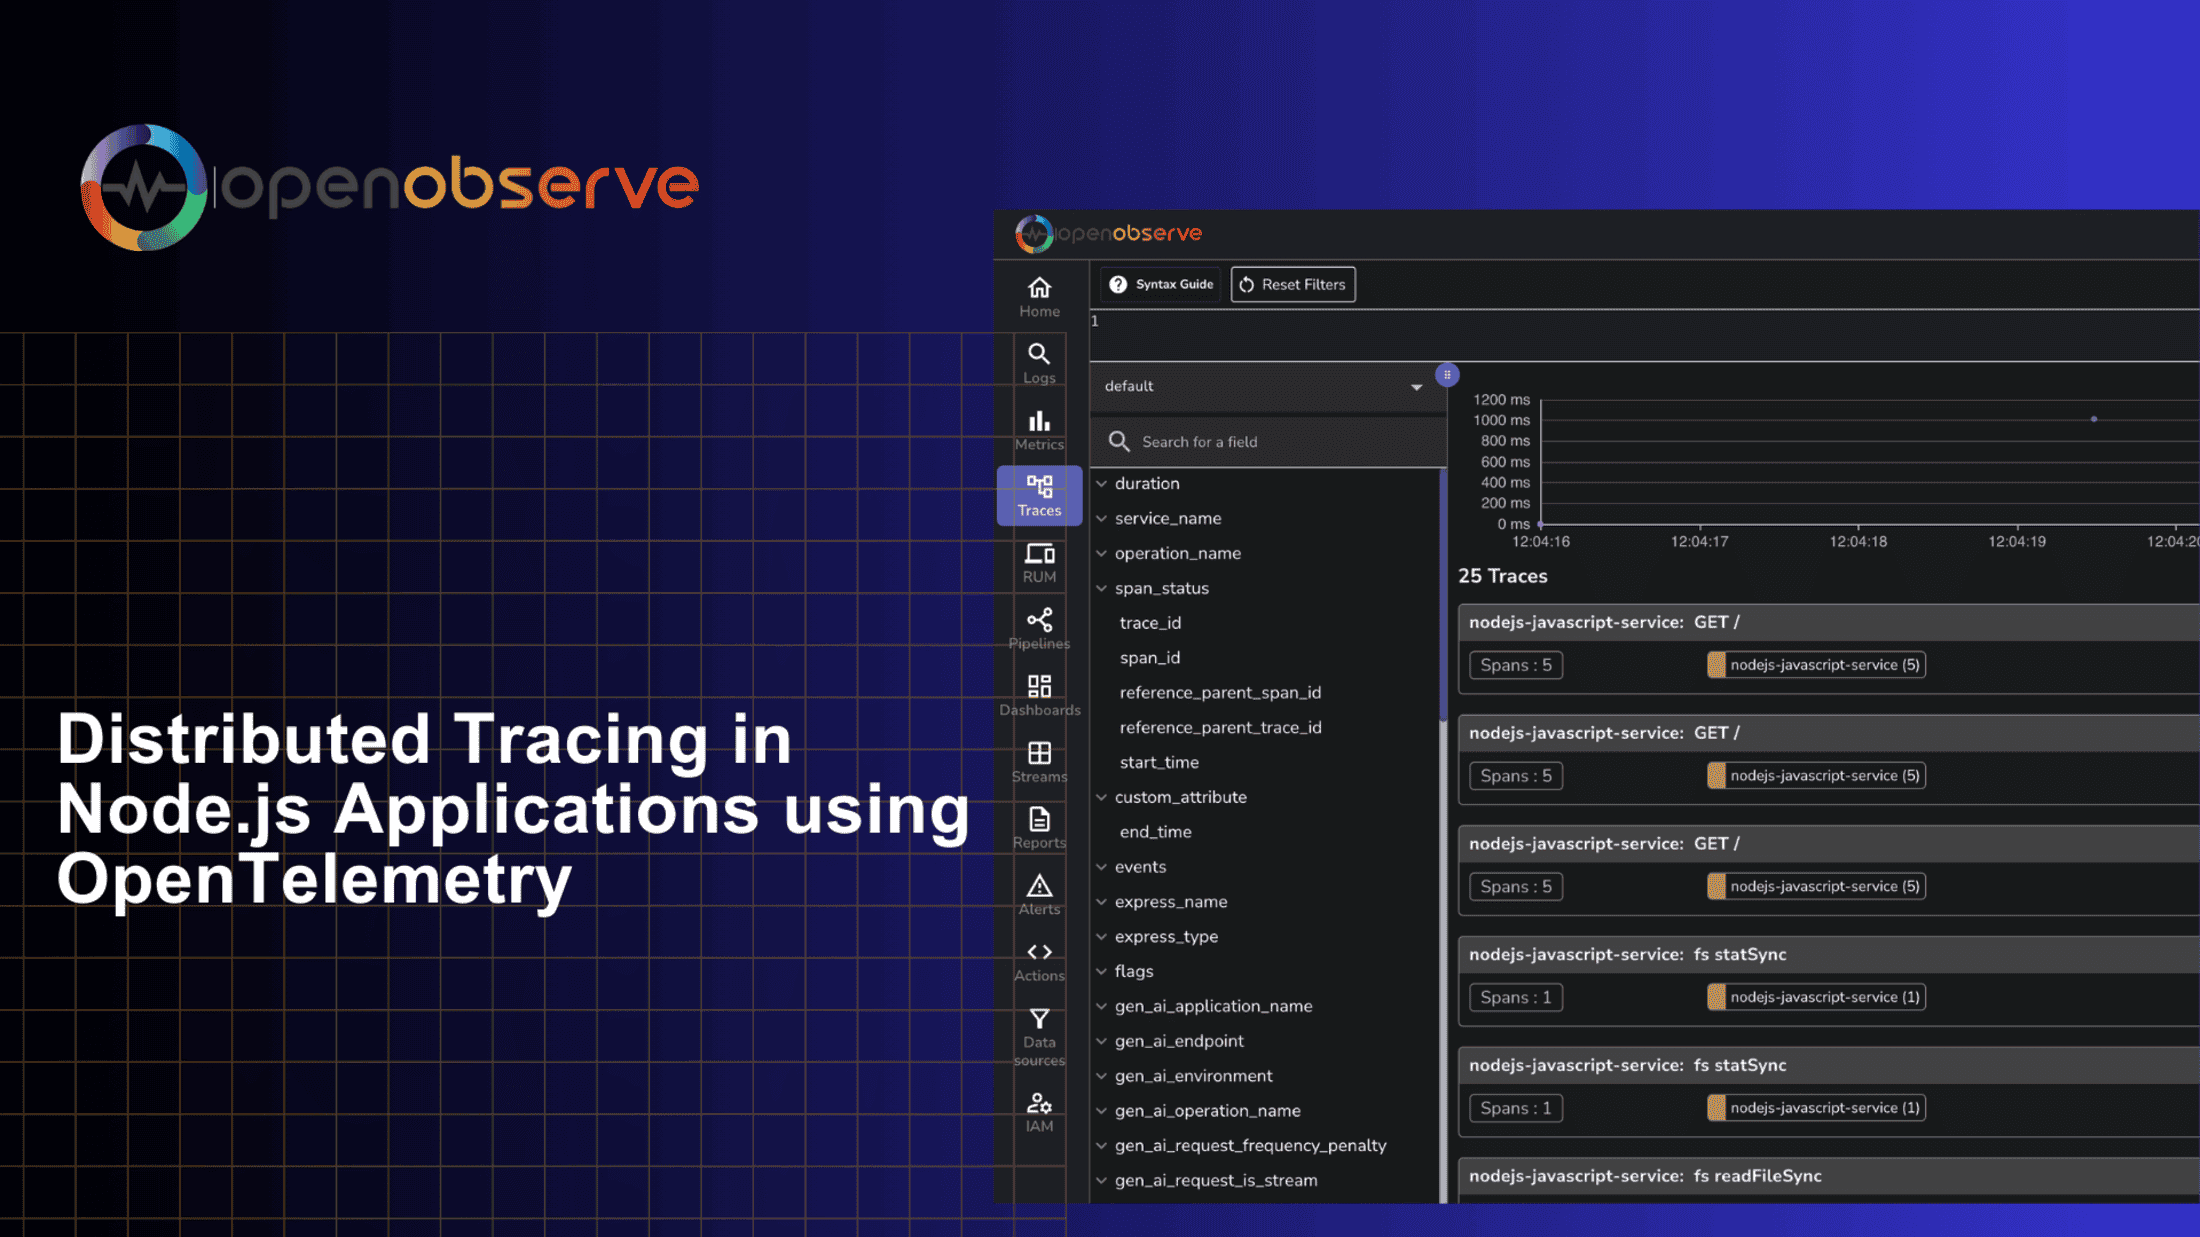
Learn how to implement distributed tracing in your Node.js applications using OpenTelemetry. Complete guide covering auto & manual instrumentation, trace visualization, and monitoring with OpenObserve.
Discover the essentials of distributed tracing, from core concepts to implementation. Learn how to visualize and analyze trace data, pinpoint bottlenecks, and optimize your microservices architecture with OpenObserve.
Discover the essential guide to Jaeger and learn how distributed tracing can elevate your modern applications. Ideal for DevOps professionals and developers, this guide unlocks insights for better performance, troubleshooting, and system optimization.