The Zipkin Receiver is a crucial component in distributed tracing systems, designed to efficiently ingest trace data from applications using Zipkin. By enabling the collection and processing of trace data, the Zipkin Receiver helps developers monitor, troubleshoot, and optimize the performance of distributed systems.
Whether you're tracking microservices or analyzing complex workflows, Zipkin Receiver plays a key role in visualizing and understanding how requests flow through your system. Its integration with popular observability platforms allows for real-time insights and improved system diagnostics, making it indispensable for achieving end-to-end observability.
Now that we have a clear understanding of what the Zipkin Receiver is, let's explore how it functions within distributed tracing systems, its common use cases, and how various platforms implement it effectively.
Understanding the Role of a Zipkin Receiver: Key Functions and Use Cases
A Zipkin receiver is a component that collects and processes trace data in the Zipkin format. It's often part of a larger distributed tracing system, acting as a gateway for incoming trace information.
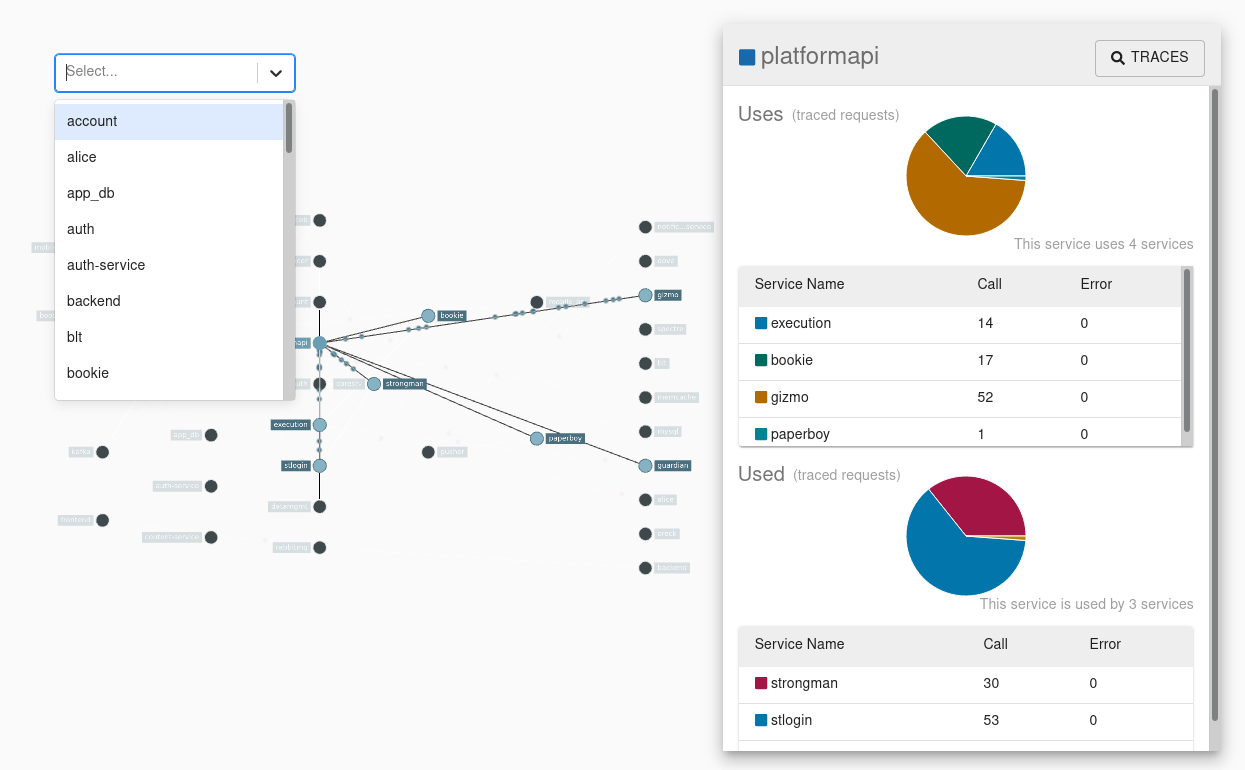
Image Credit
How it Works:
- Receives Trace Data: It accepts trace data in Zipkin v1 or v2 format, typically through HTTP or Kafka.
- Translation: Converts the received Zipkin data into a format compatible with the underlying system (e.g., OpenTelemetry format).
- Forwarding: Sends the processed trace data to other components for storage, analysis, or visualization.
Common Use Cases:
- Collecting traces from Zipkin-instrumented applications: Integrating with existing systems that generate Zipkin data.
- Acting as a bridge between Zipkin and other tracing systems: Combining data from different sources for unified analysis.
- Offloading trace data processing: Distributing the workload of handling trace data.
Popular Implementations:
- OpenObserve: Combine it with a Zipkin-compatible receiver like Jaeger and a Zipkin-to-OpenTelemetry converter.
- Apache SkyWalking: Includes a Zipkin receiver to process Zipkin traces alongside its native trace data.
- Splunk Observability Cloud: Offers a Zipkin receiver as part of its OpenTelemetry Collector.
- AWS Distro for OpenTelemetry (ADOT): Provides a Zipkin receiver for collecting and processing Zipkin data.
Key Points:
- Supports Zipkin v1 and v2 formats.
- Can be configured to handle different input and output formats.
- Often used in conjunction with other components like processors and exporters.
Getting Started
To effectively set up and utilize a Zipkin receiver for distributed tracing, follow these detailed steps, including example configurations for various implementations.
Steps to Use a Zipkin Receiver
1. Choose a Zipkin Receiver Implementation
There are several options available for implementing a Zipkin receiver:
- OpenObserve: Combine it with a Zipkin-compatible receiver like Jaeger and a Zipkin-to-OpenTelemetry converter.
- Apache SkyWalking: Provides a Zipkin receiver as part of its observability platform, supporting both Zipkin v1 and v2 formats.
- Splunk Observability Cloud: Includes a Zipkin receiver as part of its OpenTelemetry Collector, which can gather spans from Zipkin versions 1 and 2.
- AWS Distro for OpenTelemetry (ADOT): Offers a Zipkin receiver for collecting and processing Zipkin data.
- Custom Implementation: For specific requirements, you can build a custom Zipkin receiver.
2. Install and Configure the Receiver
Follow the installation and configuration instructions specific to your chosen implementation. This typically involves:
- Downloading and installing dependencies: Ensure all necessary libraries and tools are in place.
- Configuring the receiver's endpoint: Set the host and port for receiving Zipkin data.
- Specifying the format of incoming Zipkin data: Choose between v1 or v2 formats.
- Configuring output options: Determine where to send the processed trace data.
3. Configure Zipkin-Instrumented Applications
Ensure your applications are instrumented to send trace data in Zipkin format to the receiver's endpoint. This involves:
- Adding Zipkin libraries to your application.
- Configuring these libraries to send spans to the specified receiver.
4. Start the Receiver
After configuration, start the Zipkin receiver service. This could involve running a command or starting a service depending on the implementation.
5. Verify Data Reception
Monitor the receiver to ensure it is receiving trace data. This can be done by:
- Checking logs for incoming data.
- Using built-in monitoring tools provided by the receiver.
- Visualizing traces using the Zipkin UI, typically accessible at http://localhost:9411/zipkin.
Additional Considerations
- Error Handling: Implement mechanisms to deal with invalid or malformed trace data.
- Data Storage: Decide where to store processed trace data, such as in a time-series database or search engine.
- Security: Consider security measures to protect sensitive data within trace data.
- Performance: Optimize the receiver for performance, especially when handling high volumes of trace data.
Best Practices
- Use a reliable and scalable Zipkin receiver implementation.
- Properly configure the receiver to match your environment and requirements.
- Thoroughly test the receiver to ensure functionality.
- Continuously monitor the receiver's performance and adjust configurations as necessary.
By following these steps and considering the additional factors, you can effectively set up and utilize a Zipkin receiver for your distributed tracing needs. In the following section, you will learn about advanced configuration.
Advanced Configuration for Zipkin Receiver
A Zipkin receiver is a crucial component in distributed tracing, enabling the collection and processing of trace data from various services. To maximize its functionality and adaptability, several advanced configuration options are available. Let’s explore these options in detail:
1. Utilizes Several Helper Files for Added Capabilities
Zipkin receivers can leverage external configuration files or libraries to enhance their features and flexibility. These helper files may include:
- Custom Data Processors: These are scripts or modules designed to transform or enrich incoming trace data before it is stored or analyzed. This can involve adding metadata, filtering out unnecessary information, or altering the structure of the data for better compatibility with downstream systems.
- Error Handling Mechanisms: Robust error handling is essential for maintaining the integrity of trace data. Configuration options may include defining fallback procedures, logging errors, and notifying system administrators of issues.
- Metrics and Logging Configurations: Monitoring the performance of the receiver is vital for troubleshooting and optimization. Configurable metrics can track throughput, error rates, and latency, while logging configurations can capture detailed operational logs for analysis.
- Integration with Other Systems: Advanced configurations can facilitate connections with external components such as storage solutions (databases, cloud storage), analytics platforms, or alerting systems, enabling a more cohesive observability strategy.
By modularizing these functionalities, you can customize the receiver's behavior without altering the core codebase, making it easier to maintain and upgrade.
2. Supports gRPC Settings Including CORS
Many Zipkin receivers now support gRPC as a communication protocol for receiving trace data, which offers several advanced configuration options:
- Specify gRPC Server Settings: You can configure essential parameters such as the server's port, host, and the maximum number of concurrent connections. This flexibility allows for better resource management and performance tuning.
- Configure CORS (Cross-Origin Resource Sharing): Enabling CORS is crucial for allowing cross-origin requests to access the receiver's API. This is particularly important in web applications where the frontend may need to interact with the receiver from a different domain.
- Implement Authentication and Authorization: Security is a top priority, and advanced configurations can include mechanisms for authenticating requests and authorizing access to the receiver. This helps protect sensitive trace data from unauthorized access.
3. Incorporates TLS and mTLS Settings
Security configurations are vital when handling sensitive trace data. Advanced settings for TLS (Transport Layer Security) and mTLS (Mutual TLS) include:
- Enabling TLS: This ensures that data transmitted between the sender and receiver is encrypted, safeguarding it from eavesdropping and tampering.
- Configuring mTLS: By requiring both the client and server to authenticate each other, mTLS adds an additional layer of security, ensuring that only trusted entities can communicate with the receiver.
- Customizing Certificate and Key Management: Fine-grained control over encryption and authentication can be achieved by customizing how certificates and keys are managed, including specifying paths, formats, and rotation policies.
4. Offers Queuing, Retry, and Timeout Settings
To handle varying load conditions and ensure data reliability, Zipkin receivers often provide:
- Queuing Mechanisms: These allow incoming trace data to be buffered temporarily, preventing overload during peak traffic and improving overall performance.
- Retry Policies: Configurable retry mechanisms can automatically resend failed requests, increasing the likelihood of successful data delivery and minimizing data loss.
- Timeout Settings: Defining maximum waiting times for responses helps prevent indefinite blocking, ensuring that the receiver remains responsive even under heavy load.
By carefully tuning these parameters, you can optimize the receiver's behavior to meet specific operational requirements.
Additional Considerations
Beyond the core configurations, there are several additional factors to consider for a robust Zipkin receiver setup:
- Load Balancing: Implementing load balancing strategies can distribute incoming traffic across multiple receiver instances, enhancing high availability and scalability.
- Monitoring and Alerting: Establishing a robust monitoring framework is critical to track receiver performance. Setting up alerts for critical issues ensures timely responses to potential problems.
- Data Retention: Determine the appropriate retention policy for trace data based on your organizational needs and storage capabilities. This helps manage storage costs and compliance requirements.
- Performance Optimization: Fine-tuning configuration settings to maximize throughput and minimize latency can significantly enhance the overall efficiency of the Zipkin receiver.
By understanding and effectively utilizing these advanced configuration options, you can build a robust and efficient Zipkin receiver tailored to your specific use case, ultimately improving your distributed tracing capabilities and observability strategy.
Documentation
Package zipkinreceiver
The zipkinreceiver package is specifically designed to handle incoming Zipkin trace data. This implies that it's optimized for processing and storing traces in the Zipkin format. It likely provides functions and structures to:
- Parse incoming Zipkin spans.
- Validate the structure of received data.
- Extract relevant information from spans (e.g., trace ID, span ID, parent ID, timestamps, annotations, binary annotations).
- Store or forward the processed trace data to a backend system.
- Handle potential errors or exceptions during the process.
Functions and Types
- NewFactory():
This function is typically used to create a new instance of a Zipkin receiver factory. A factory pattern is often employed to encapsulate the creation of receiver objects, allowing for flexible configuration and customization.
The NewFactory() function might accept configuration parameters to specify the receiver's behavior, such as:
- Listening address
- Data format (Zipkin v1 or v2)
- Storage backend
- Error handling strategy
- type Config:
The Config struct represents the configuration settings for a Zipkin receiver. It typically includes fields for:
- Listener address (host and port)
- Data format (Zipkin v1 or v2)
- Storage backend configuration (e.g., database connection string)
- Buffer size (for queuing incoming spans)
- Sampling rate (for reducing data volume)
- Error handling options (e.g., retry policy, logging)
- func (cfg *Config) Validate() error:
This method is essential for ensuring the correctness and consistency of the receiver configuration. It performs validation checks on the Config struct to detect any invalid or missing values. Errors returned by this function can help prevent runtime issues and provide informative error messages to users.
Additional Considerations
- Performance: The zipkinreceiver package should be optimized for handling high volumes of trace data efficiently. This might involve using asynchronous processing, batching, and efficient data structures.
- Error Handling: Robust error handling is crucial to prevent data loss and maintain system reliability. The package should provide mechanisms for handling network errors, parsing errors, storage failures, and other exceptions.
- Extensibility: The package might offer extension points for custom data processing, storage, and output formats to accommodate diverse use cases.
- Testing: Comprehensive unit and integration tests are essential to ensure the correctness and reliability of the receiver.
By understanding these core components and their functionalities, developers can effectively use the zipkinreceiver package to build reliable and efficient distributed tracing systems.
Use OpenObserve with the Zipkin receiver:
Configure the Zipkin Receiver in OpenObserve
To enable the Zipkin receiver in OpenObserve, you need to add the following configuration to your OpenObserve collector configuration file:
text
receivers:
zipkin:
endpoint: 0.0.0.0:9411
format: proto
This configures the Zipkin receiver to listen on 0.0.0.0:9411 and accept spans in Protobuf format.
Send Zipkin Spans to OpenObserve
To send Zipkin spans to OpenObserve, you can use the default Zipkin span submission endpoint:
text
http://localhost:9411/api/v2/spans
The Content-Type should be application/json, and you can optionally use gzip encoding.
Alternatively, if you have configured the Zipkin receiver to accept Protobuf format, you would send spans to:
text
http://localhost:9411/api/v2/spans?format=proto
Visualize Traces in OpenObserve
Once you have sent Zipkin spans to OpenObserve, you can visualize the traces in the OpenObserve UI. OpenObserve provides advanced features for analyzing trace data, such as:
- Distributed context propagation
- Distributed transaction monitoring
- Root cause analysis
- Service dependency analysis
Migrate from Zipkin to OpenObserve
If you are migrating from Zipkin to OpenObserve, you can leverage Jaeger's compatibility with Zipkin. Jaeger supports Zipkin's B3 propagation format, allowing you to join traces with other Zipkin-instrumented services.
Additionally, Jaeger accepts Zipkin spans in Thrift format over HTTP, with the default endpoint being:
text
http://localhost:14268/api/traces?format=zipkin.thrift
By supporting Zipkin's B3 propagation format and providing a Zipkin-compatible API, Jaeger makes it easier to migrate from Zipkin and join traces across different instrumentation systems.
In summary, to use OpenObserve with the Zipkin receiver, you need to configure the receiver in OpenObserve, send Zipkin spans to the appropriate endpoint, and visualize the traces in the OpenObserve UI. OpenObserve's compatibility with Jaeger also simplifies the migration process from Zipkin.
Conclusion
By effectively utilizing a Zipkin receiver, you can seamlessly integrate your distributed tracing system with the broader observability landscape. OpenObserve, with its powerful capabilities and compatibility with Zipkin, offers a compelling solution for comprehensive trace analysis and optimization.
Ready to unlock the full potential of your trace data? Sign up for OpenObserve today and experience the difference. With OpenObserve, you can effortlessly collect, process, and visualize Zipkin traces, gaining valuable insights into your application's performance and behavior.
Start your journey towards enhanced observability with OpenObserve!
Additional Considerations
- Security: Implement robust security measures to protect sensitive data within trace data.
- Performance: Optimize the receiver for performance, especially when handling high volumes of trace data.
- Data Retention: Determine an appropriate data retention policy based on your organizational needs and storage capabilities.
- Monitoring: Continuously monitor the receiver's performance and adjust configurations as necessary.
By following these guidelines and leveraging the power of OpenObserve, you can effectively harness the value of your Zipkin data and drive improvements in your application's performance and reliability.
Resources
OpenTelemetry filelog receiver + OpenObserve: Any logs
https://www.youtube.com/watch?v=Jqocv1UYn6Y