Tracing Made Easy: A Beginner's Guide to Jaeger v2




Ready to get started?
Try OpenObserve Cloud today for more efficient and performant observability.
Jaeger is an open-source distributed tracing platform, originally built at Uber and now a CNCF-graduated project, that tracks requests as they travel across the services of a distributed system. In 2026 that means Jaeger v2: a complete re-architecture built on the OpenTelemetry Collector, released after Jaeger v1 reached end-of-life on December 31, 2025.
TL;DR:
- Jaeger v1 is end-of-life (December 31, 2025) - the agent and Jaeger client libraries are gone.
- Jaeger v2 is built on the OpenTelemetry Collector and speaks OTLP natively (ports 4317/4318).
- You can deploy Jaeger v2 and the HotROD demo app with two Docker commands.
- Because everything is OTLP now, switching backends - for example to OpenObserve - is a two-environment-variable change.
Prerequisites
- A running Docker instance with admin access.
- Optionally, an OpenObserve instance or cloud account for the second half of the guide.
What Is Distributed Tracing?
Distributed tracing is a method for tracking a single request as it moves through every service in a distributed system - from the initial entry point all the way to the final response.
E.g. Service A → Service B → Service C → Service D
In a monolith, a stack trace tells you where time went. In a microservices architecture, one user click can fan out across dozens of services, and logging alone can't reconstruct the path or show you where latency accumulated. Distributed tracing captures that end-to-end journey, which lets developers:
- Trace requests across service boundaries
- Visualize service dependencies and interactions
- Identify performance bottlenecks
- Pinpoint the failing service quickly during incidents
Tracing is one of the three pillars of observability, alongside logging (individual events and errors) and metrics (quantified system performance). If you're new to the ecosystem, our guide to what OpenTelemetry is and how it works covers how all three signals are instrumented today, and our roundup of distributed tracing tools compares the backend options.
What Is Jaeger?
Jaeger is an open-source, end-to-end distributed tracing backend originally developed by Uber Technologies and later donated to the CNCF, where it became one of the first graduated projects. With Jaeger, you can:
- Track request latency and identify the services contributing to slow responses
- Monitor errors and investigate root causes of failures across services
- Visualize service dependency graphs
- Analyze trace timelines span by span
Jaeger is widely adopted because it is free, focused, and battle-tested at enormous scale. But the Jaeger you deploy in 2026 is structurally different from the one most older tutorials describe - which brings us to v2.
What Changed in Jaeger v2?
Jaeger v2, first released in November 2024, rebuilt the entire project on top of the OpenTelemetry Collector framework, and Jaeger v1 reached end-of-life on December 31, 2025. If a tutorial mentions the Jaeger agent, Jaeger client libraries, or jaegertracing/all-in-one, it's describing the legacy architecture.
| Jaeger v1 (EOL) | Jaeger v2 (current) | |
|---|---|---|
| Core | Custom Jaeger pipeline | Built on the OpenTelemetry Collector |
| Instrumentation | Jaeger client libraries | OpenTelemetry SDKs (Jaeger clients archived) |
| Agent | jaeger-agent daemon (UDP 6831/6832) |
Removed - SDKs export OTLP directly, or via an OTel Collector |
| Ingestion | Jaeger Thrift/gRPC protocols + OTLP bolted on | OTLP-native (4317 gRPC / 4318 HTTP), Zipkin-compatible |
| Docker image | jaegertracing/all-in-one |
cr.jaegertracing.io/jaegertracing/jaeger |
| Configuration | CLI flags and env vars | OpenTelemetry Collector-style YAML config |
| Support | Ended December 31, 2025 | Actively maintained (v2.20 as of July 2026) |
The practical consequence: everything in the Jaeger ecosystem is OpenTelemetry now. You instrument with OTel SDKs, ship OTLP, and Jaeger is one of several backends that can receive it - a point that matters later in this guide when we swap backends without touching the application.
The CNCF's Jaeger v2 release announcement covers the motivation in depth.
How Jaeger Works: Key Concepts and Components
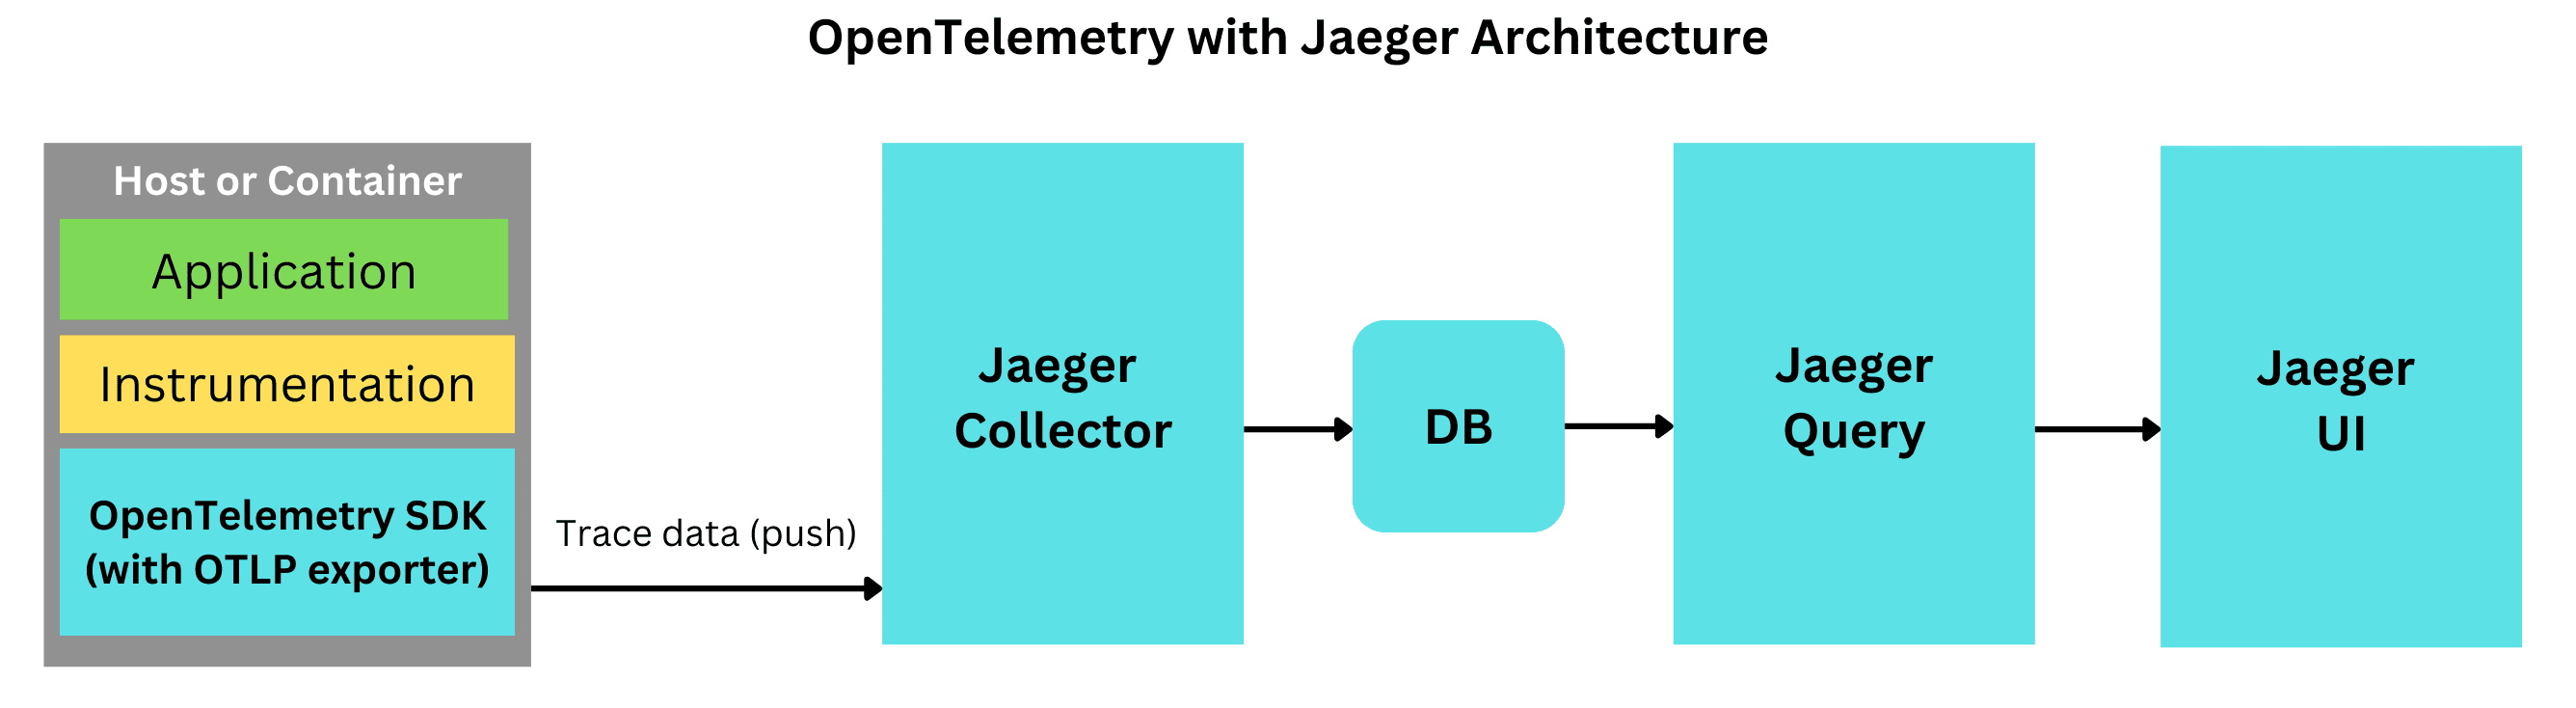
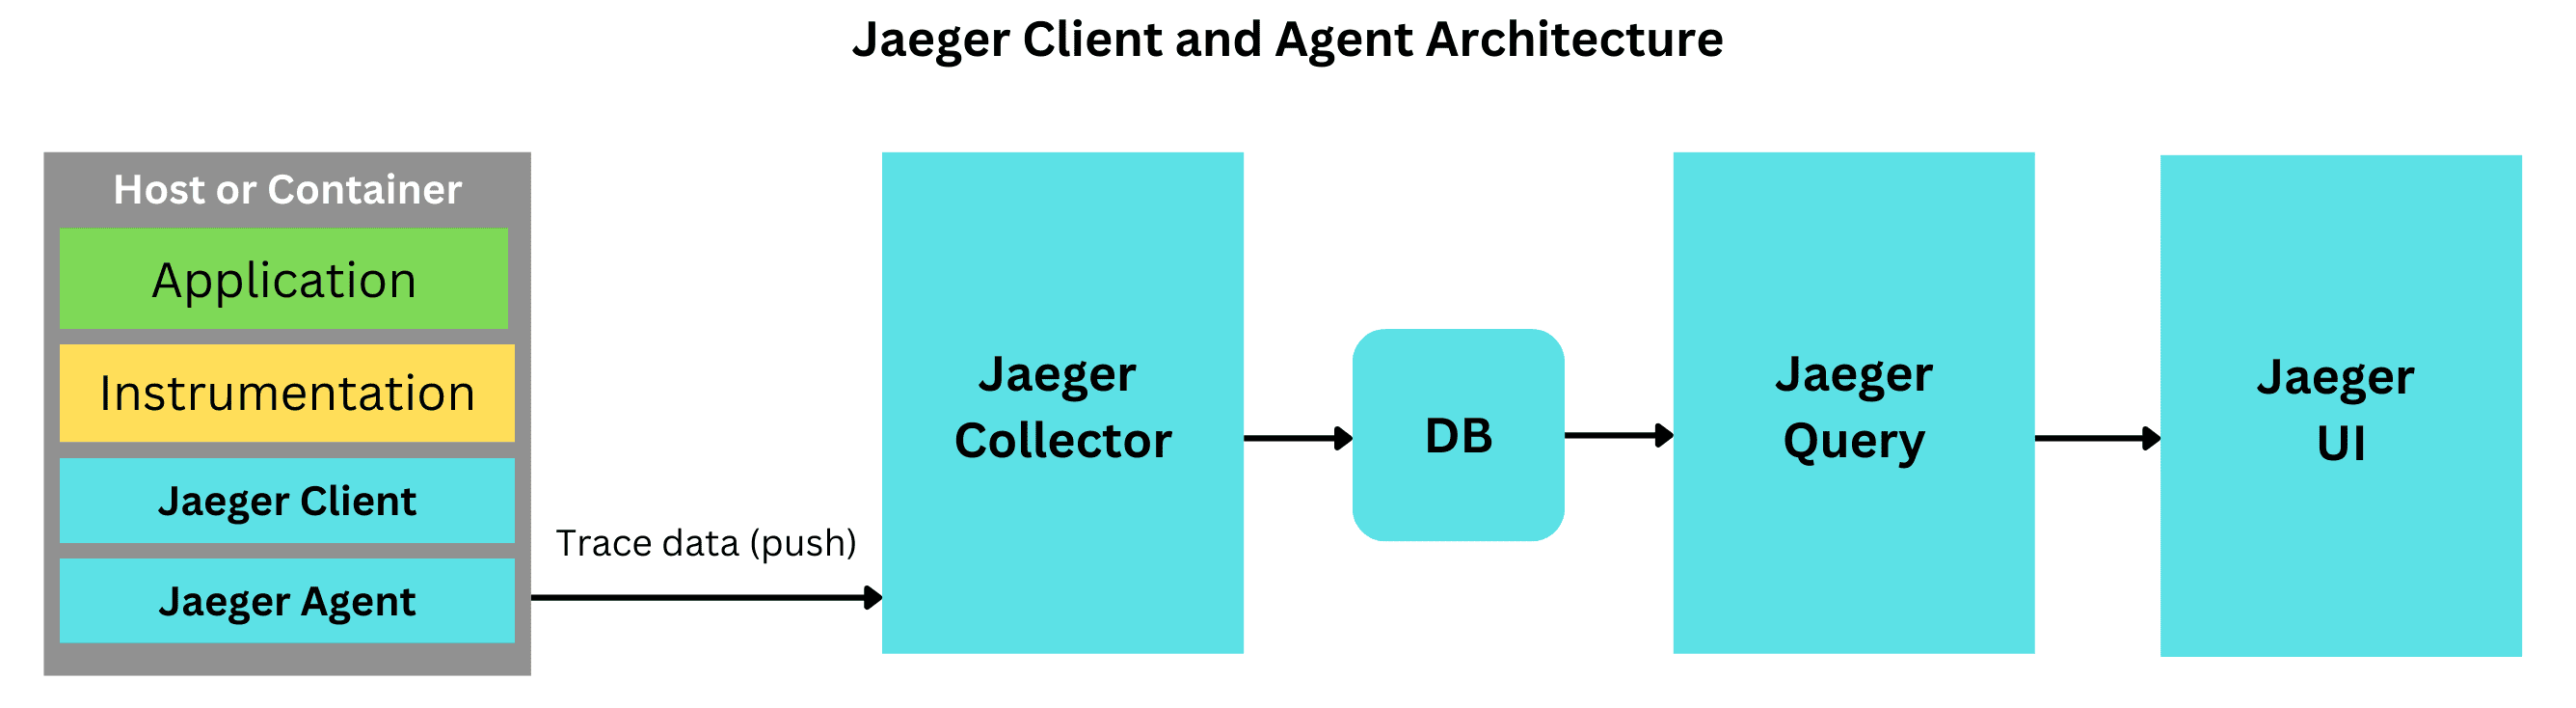
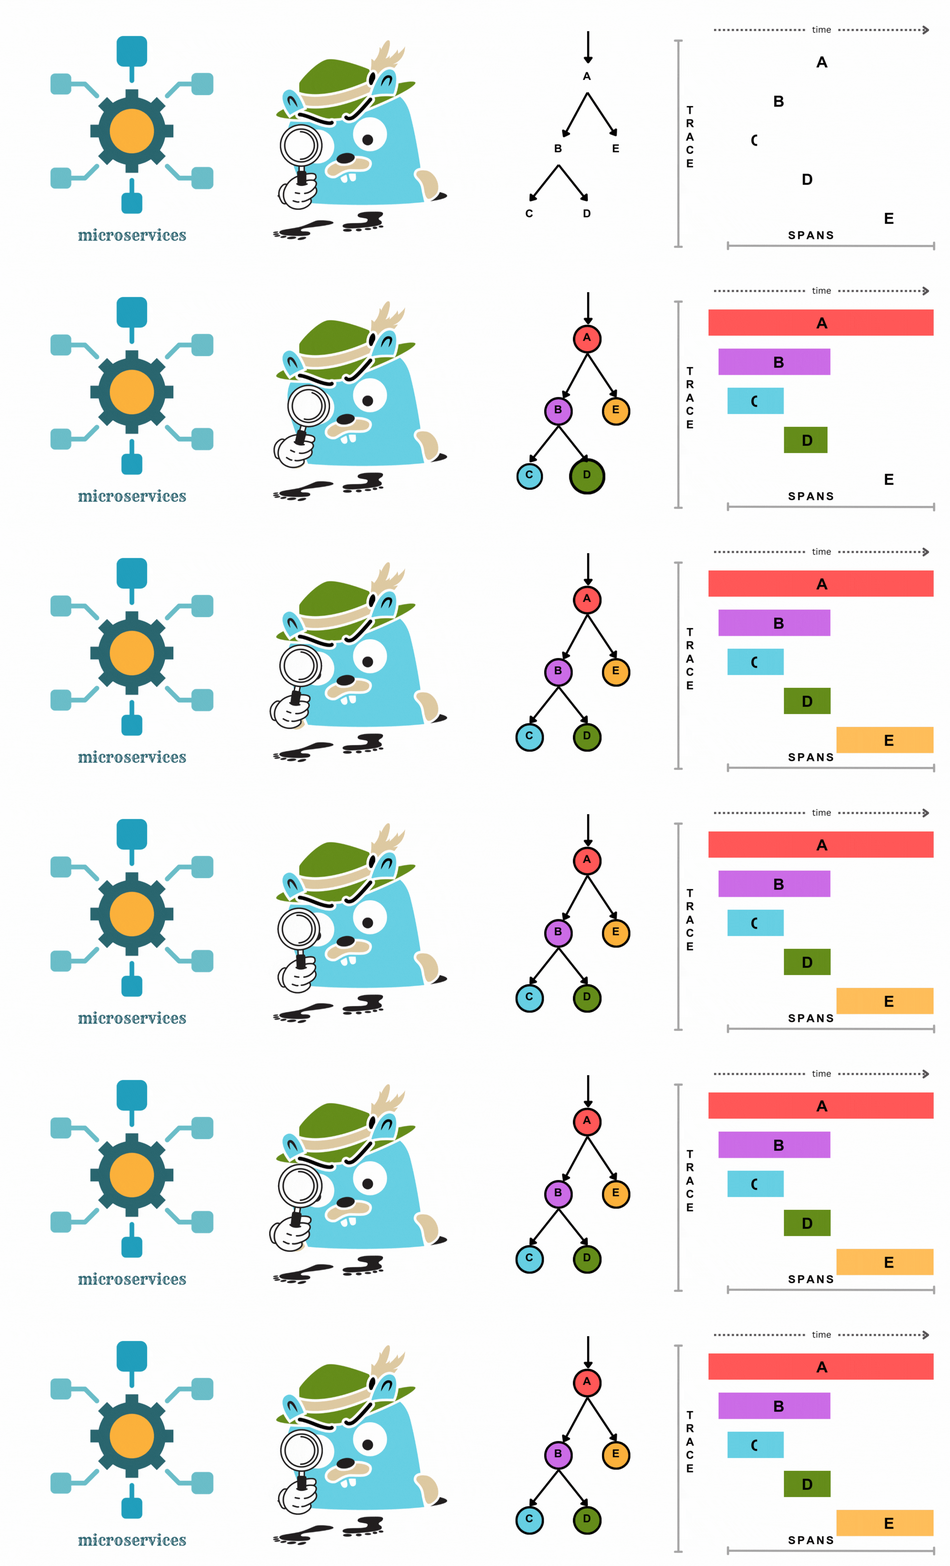
The diagrams above show the classic v1 pipeline (client → agent → collector). In v2, the OpenTelemetry SDK exports directly to Jaeger's built-in OTLP receiver - the agent tier no longer exists. The concepts below are unchanged.
Spans and Traces
- Span: A span represents a single unit of work within a trace - one service call or operation - capturing start time, duration, and metadata such as tags and events.
- Trace: A trace is the entire journey of a request, composed of many spans across services.
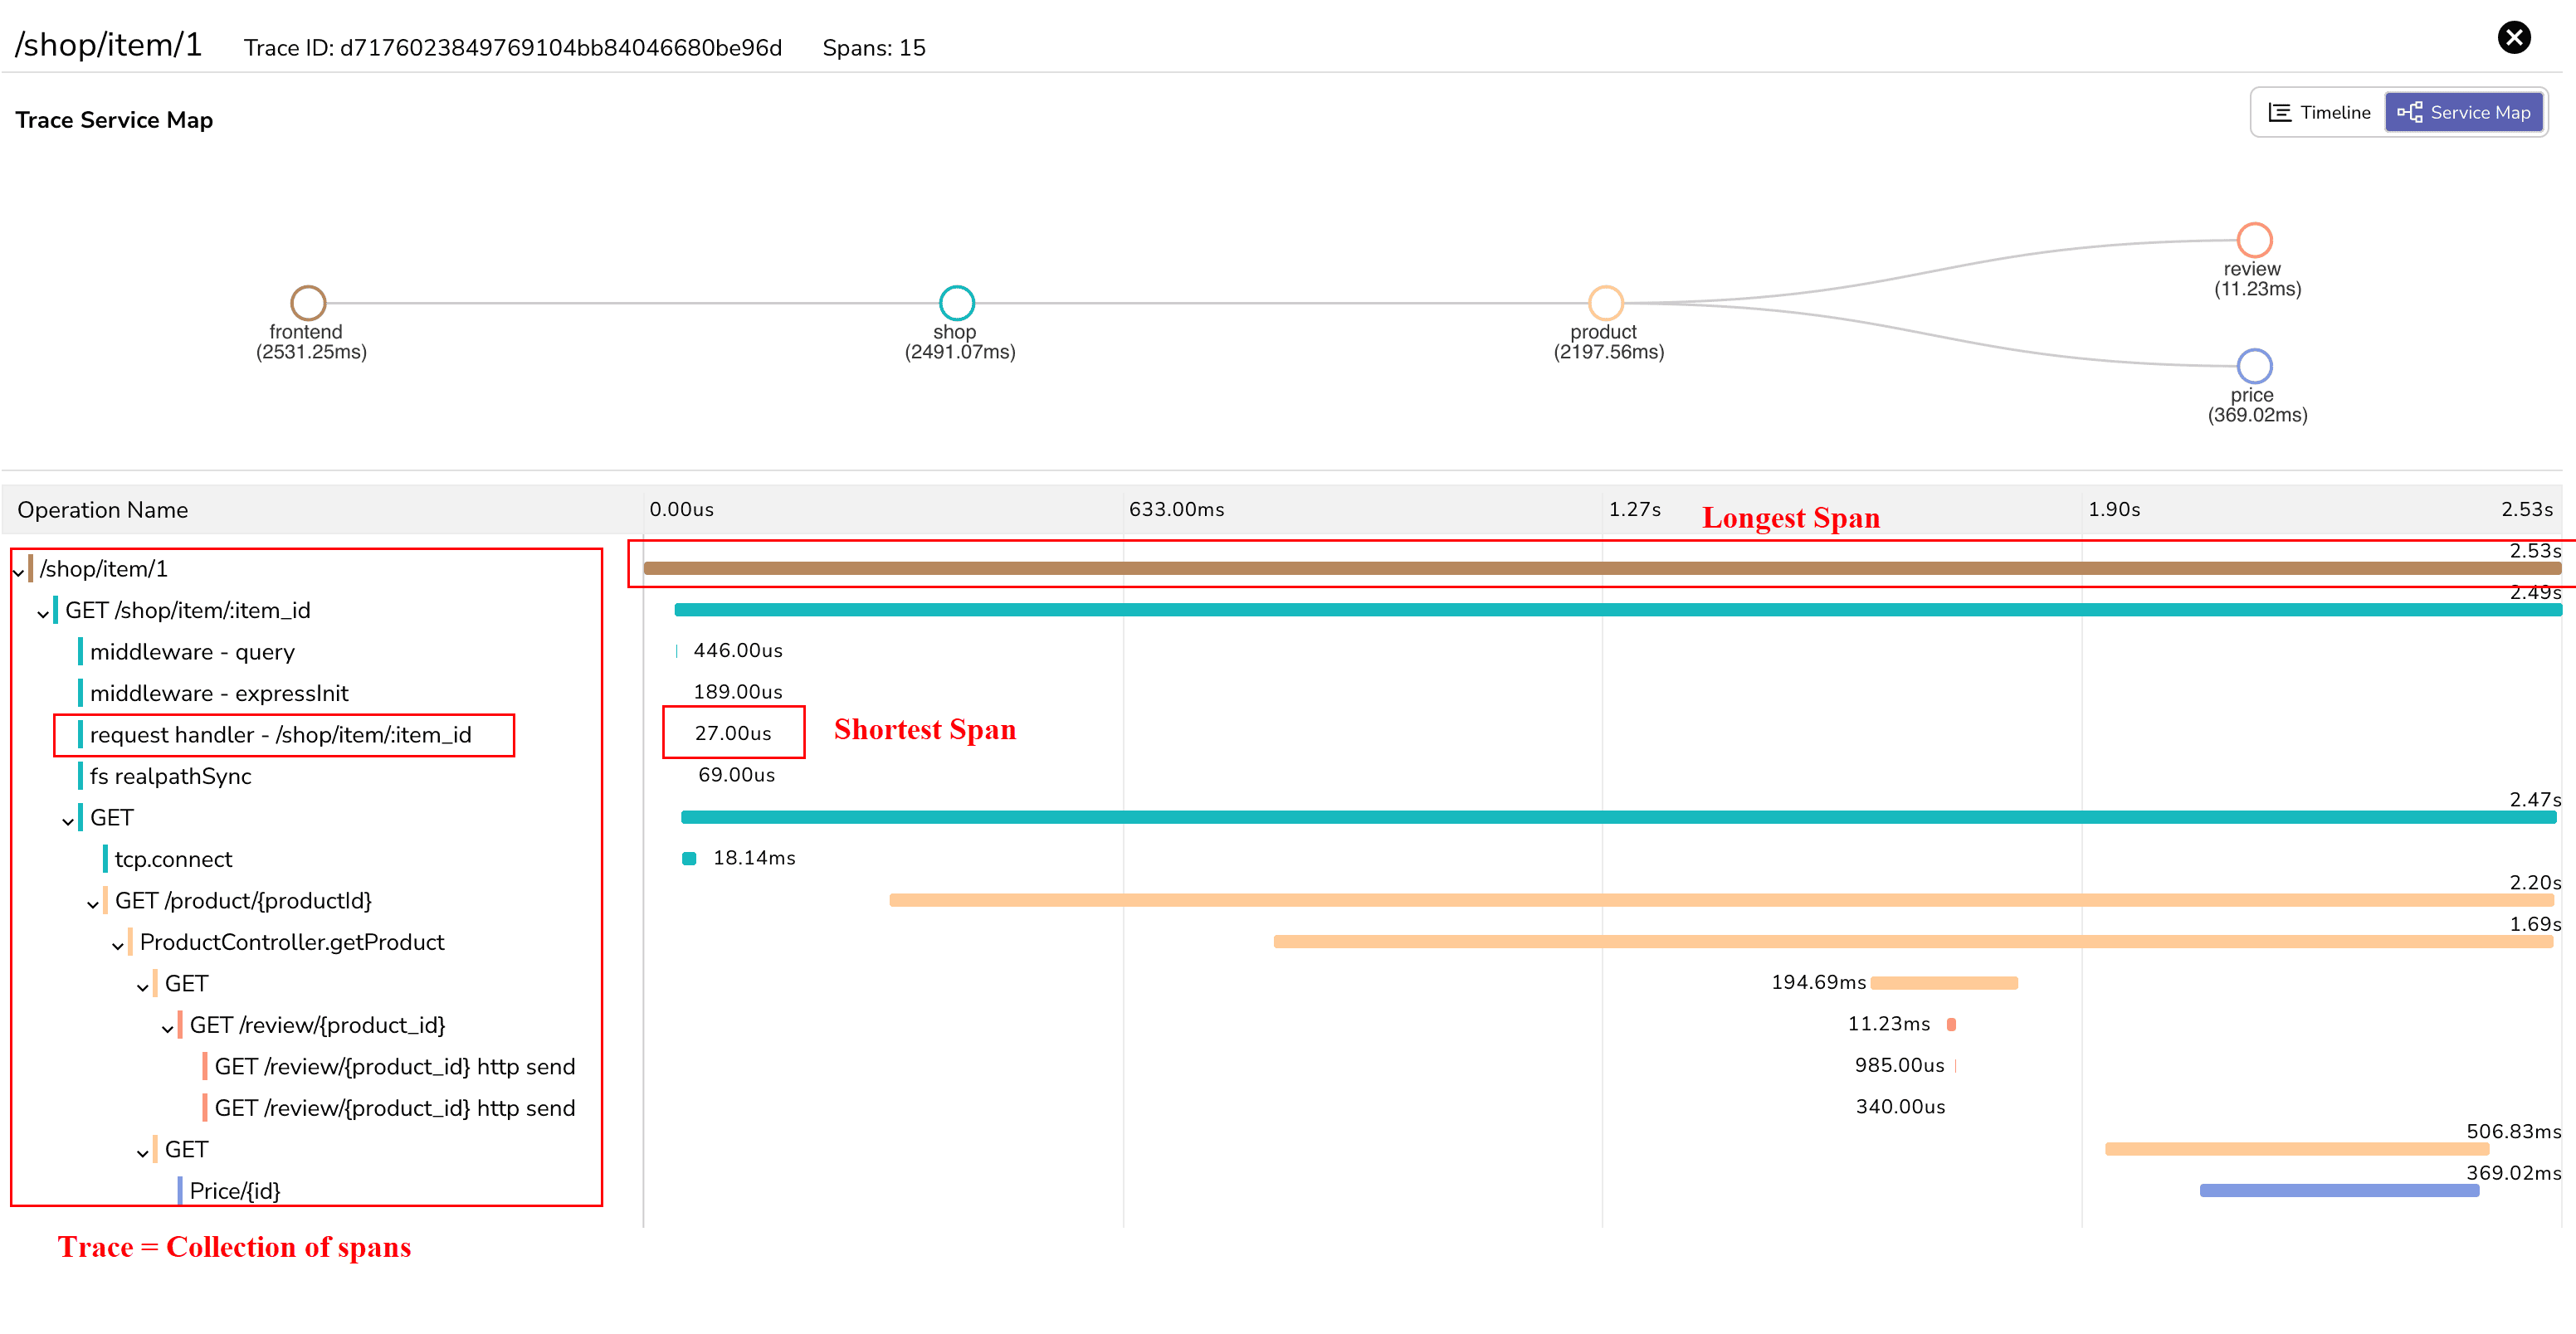
This screenshot is from the HOT Commerce project by OpenObserve, which demonstrates tracing across microservices. For more details, visit the project on GitHub.
In the image above, each line is a span within one trace covering the frontend, shop, product, review, and price services. The frontend span is the longest at 2.53 seconds; the shortest completes in 27 microseconds. Fifteen spans together show exactly where the request spent its time - and where to optimize.
Instrumentation: OpenTelemetry SDKs
Applications are instrumented with OpenTelemetry SDKs, which generate spans and export them over OTLP. Jaeger's own client libraries are archived and should not be used for new work.
Ingestion: Built-in OTLP Receivers
Jaeger v2 receives OTLP directly on port 4317 (gRPC) and 4318 (HTTP). For larger deployments you can still run a separate OpenTelemetry Collector in front for batching, sampling, transformation, and fan-out to multiple backends - Jaeger v2 itself is built from the same Collector framework.
Query Service and UI
Jaeger ships a web UI (port 16686) for searching traces, inspecting span timelines, and visualizing service dependency graphs.
Storage Backend
Jaeger supports pluggable storage - Cassandra, Elasticsearch, OpenSearch, or local/badger storage for single-node setups. Storage is where Jaeger's operational cost concentrates at scale, since trace volume grows with traffic.
Getting Started with Jaeger v2
Here's a quick guide to running Jaeger v2 locally with Docker. For the full reference, see the Jaeger getting started documentation. All commands below were tested against Jaeger v2.20.
Step 1: Deploy Jaeger v2 with Docker
Jaeger's all-in-one configuration combines the collector, query service, and UI in a single container with in-memory storage - ideal for testing and development:
docker run --rm --name jaeger \
  -p 16686:16686 \
  -p 4317:4317 \
  -p 4318:4318 \
  -p 5778:5778 \
  -p 9411:9411 \
  cr.jaegertracing.io/jaegertracing/jaeger:2.20.0
The exposed ports:
- 16686: Jaeger web UI for viewing and searching traces.
- 4317: OTLP gRPC endpoint for trace data.
- 4318: OTLP HTTP endpoint for trace data.
- 5778: Sampling configuration endpoint.
- 9411: Zipkin-compatible endpoint.
Note how much shorter this is than the v1 command - the agent's UDP ports and the legacy collector ports are gone.
Note: In-memory storage is the default and is not suitable for production, since traces vanish on restart.
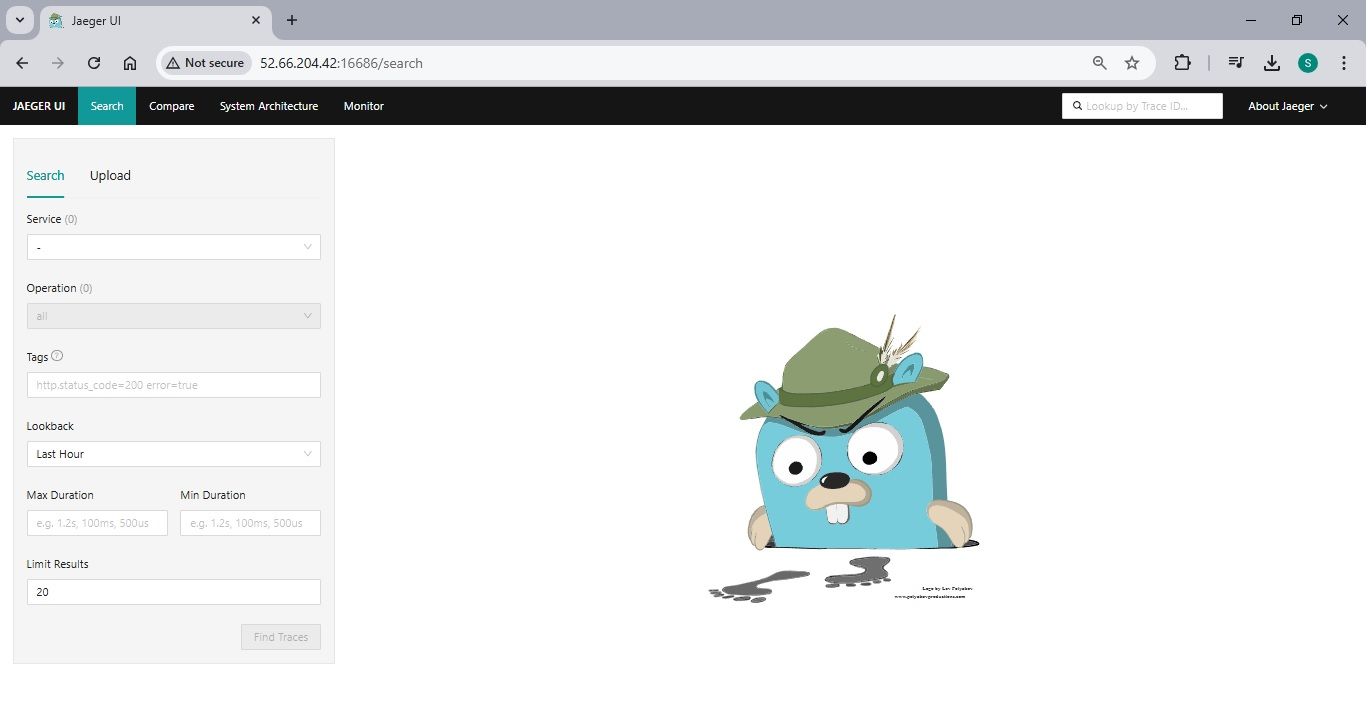
You can access the Jaeger UI at http://localhost:16686 to visualize and interact with collected traces.
Step 2: Run the HotROD Sample Application
HotROD is a microservices demo application simulating a ride-hailing service, similar to Uber or Lyft. Its services (frontend, customer, driver, route) call each other in ways that make it an ideal showcase for distributed tracing.
Run HotROD alongside Jaeger, using a version tag that matches your Jaeger release:
docker run --rm -it --link jaeger \
  -p 8080-8083:8080-8083 \
  -e OTEL_EXPORTER_OTLP_ENDPOINT="http://jaeger:4318" \
  jaegertracing/example-hotrod:2.20.0 all
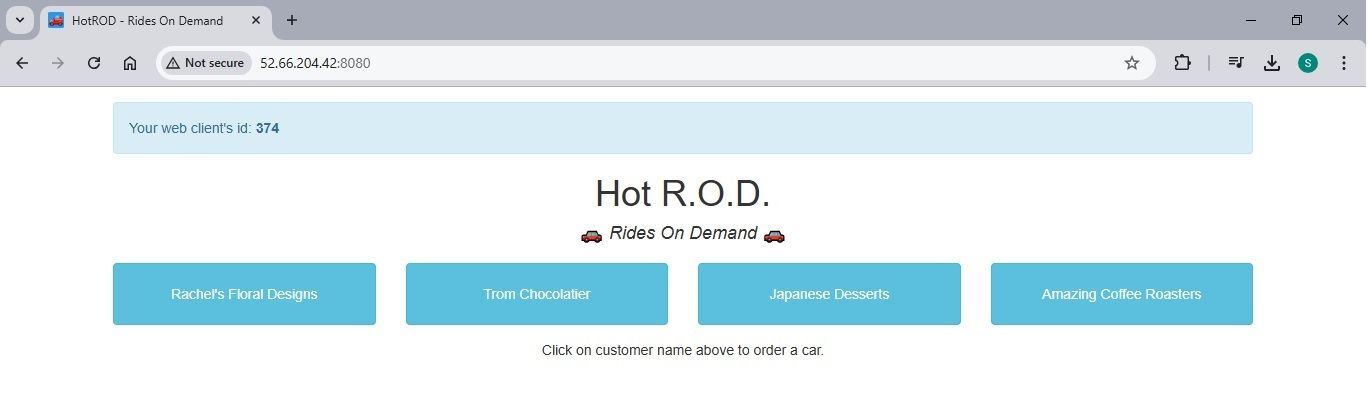
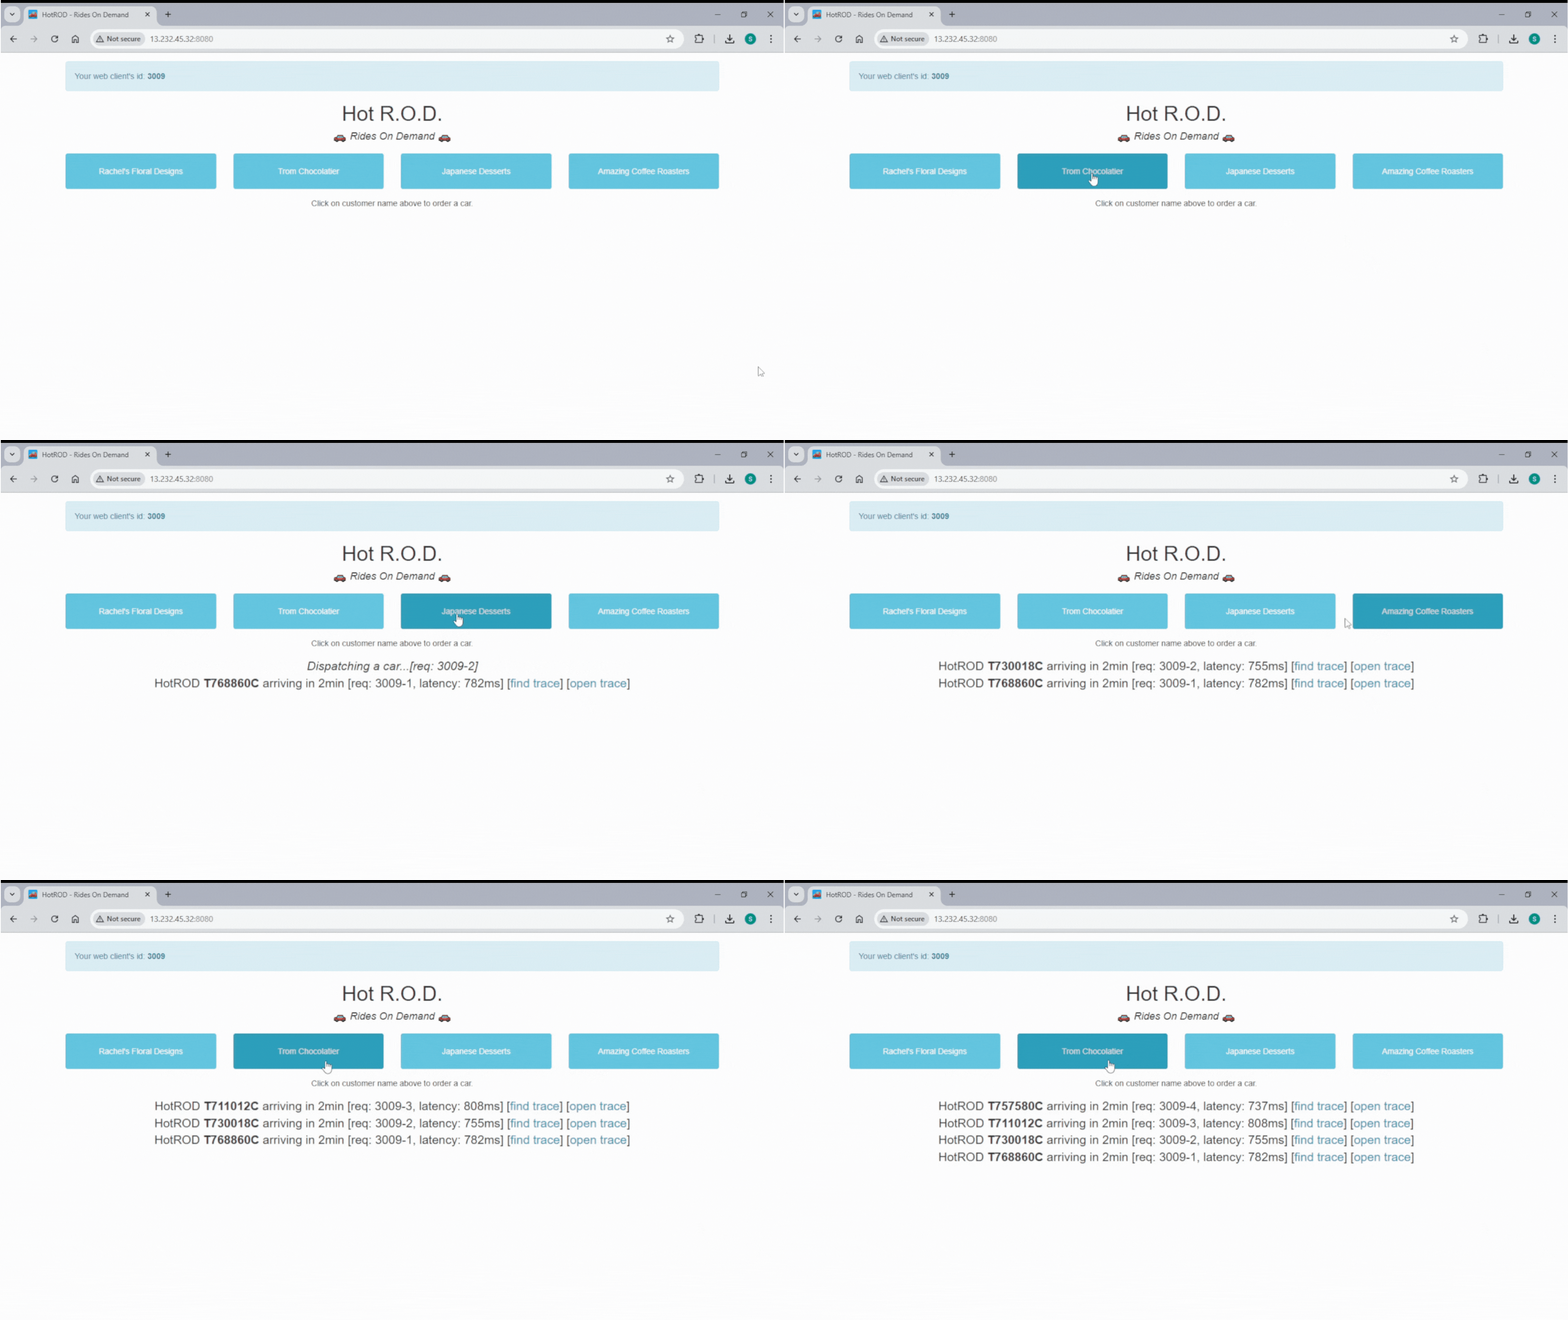
HotROD is instrumented with the OpenTelemetry SDK and exports OTLP over HTTP straight to Jaeger's built-in receiver - no agent, no exporter flags. Open the HotROD UI at http://localhost:8080 and click a few customer buttons to generate traffic.
Step 3: View Traces in the Jaeger UI
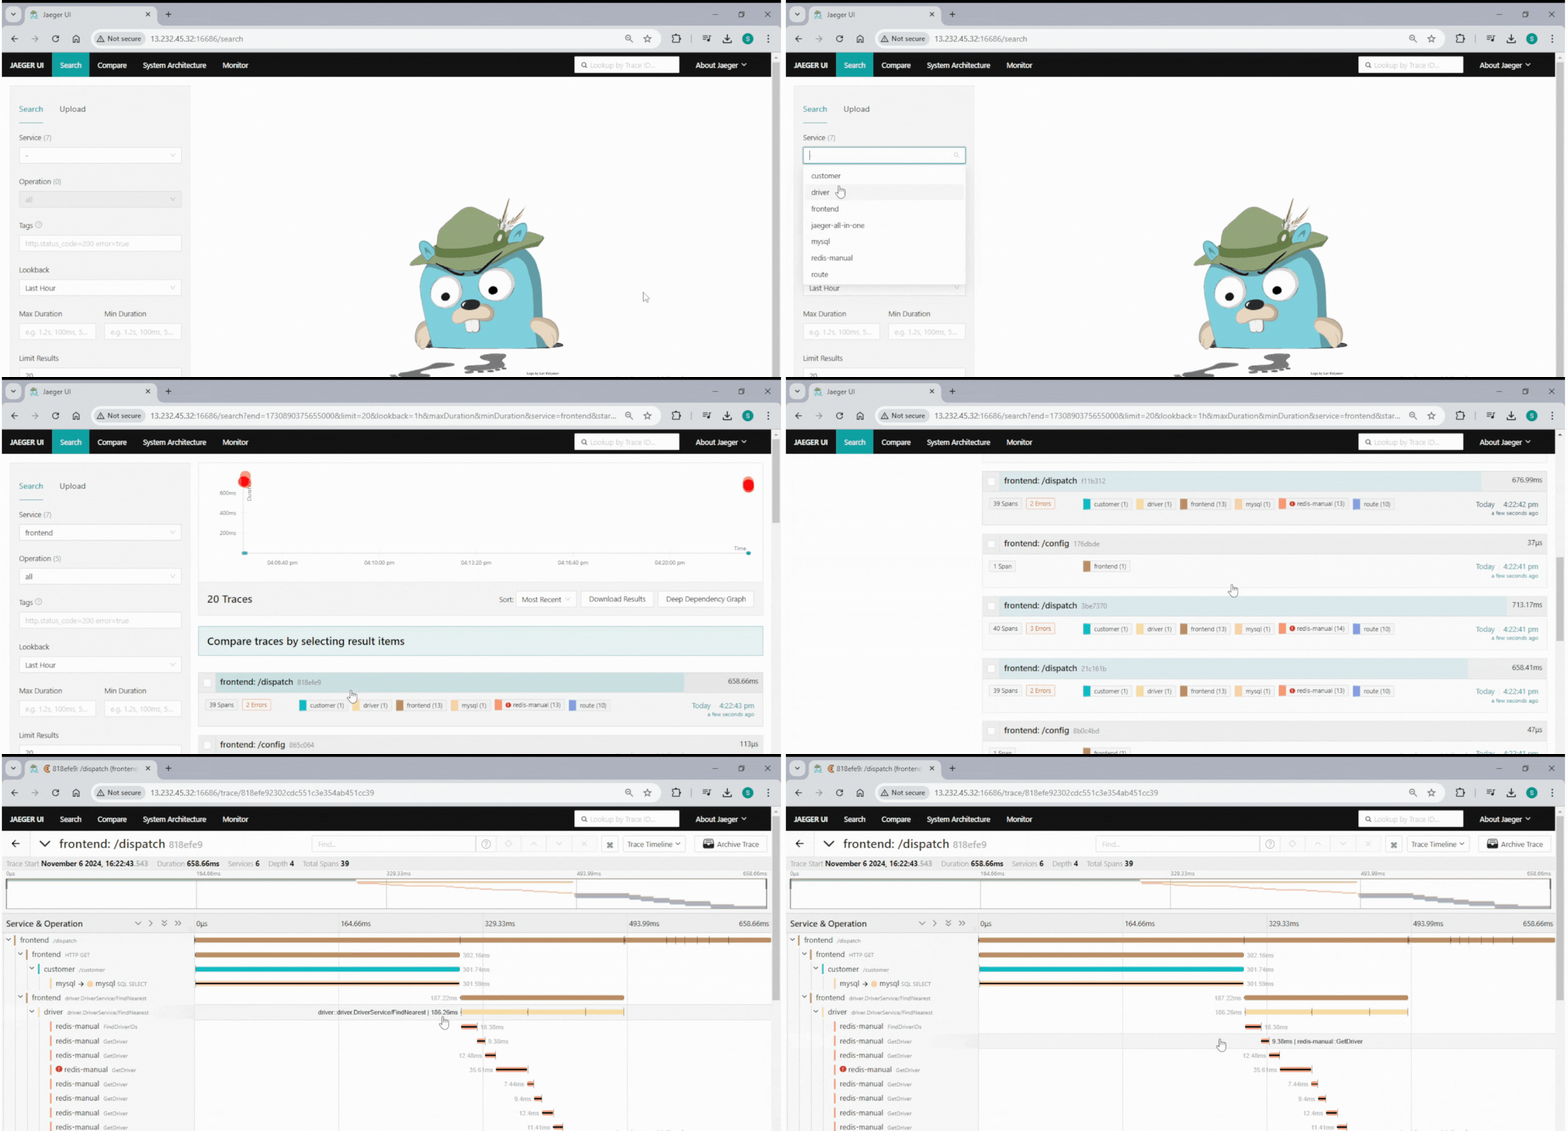
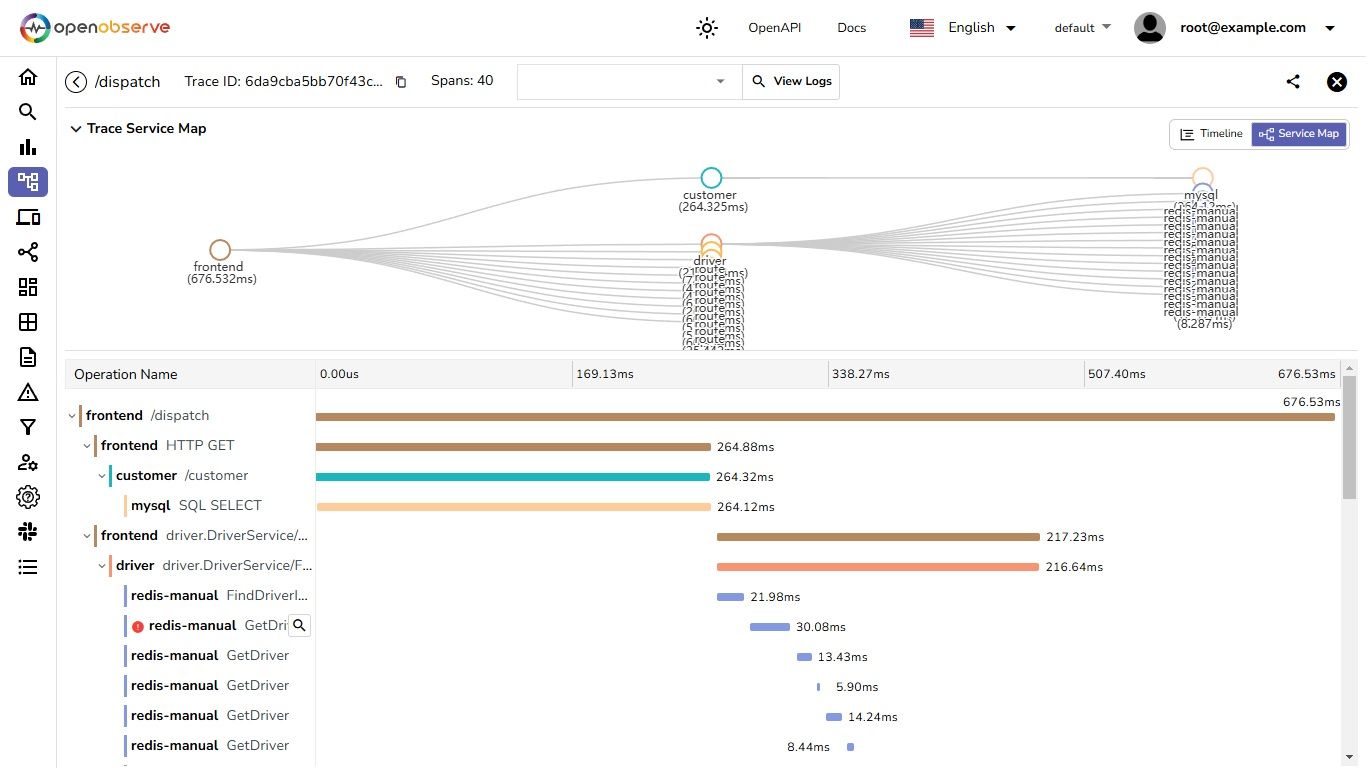
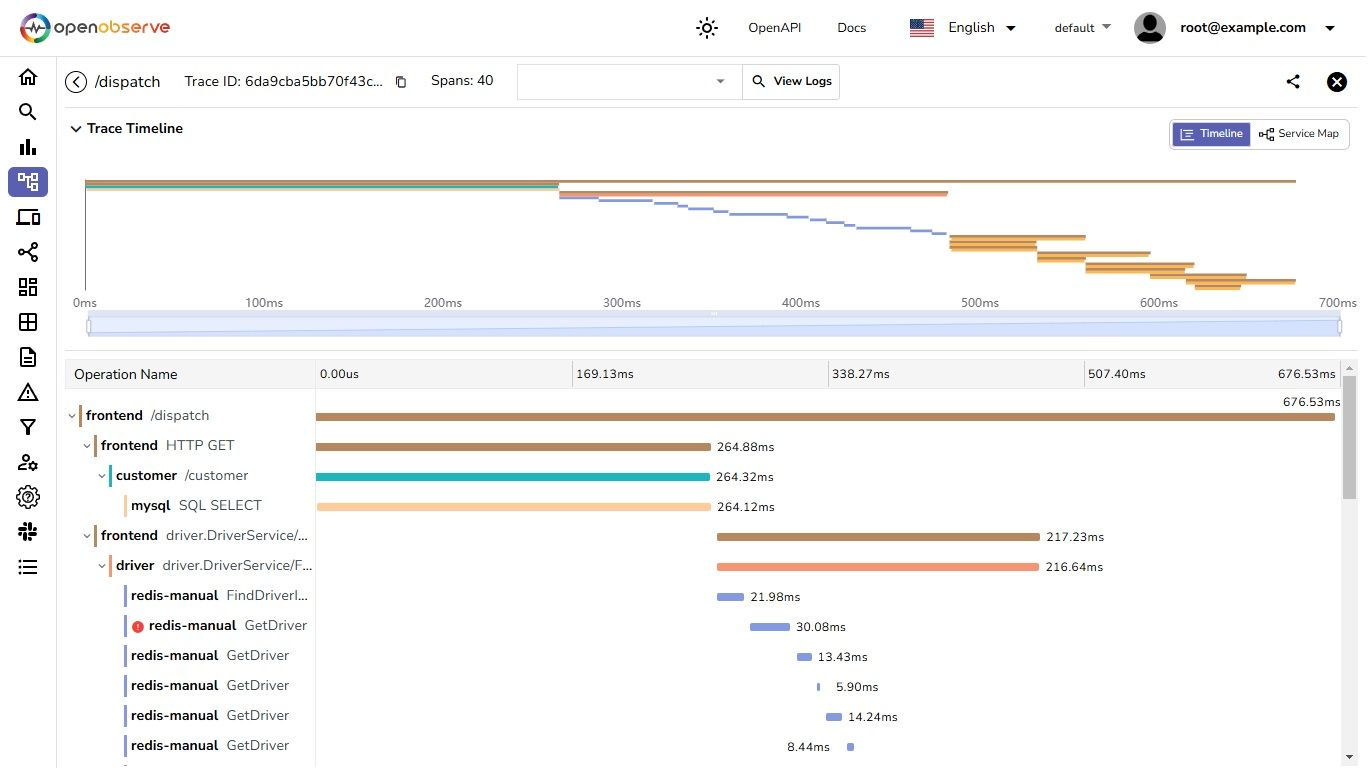
Navigate to http://localhost:16686, select the frontend service, and you can query traces, visualize the flow of requests, and inspect latency and dependency data. In our test run, three HotROD dispatch requests produced traces spanning seven services: frontend, customer, driver, route, redis-manual, mysql, and jaeger itself.
Sending the Same Traces to OpenObserve
Because HotROD speaks plain OTLP, you can point it at any OTLP-compatible backend by changing two environment variables - no code changes, no re-instrumentation. Let's send the same traces to OpenObserve, an open-source (AGPL-3.0) observability platform that stores logs, metrics, and traces together.
Step 1: Deploy OpenObserve with Docker
For the full walkthrough, see the OpenObserve quickstart documentation.
docker run \
    --name openobserve \
    -v $PWD/data:/data \
    -e ZO_DATA_DIR="/data" \
    -p 5080:5080 \
    -e ZO_ROOT_USER_EMAIL="root@example.com" \
    -e ZO_ROOT_USER_PASSWORD="Complexpass#123" \
    public.ecr.aws/zinclabs/openobserve:latest
This starts an OpenObserve container with:
- Persistent storage: Maps the local
$PWD/datadirectory to the container's/datadirectory. - Authentication: Sets the root user email and password for the UI.
- Port exposure: Exposes port 5080 for the web application and OTLP HTTP ingestion.
Access the OpenObserve UI at http://localhost:5080 and log in with the credentials you set above.
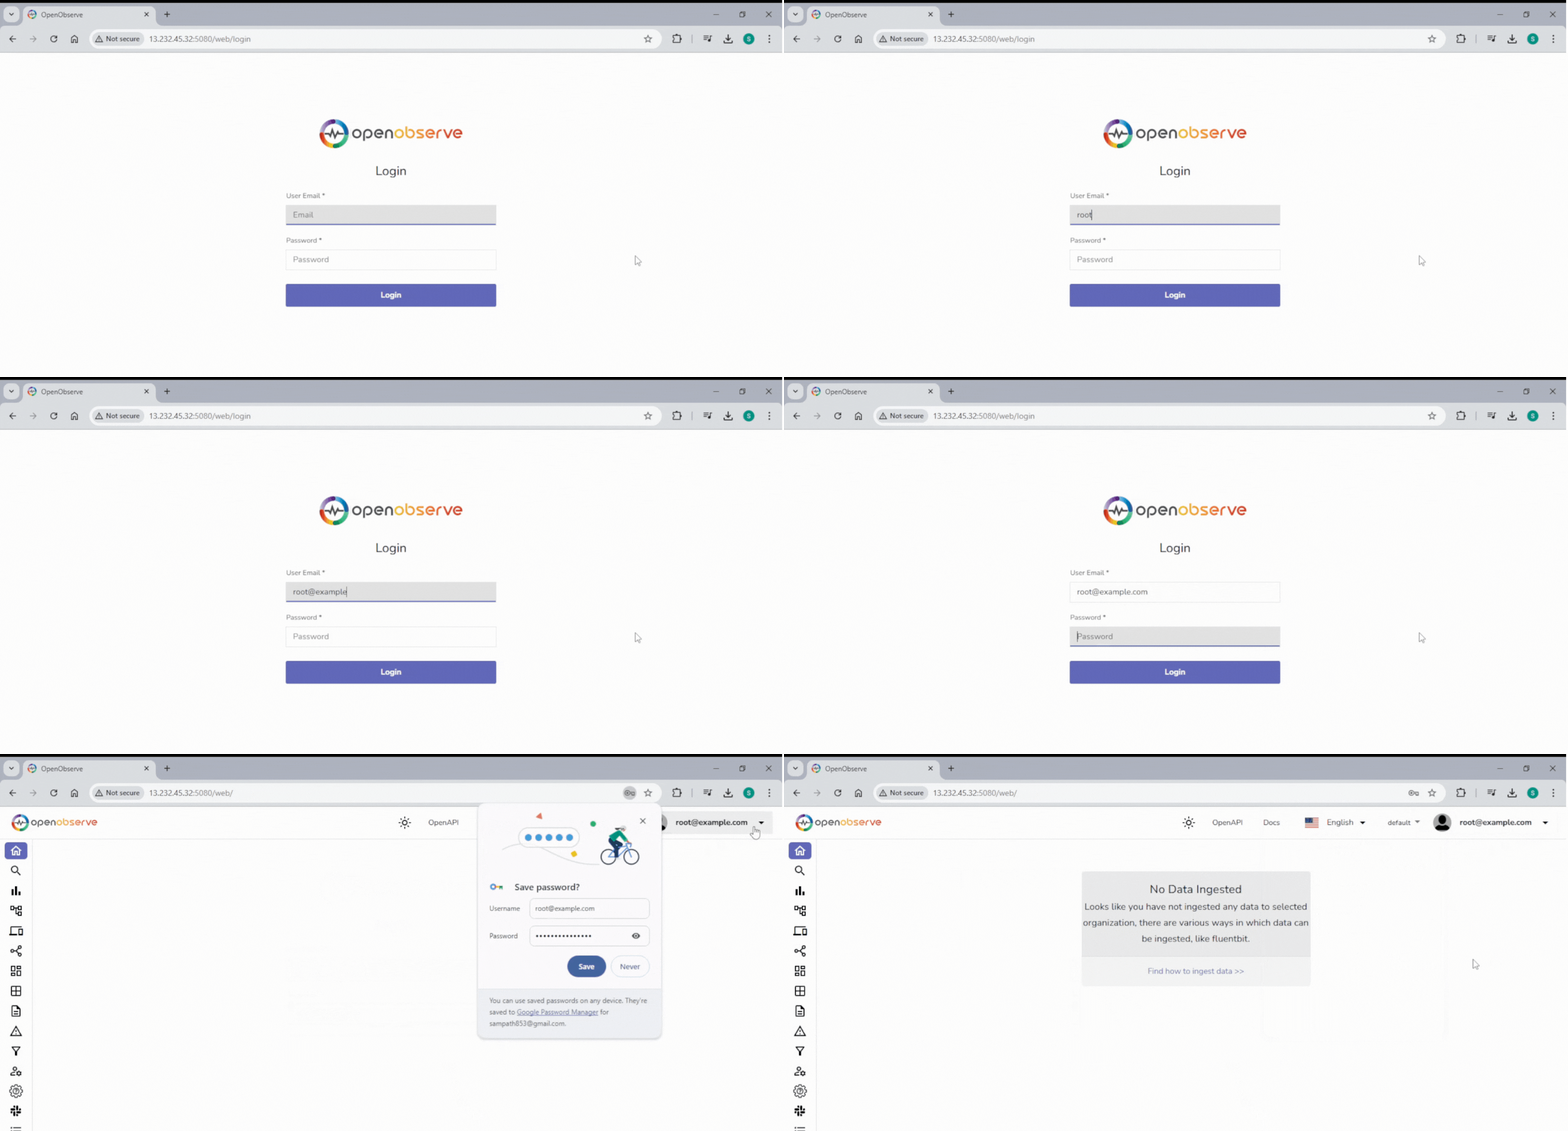
Step 2: Point HotROD at OpenObserve
You can find your OTLP HTTP endpoint and authorization header in the OpenObserve UI under Data Sources → Traces (OpenTelemetry).
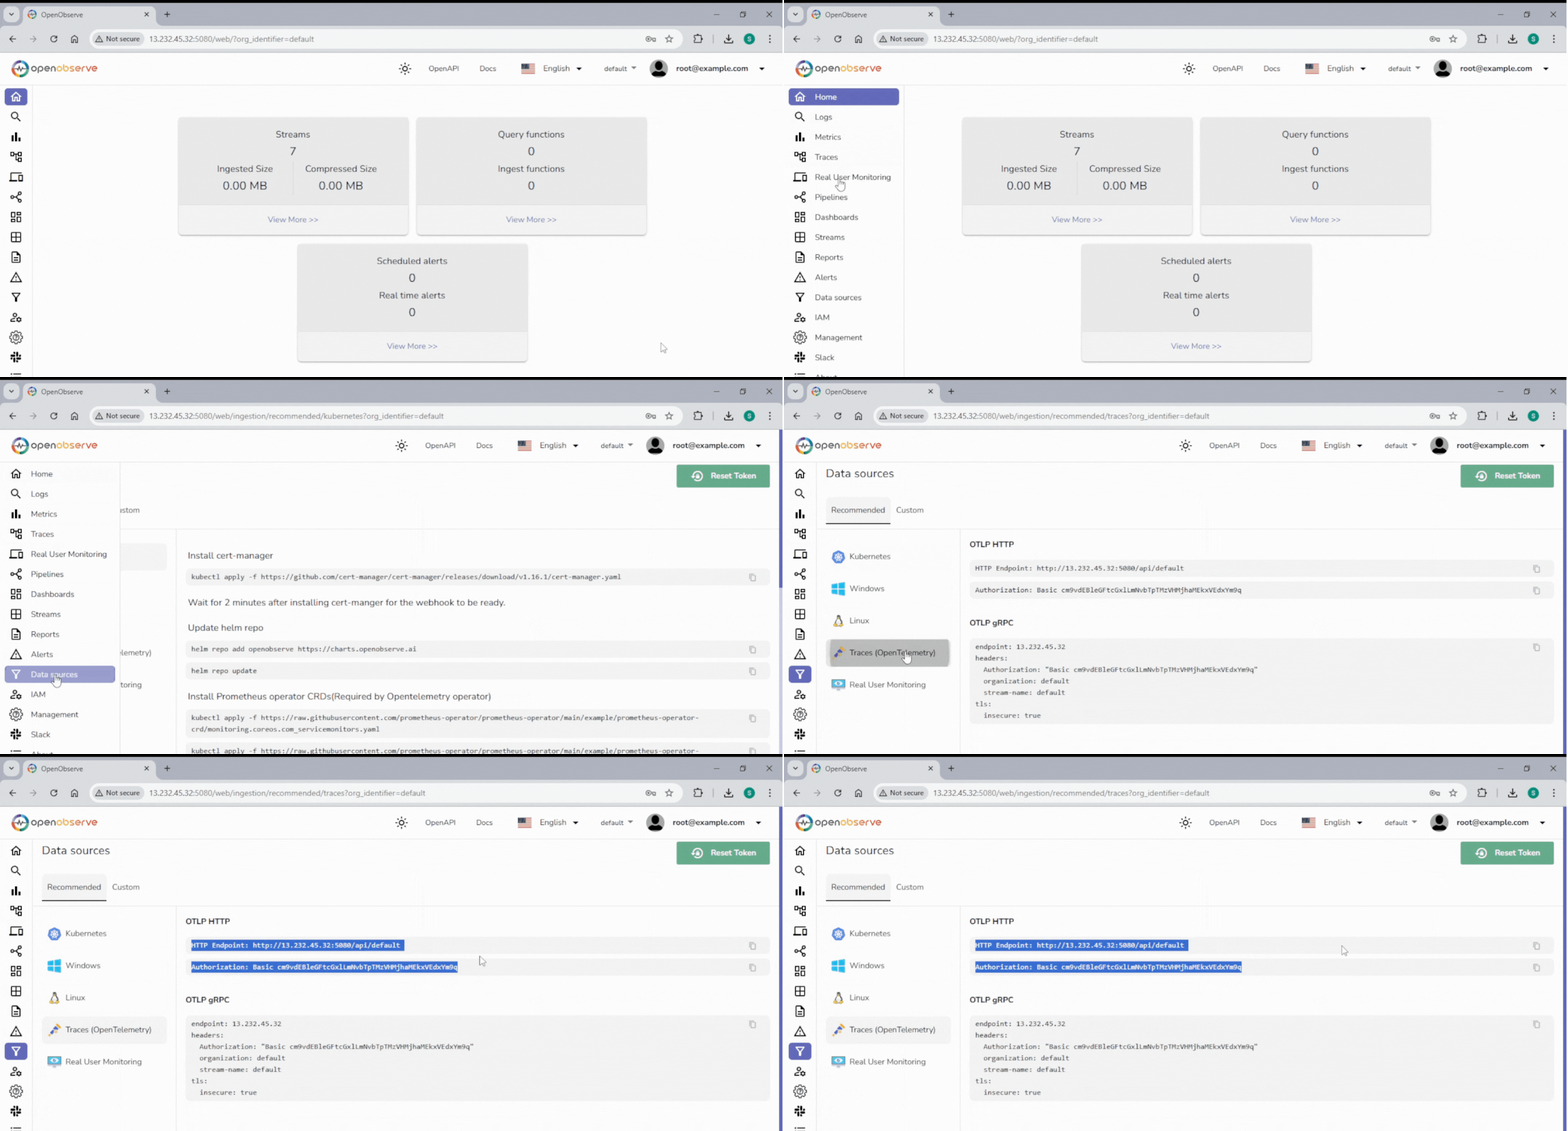
Then run HotROD with the endpoint and auth header set (replace the placeholders with your values - the Basic credential is the base64 encoding of email:password):
docker run --rm -it --link openobserve \
  -p 8080-8083:8080-8083 \
  -e OTEL_EXPORTER_OTLP_ENDPOINT="http://openobserve:5080/api/default" \
  -e OTEL_EXPORTER_OTLP_HEADERS="Authorization=Basic <BASE64_ENCODED_CREDENTIALS>" \
  jaegertracing/example-hotrod:2.20.0 all
This command:
- Runs the HotROD application and links it to your OpenObserve container.
- Sets the OpenTelemetry exporter endpoint to OpenObserve's OTLP HTTP ingestion path for the
defaultorganization. - Adds the Basic auth header OpenObserve requires for ingestion.
- Maps ports 8080–8083 for accessing the HotROD services.
That's the whole migration: same application, same instrumentation, different backend. This is the payoff of the OpenTelemetry-native world Jaeger v2 itself embraced.
Step 3: View Traces in the OpenObserve UI
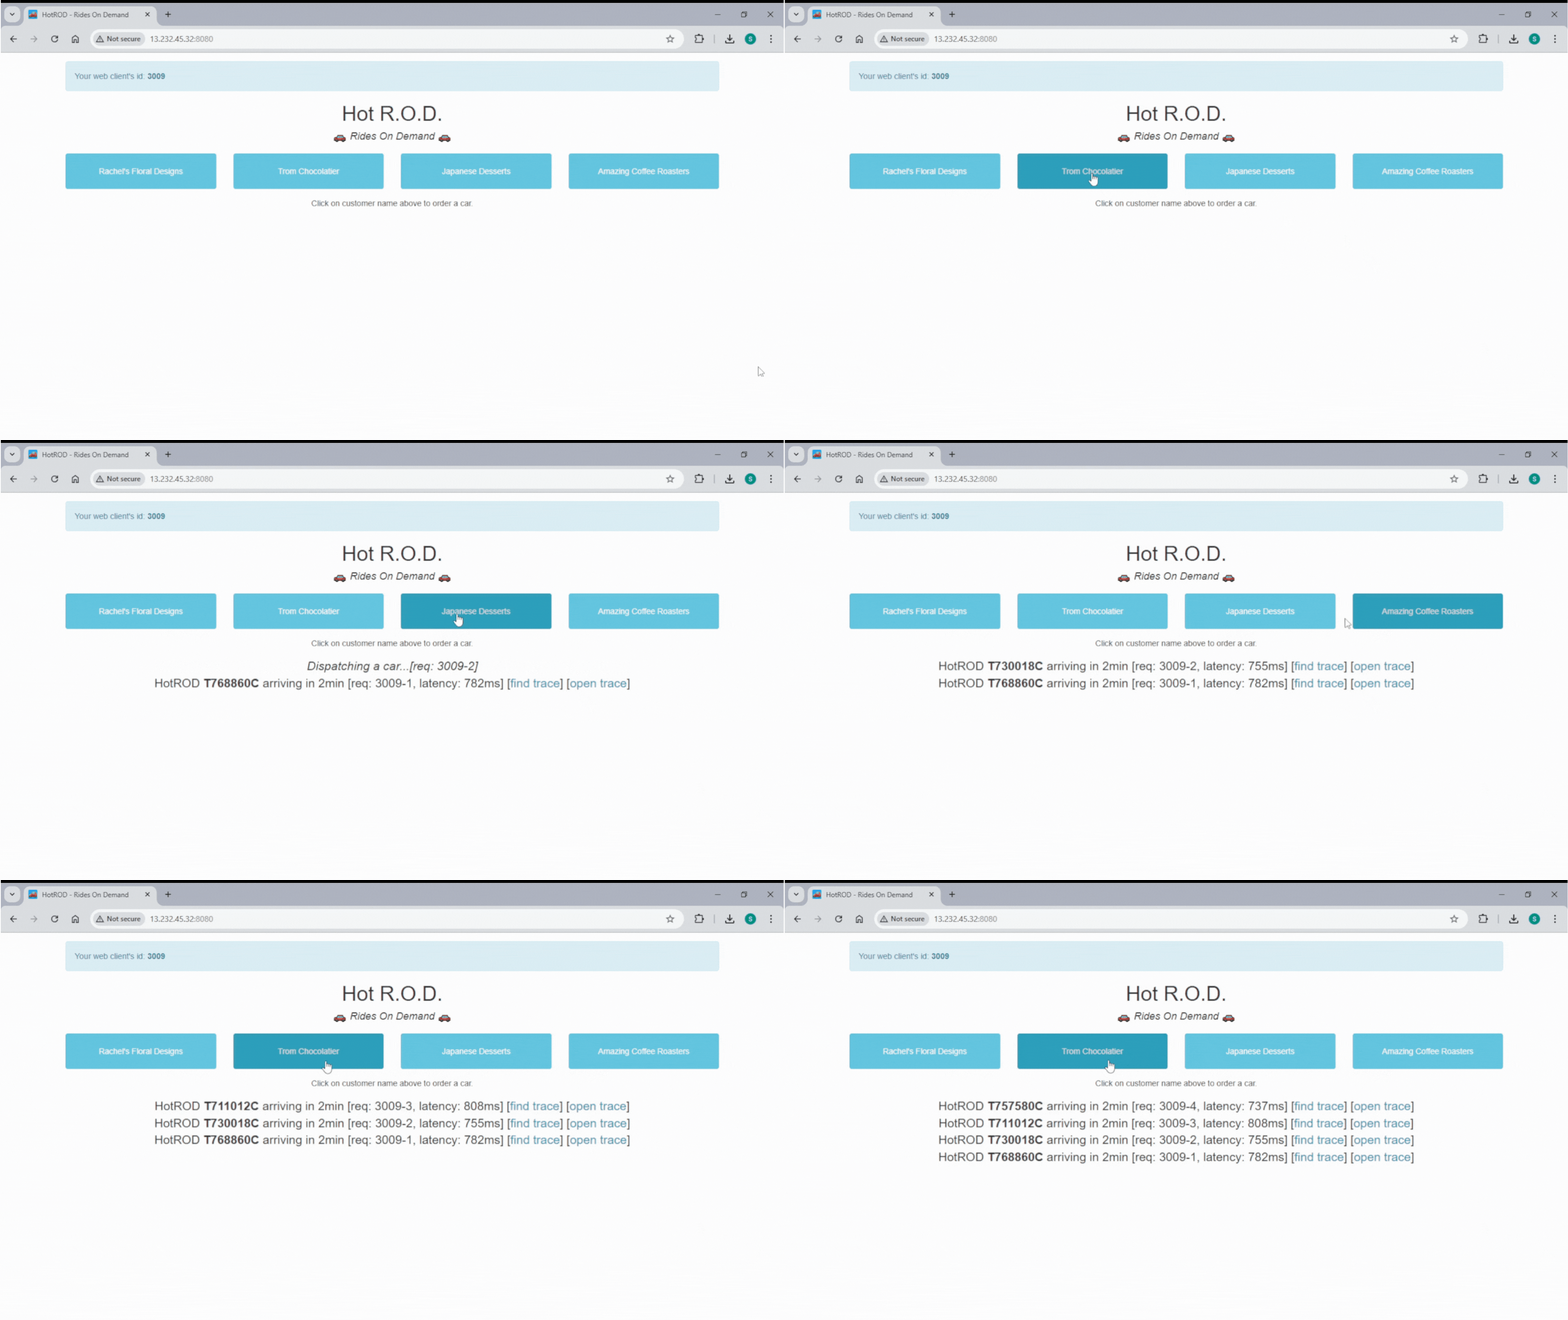
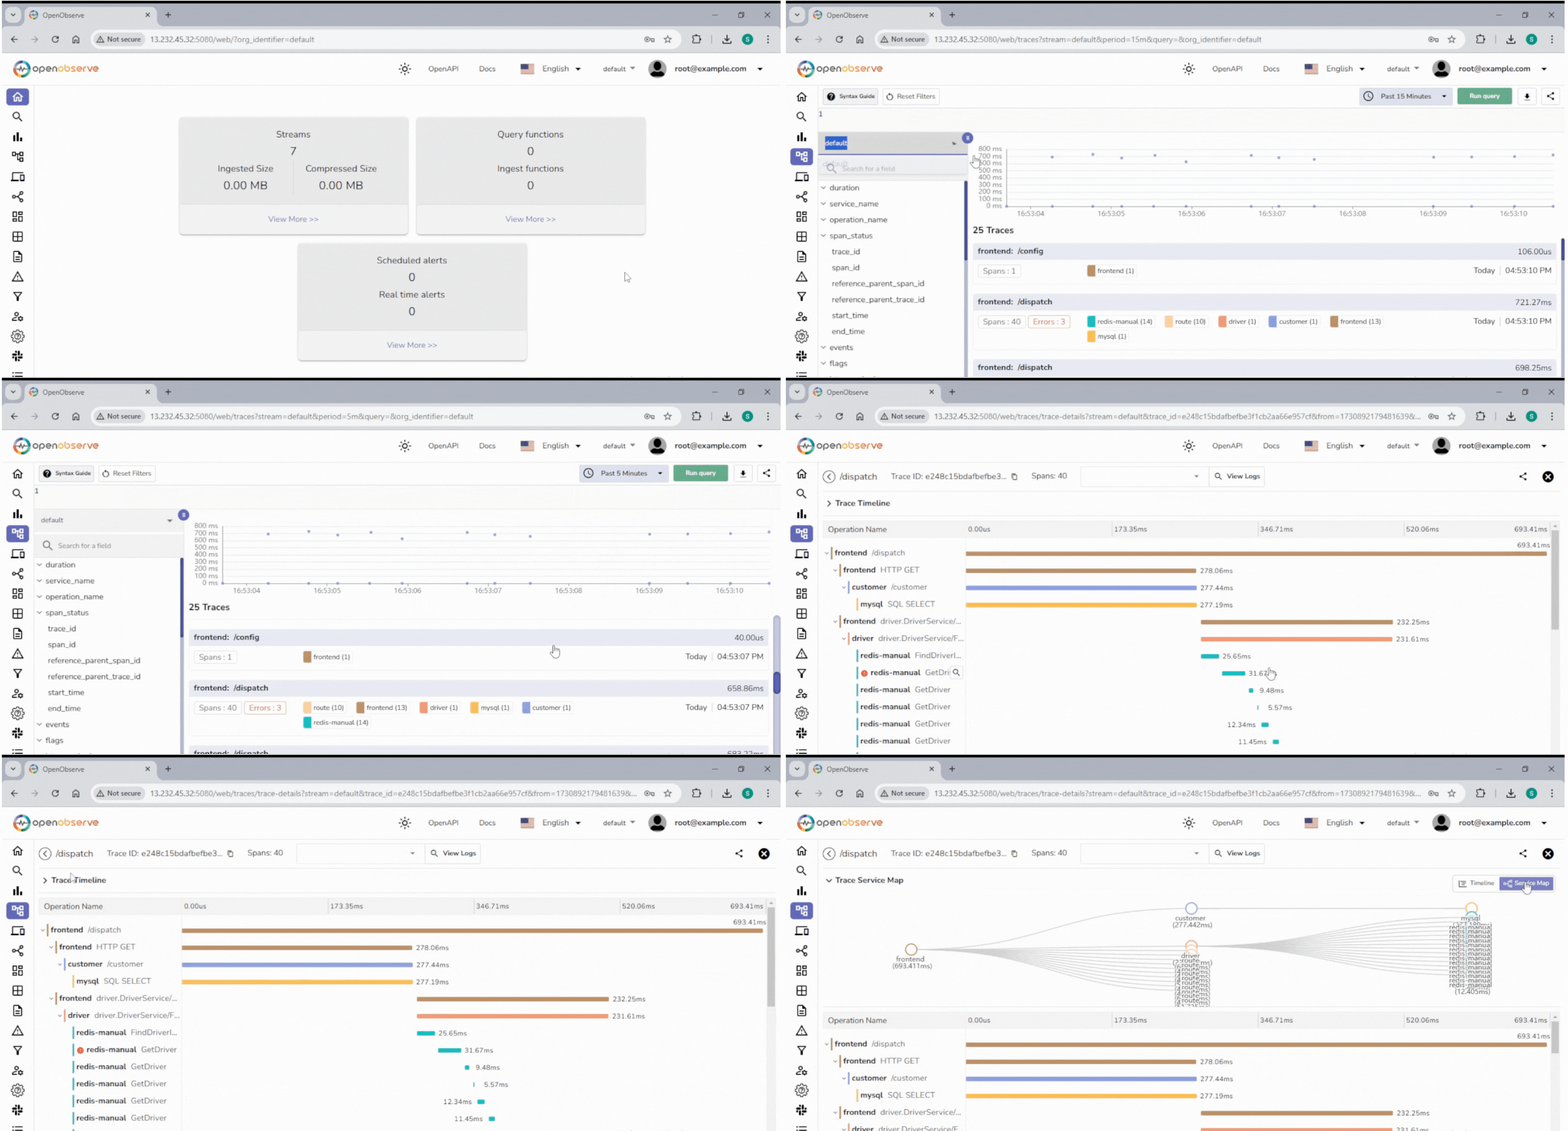
Generate a few requests in the HotROD UI at http://localhost:8080, then open the Traces page in OpenObserve at http://localhost:5080.
Jaeger vs. OpenObserve: Which Should You Use?
Jaeger v2 is an excellent dedicated tracing backend. The comparison that matters is scope and operational cost:
| Dimension | Jaeger v2 | OpenObserve |
|---|---|---|
| Scope | Traces only - logs and metrics live in separate systems | Logs, metrics, and traces in one platform, correlated out of the box |
| Storage | Bring and operate your own backend (Cassandra, Elasticsearch, OpenSearch) | Built-in columnar storage on local disk or object storage (S3, GCS, Azure Blob) |
| Querying | Trace search and timeline UI | Trace UI plus full SQL over spans for aggregation and analysis |
| Cost at scale | Storage backend costs grow quickly with trace volume, often forcing heavy sampling | Columnar storage and object-store economics make 100% trace ingestion practical |
| License | Apache 2.0, CNCF graduated | Open source, AGPL-3.0, self-hosted or cloud |
The honest summary: if you only need tracing and already run logging and metrics stacks you're happy with, Jaeger v2 is a solid, focused choice. If you're assembling an observability stack in 2026 - or hitting storage cost walls with Jaeger at scale - a unified platform removes both the correlation gap and an entire storage system you'd otherwise operate.
Real-World Case Study: Jidu's Journey to 100% Tracing Fidelity
To see the scale difference in practice, read about Jidu's journey to 100% tracing fidelity. Running Jaeger with an Elasticsearch backend, Jidu could only afford to ingest 10% of the traces their applications generated (of roughly 10 TB per day) - and performance was poor for what the infrastructure cost. After moving to OpenObserve they ingested 100% of traces on the same hardware, with lower storage costs, and eventually scaled to 100 TB of traces per day.
Their experience is a useful benchmark for anyone evaluating what tracing at scale actually costs with a search-index storage backend versus a columnar one.
Conclusion
Jaeger remains one of the best ways to learn and run distributed tracing, and v2 made it dramatically simpler: OpenTelemetry SDKs in, OTLP everywhere, no agent to babysit. If you're on Jaeger v1, migrate - it stopped receiving updates at the end of 2025.
The same OpenTelemetry foundation that modernized Jaeger also means you're never locked into it. As you saw above, redirecting OTLP traffic to OpenObserve took two environment variables - and bought SQL over spans, unified logs/metrics/traces, and storage economics that let teams like Jidu keep every trace instead of sampling away 90% of them.
Ready to try it? Get started with OpenObserve in under two minutes, or explore more options in our guide to distributed tracing tools.
Frequently Asked Questions
About the Author
Sampath Siva Kumar Boddeti

Sampath is a Developer Advocate at OpenObserve with a background in DevOps and Cloud, passionate about Observability and Open Source technologies
Follow OpenObserve on Google
Add OpenObserve as a preferred source to see more of our articles in Google Search and Top Stories.