AWS Monitoring
Gain deep insights into your cloud infrastructure performance, troubleshoot issues efficiently, and optimize your operations.

Why OpenObserve for AWS Monitoring?
Deep AWS Observability
Gain deep visibility into the many layers of your AWS environment for faster troubleshooting and proactive issue prevention.
Telemetry Cost Optimization
Reduce monitoring costs significantly with efficient data ingestion and storage while maintaining comprehensive AWS observability.
Almost Too-easy Integration
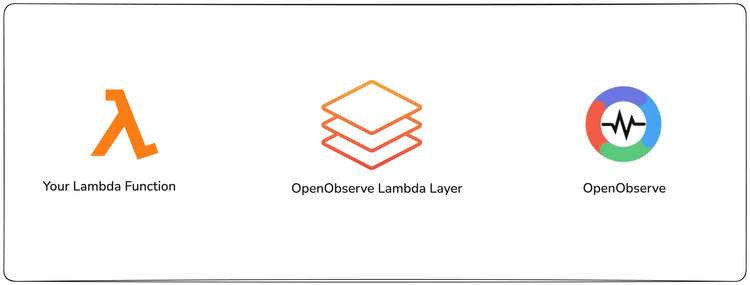
Easy setup with AWS services using Kinesis Data Firehose and CloudWatch for efficient log and metric collection.
OpenObserve’s Key AWS Monitoring Capabilities
Real-Time Visibility & Insights
Continuous Data Collection
Capture every AWS operation as it happens through seamless Kinesis Data Firehose and CloudWatch integrations. Monitor your entire AWS ecosystem with zero blind spots from Lambda functions to database clusters.
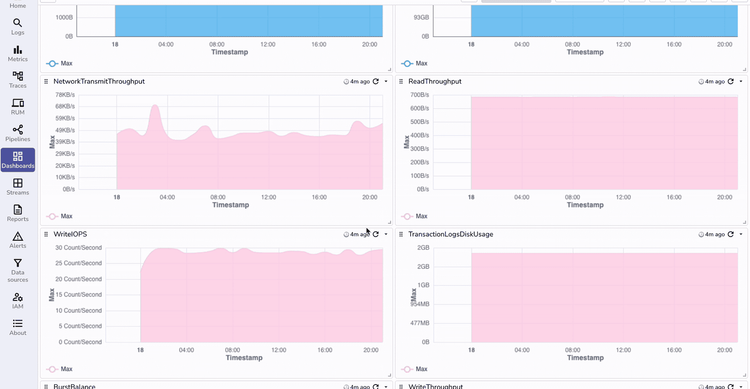
Rich Interactive Dashboards
Transform complex AWS metrics into instant understanding with pre-built and customizable visualizations. Spot trends, identify anomalies, and make decisions with confidence using real-time, interactive dashboards.
AWS Monitoring FAQs
Latest From Our Blogs


Ready to get started?
Try OpenObserve today for more efficient and performant observability.