Database Monitoring
Optimize database operations with real-time insights that reduce costs and ensure peak performance.

Why use OpenObserve for Database Monitoring?
Unified Insights
See all your databases in a single pane of glass. Track performance, health metrics, and capacity.
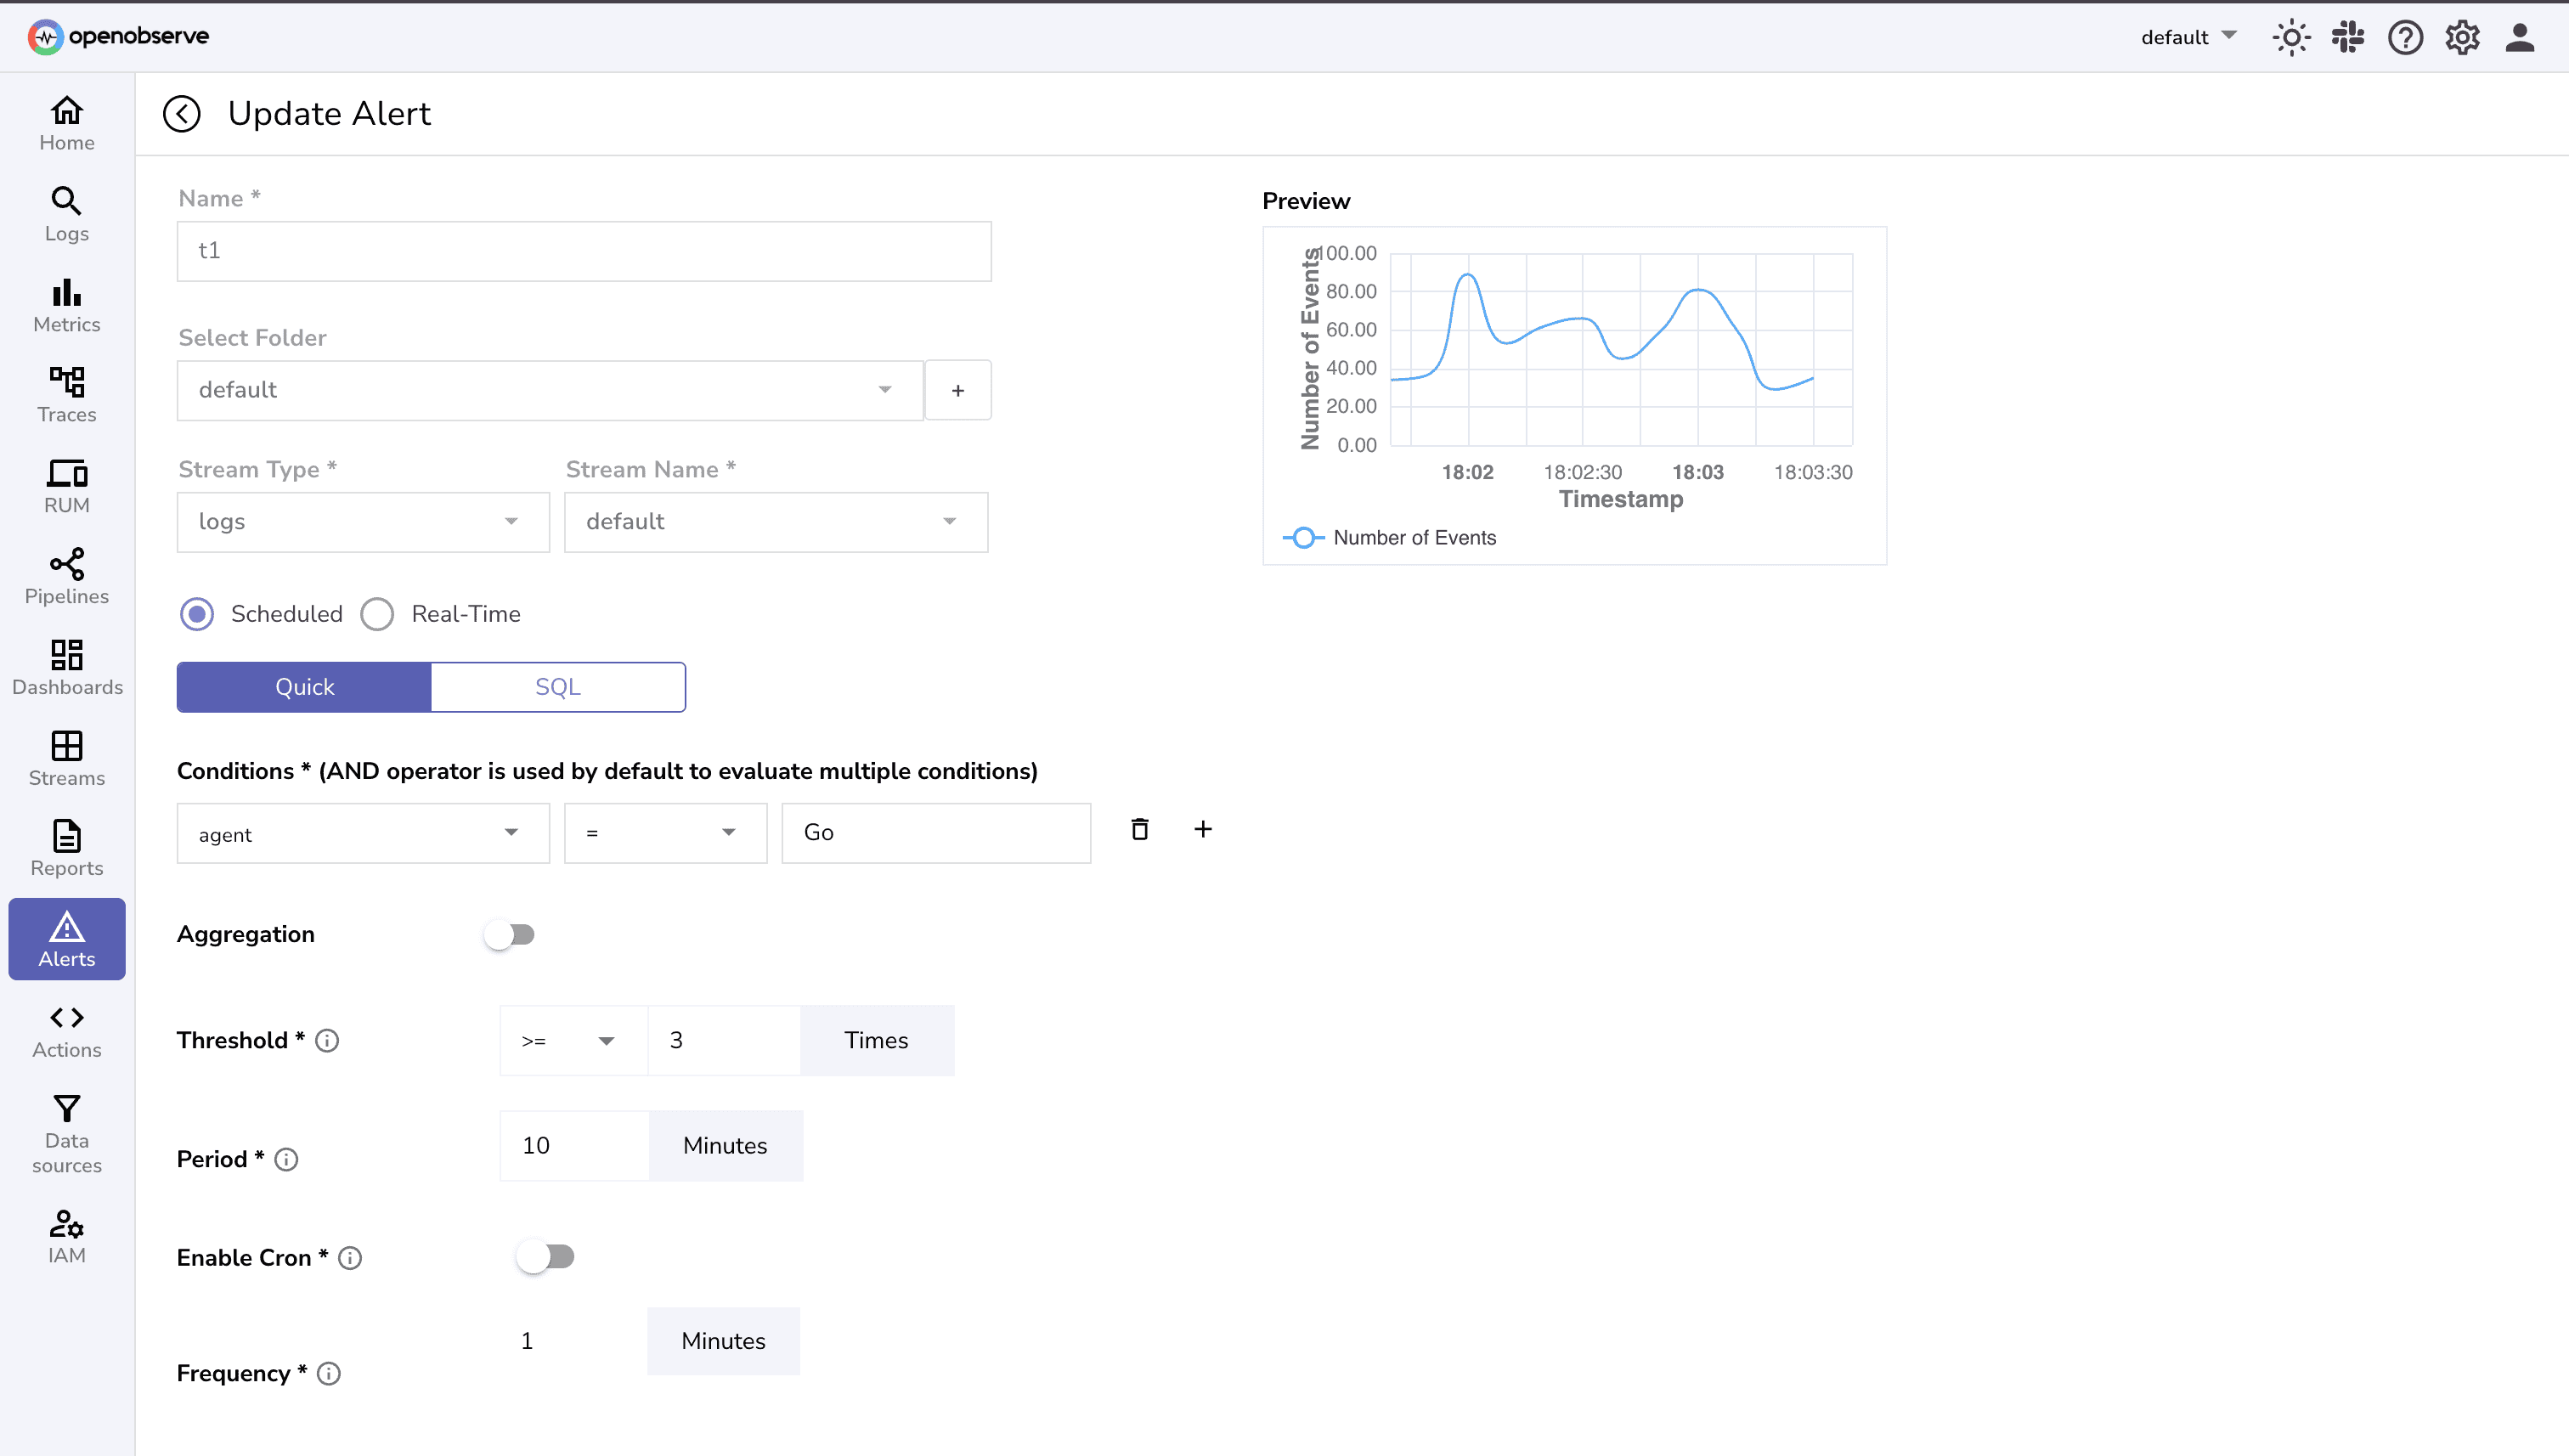
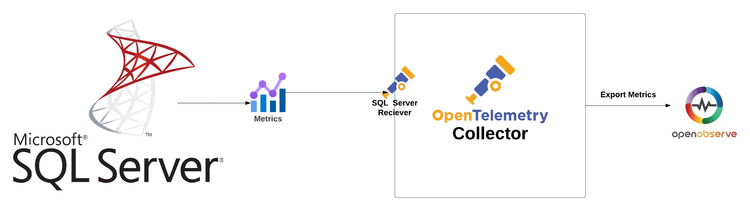
Key Metrics Collection
Capture critical database metrics, from query response times to resource utilization patterns, with minimal overhead.
Proactive Performance Visibility
Spot issues before they impact users with dynamic dashboards and instant alerts that keep your databases performing at their peak.
OpenObserve’s Key Database Monitoring Capabilities
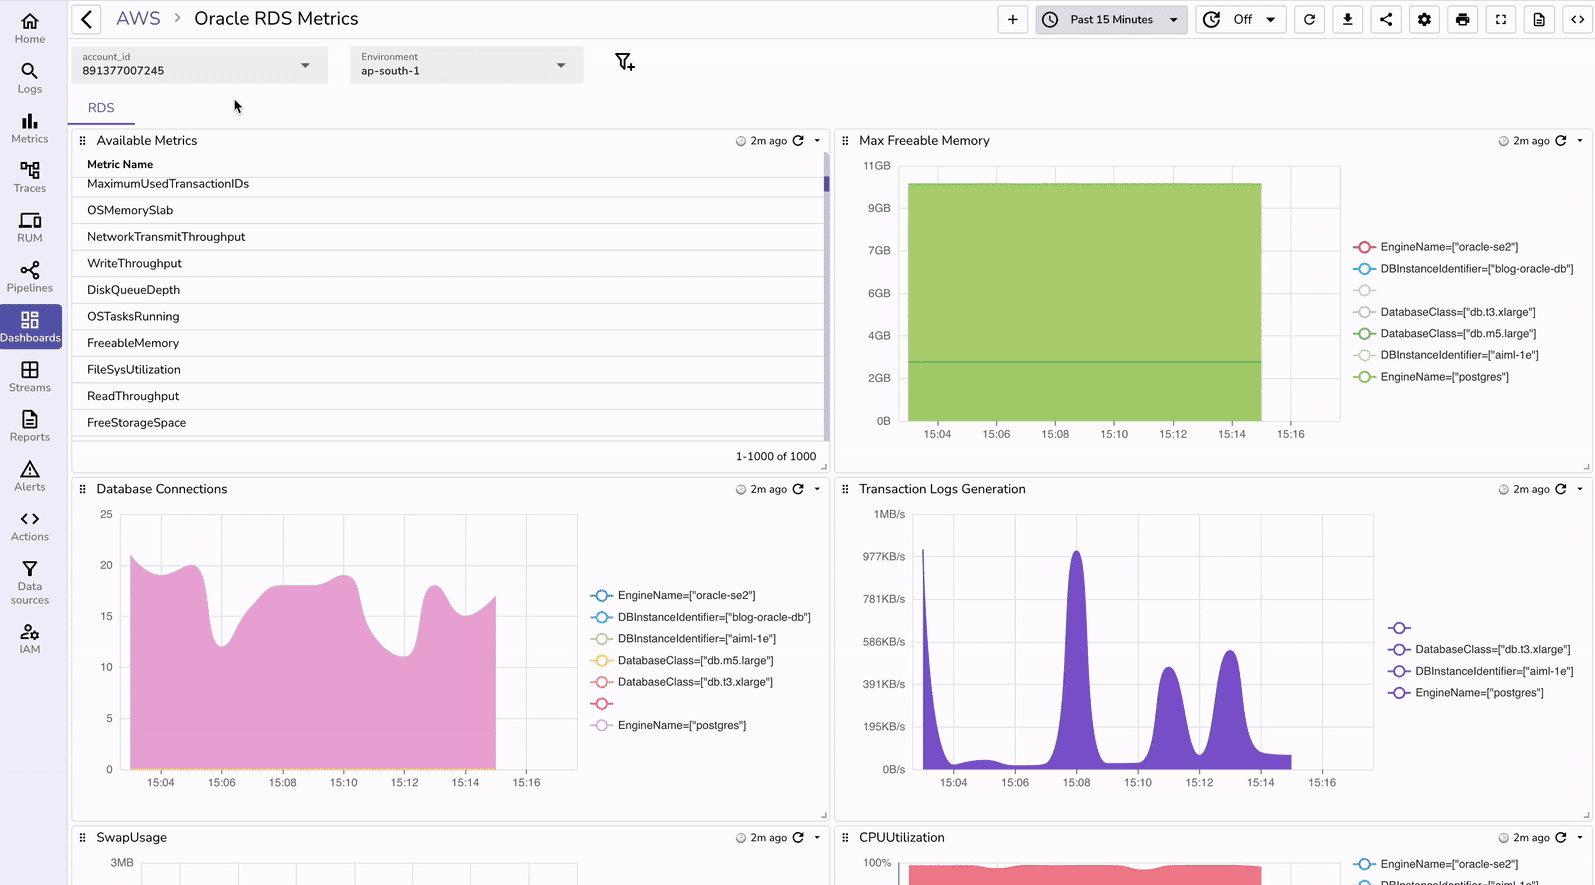
Performance Monitoring
Workload and Resource Insights
Monitor request volumes across users and applications while tracking hardware and software resource utilization. Understand database workload patterns to optimize resource allocation.
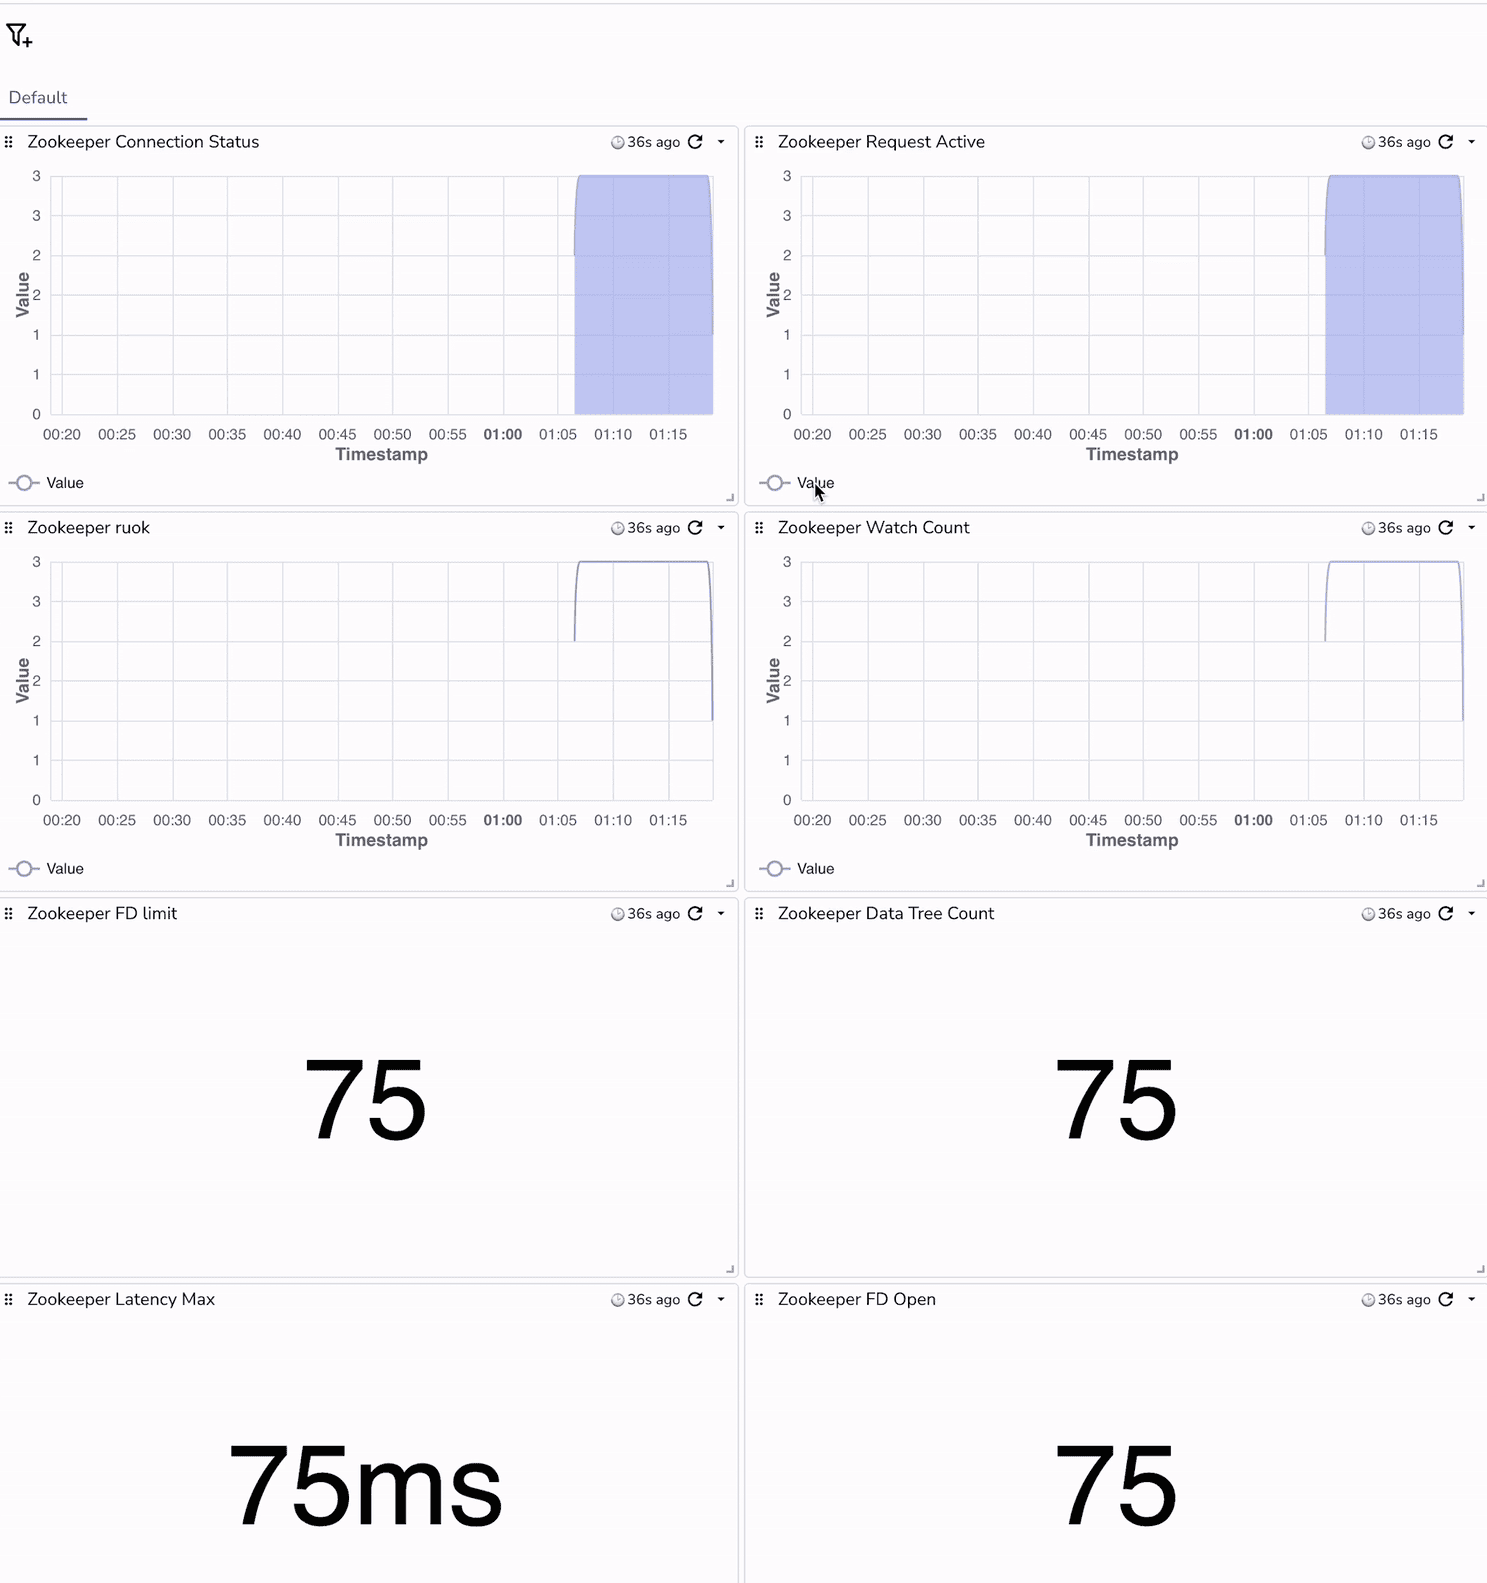
Throughput and Optimization Analytics
Analyze database performance metrics to identify bottlenecks and optimization opportunities. Improve query efficiency and overall database performance.

Database Monitoring FAQs
Latest From Our Blogs


Ready to get started?
Try OpenObserve today for more efficient and performant observability.