Monitor Your MySQL Database Metrics with OpenTelemetry and OpenObserve

Manas Sharma
December 30, 2024
7 min read
Don’t forget to share!
Getting Started with OpenObserve
Try OpenObserve Cloud today for more efficient and performant observability.
Are you looking to optimize your MySQL database monitoring without juggling multiple tools? In this blog post, we’ll guide you through leveraging OpenTelemetry and OpenObserve to effectively monitor MySQL metrics. By utilizing the MySQL receiver of the OpenTelemetry Collector, you can scrape metrics seamlessly and push them to OpenObserve that will allow us to capture the metrics, build dashboards and generate alerts.
MySQL is one of the most popular relational database management systems (RDBMS) in the world, renowned for its reliability, flexibility, and ease of use. It supports a wide range of applications, from small projects to large-scale enterprise solutions. MySQL is particularly favored for:
Given its widespread usage, monitoring MySQL performance is crucial for maintaining application health and ensuring optimal user experiences.
Effective metrics monitoring is vital for maintaining the performance and reliability of your MySQL database. By keeping an eye on various performance indicators, you can proactively identify potential issues before they escalate. Here are key areas where monitoring can make a significant difference:
In summary, a comprehensive metrics monitoring strategy allows you to make informed decisions, optimize performance, and maintain a healthy database environment.
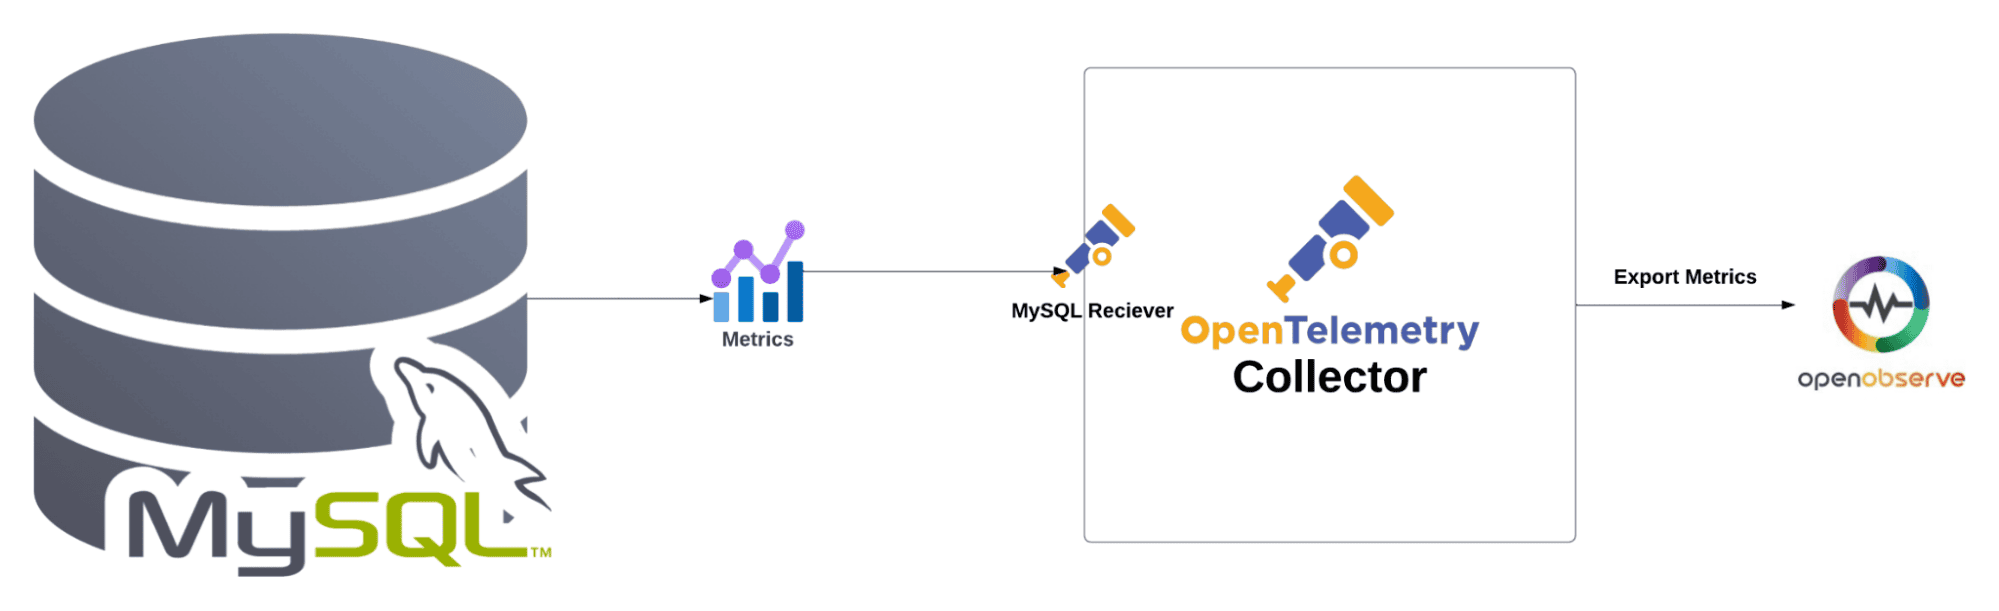
We will use Otel-Collector mysql receiver to collect metrics and push them to OpenObserve that will allow us to capture the metrics, build dashboards and generate alerts.
The MySQL receiver in the OpenTelemetry Collector is designed to query MySQL’s global status and InnoDB tables. It utilizes the SHOW GLOBAL STATUS command to collect a wealth of metrics that provide insights into the database's performance and health.
Here’s a sample configuration for the MySQL receiver:
receivers:
  mysql:
    endpoint: localhost:3306
    username: otel
    password: ${env:MYSQL_PASSWORD}
    database: otel
    collection_interval: 10s
    initial_delay: 1s
In this configuration:
The MySQL receiver collects a variety of metrics that provide insights into database performance. Here are some key metrics emitted by default:
These metrics are crucial for assessing the performance and health of your MySQL instance.Find the complete list of default metrics here
Ensure your MySQL version is 8.0 or higher for compatibility with the receiver.
Before we begin, ensure you have the following:
Make sure your MySQL server is up and running. If you are running it locally, it should be accessible at localhost:3306.
You may want to create a dedicated user for OpenTelemetry monitoring:
CREATE USER 'otel'@'localhost' IDENTIFIED BY 'yourpassword';
GRANT SELECT, PROCESS, REPLICATION CLIENT ON *.* TO 'otel'@'localhost';
FLUSH PRIVILEGES;
Next, we need to install the OpenTelemetry Collector.
NOTE: The default Otel Collector doesn't have all the receivers, including the Postgres one we are going to use to collect data from the DB. It has support for receivers like Kafka, Prometheus, Jaeger, etc. So, instead of using opentelemetry-collector, we are going to use opentelemetry-collector-contrib.
Visit the OpenTelemetry Collector Contrib Releases page.
Download the latest release for your machine. You can use the following command in your terminal to download opentelemetry-collector-contrib for macOS , replacing v0.115.1 with the latest version number:
curl --proto '=https' --tlsv1.2 -fOL https://github.com/open-telemetry/opentelemetry-collector-releases/releases/download/v0.115.1/otelcol-contrib_0.115.1_darwin_arm64.tar.gz
tar -xvf otelcol-contrib_0.115.1_darwin_arm64.tar.gz
sudo mv otelcol-contrib /usr/local/bin/
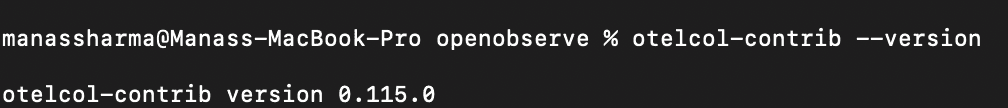
otelcol-contrib --version
Receivers in the OpenTelemetry Collector are responsible for collecting telemetry data from various sources. They act as the entry point for data into the collector, allowing it to gather metrics, logs, and traces from different systems. Each receiver is designed to handle specific types of data and protocols.
Next, you’ll need to create a configuration file named config.yaml. This file defines how the Collector will behave, including what data it will receive, how it will process that data, and where it will send it.
receivers:
  mysql:
    endpoint: "localhost:3306"
    username: otel
    password: ${env:MYSQL_PASSWORD}
    database: otel
    collection_interval: 10s
    initial_delay: 1s

processors:
  batch:
    send_batch_size: 10000
    timeout: 10s

exporters:
  otlphttp/openobserve:
    endpoint: http://localhost:5080/api/default
    headers:
      Authorization: Basic YOUR_AUTH_TOKEN
      stream-name: default

service:
  pipelines:
    metrics:
      receivers: [mysql]
      processors: [batch]
      exporters: [otlphttp/openobserve]
Receivers: Collect metrics from your MySQL instance. Ensure the endpoint and credentials match your MySQL configuration.
Processors: The batch processors help manage and optimize data flow to exporters.
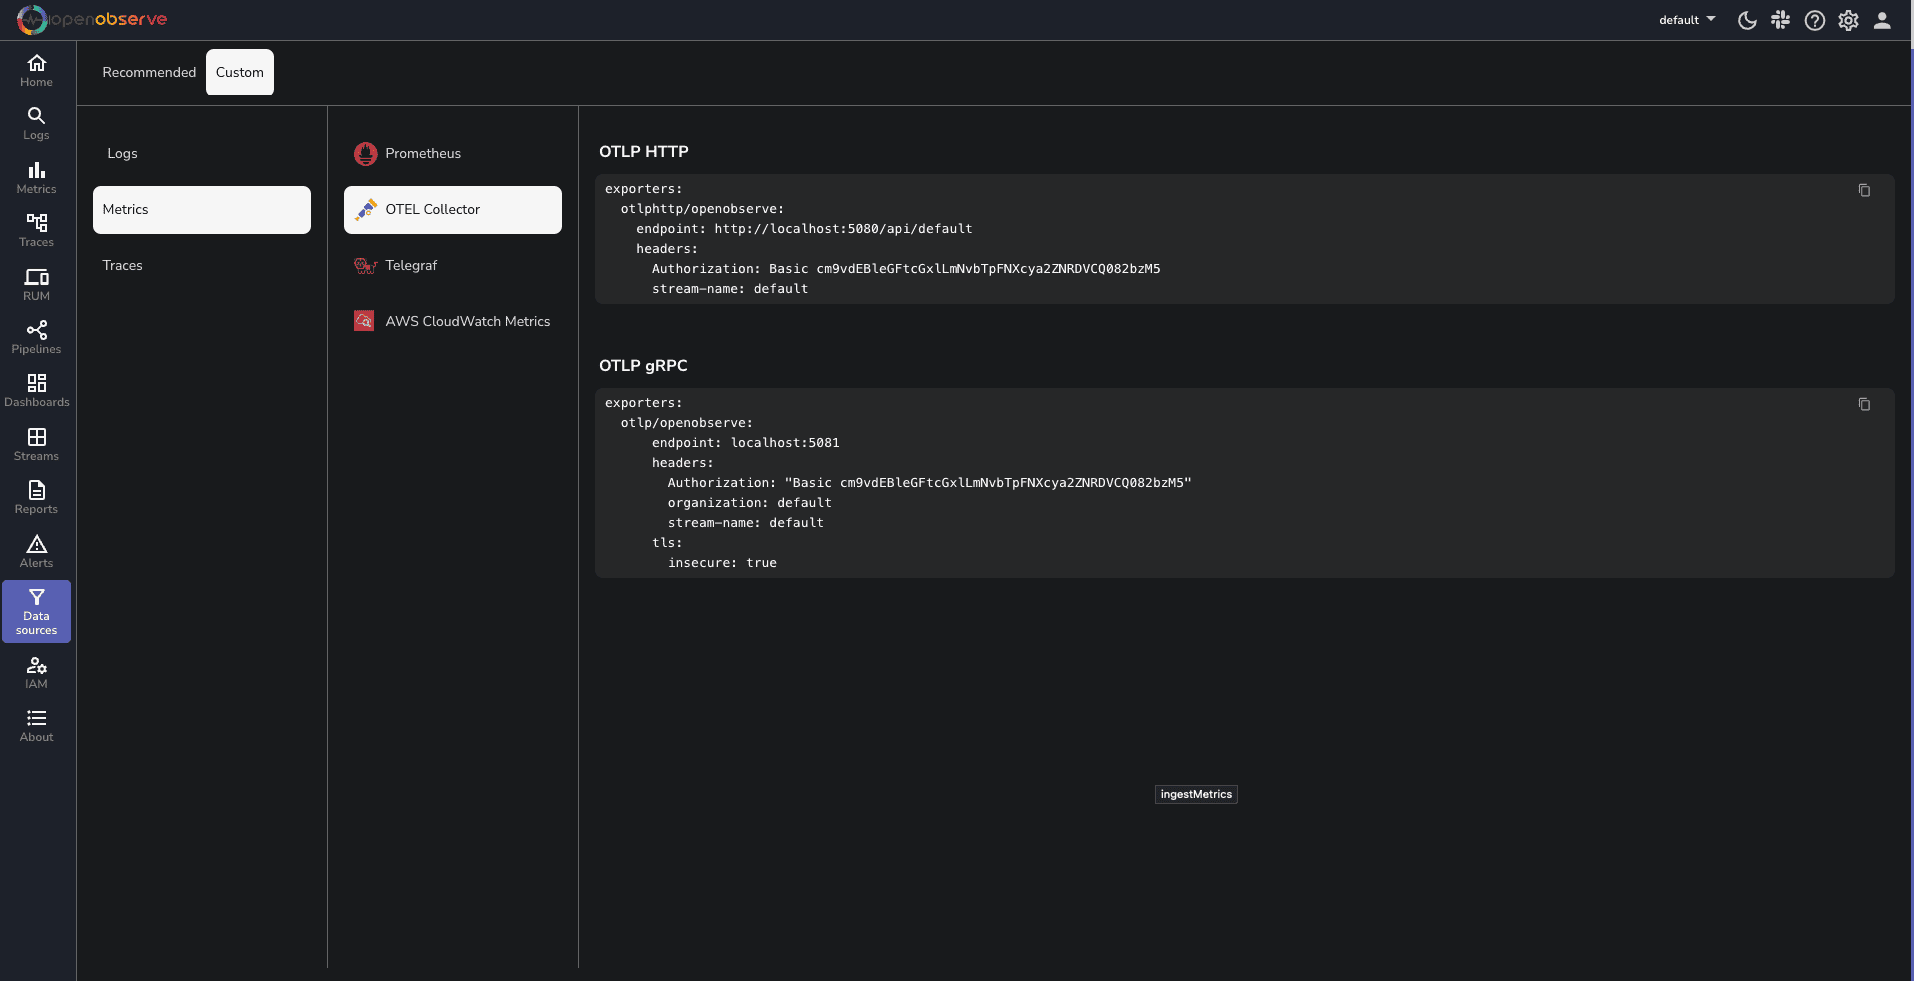
Exporters: The otlphttp/openobserve exporter sends the collected telemetry data to OpenObserve. Replace YOUR_API_ENDPOINT and YOUR_AUTH_TOKEN with your actual OpenObserve API endpoint and authentication token, which you can find in your Data Sources -> Custom - > Metrics -> Otel Collector
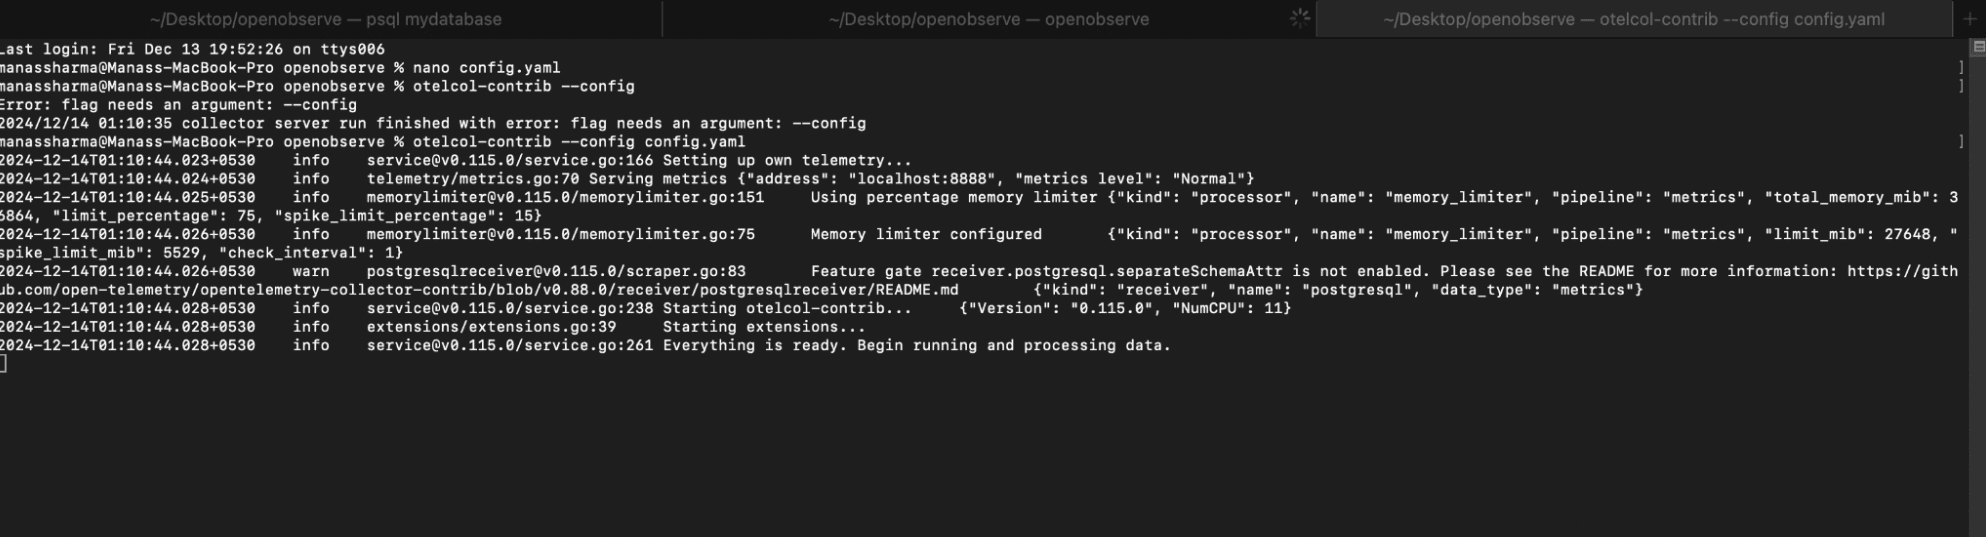
To run the OpenTelemetry Collector with the specified configuration, execute the following command in your terminal:
otelcol-contrib --config /path/to/your/config.yaml
Replace /path/to/your/config.yaml with the actual path to your configuration file.
You should get a output similar to this
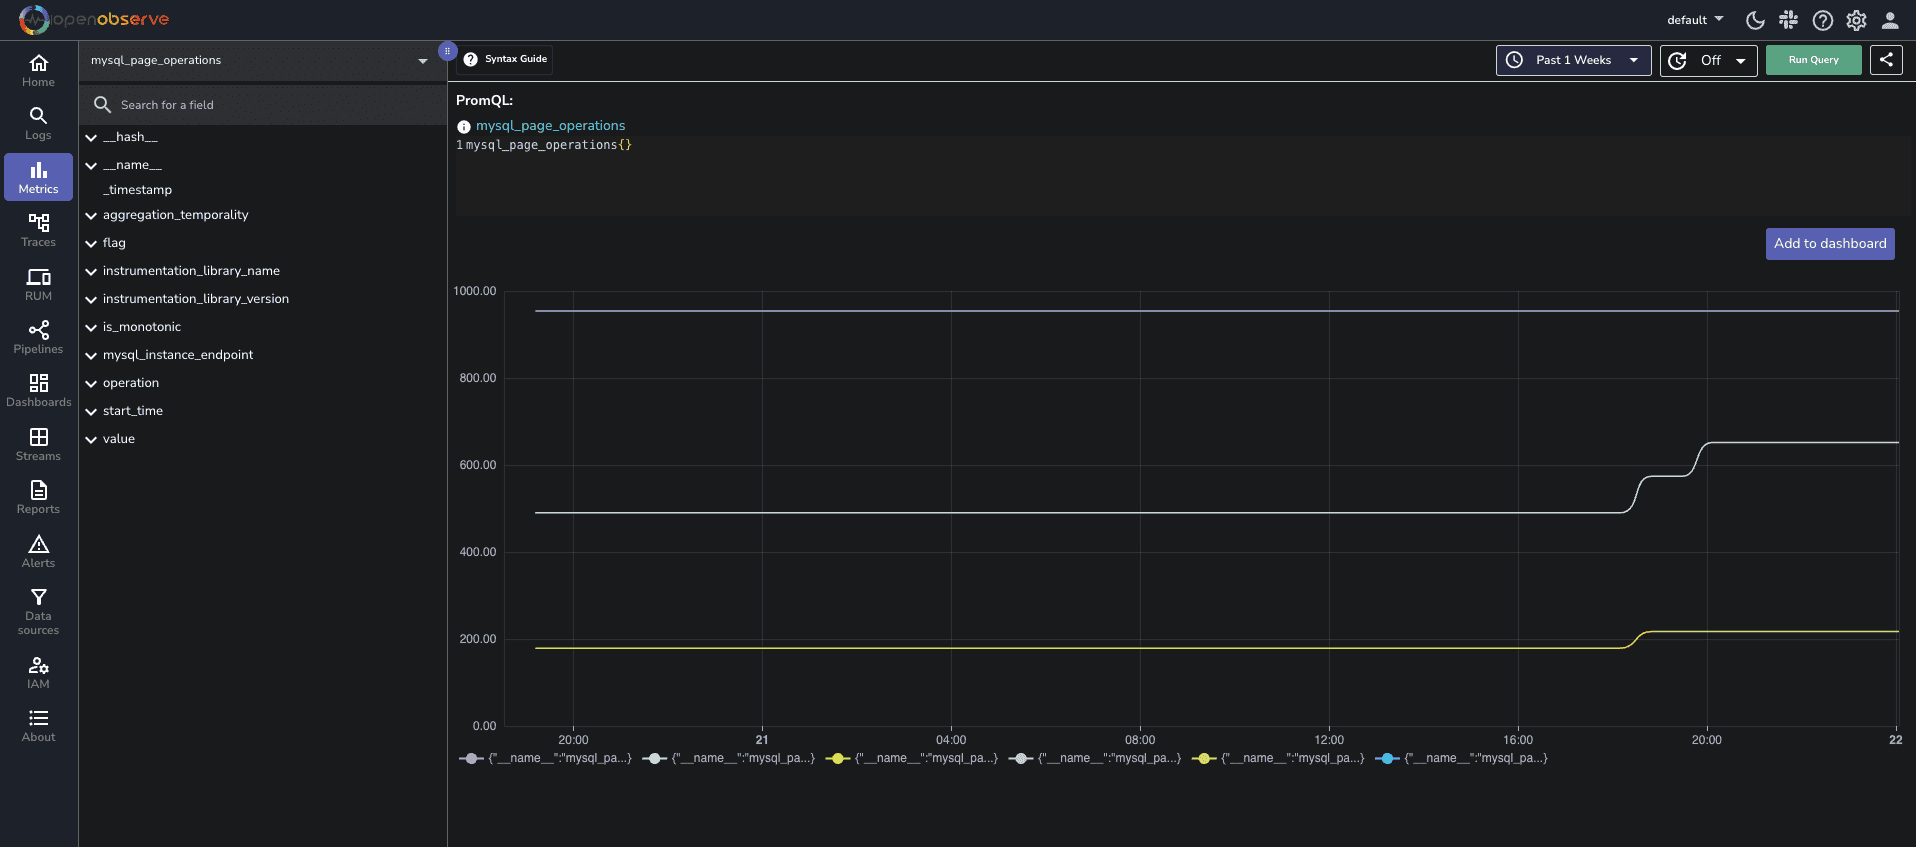
Once your setup is complete, navigate to the OpenObserve dashboard. Click on the "Streams" button in the sidebar to view the collected data streams.
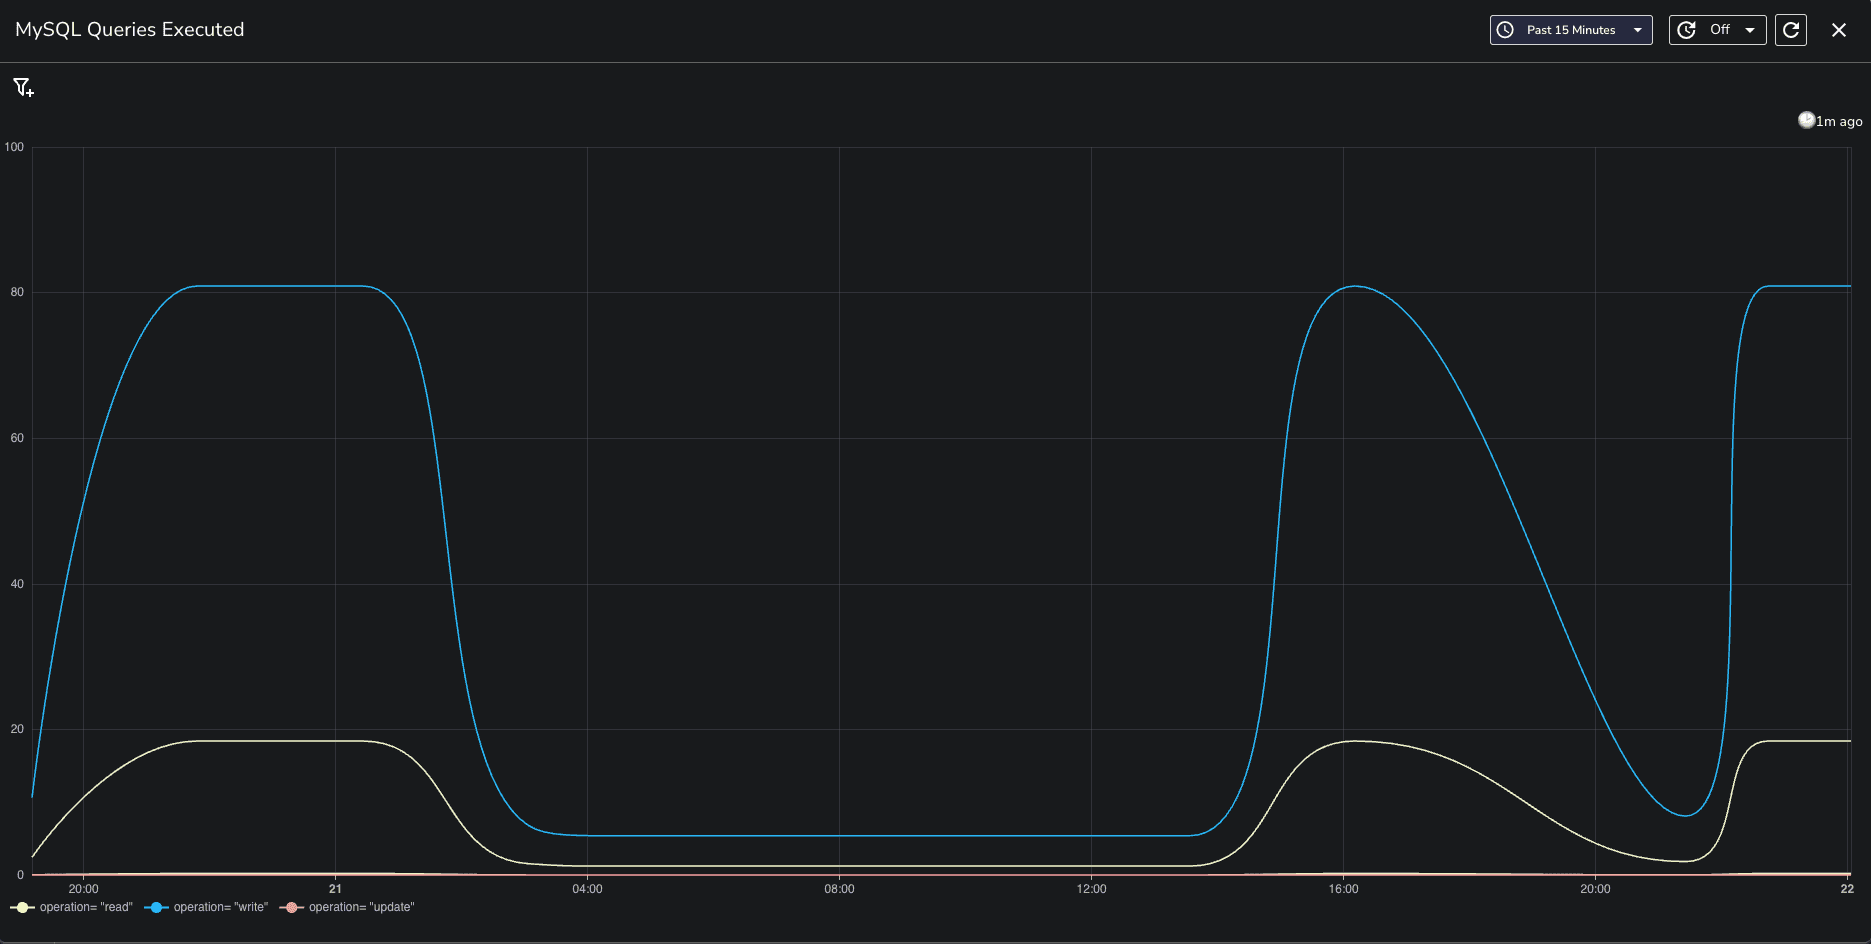
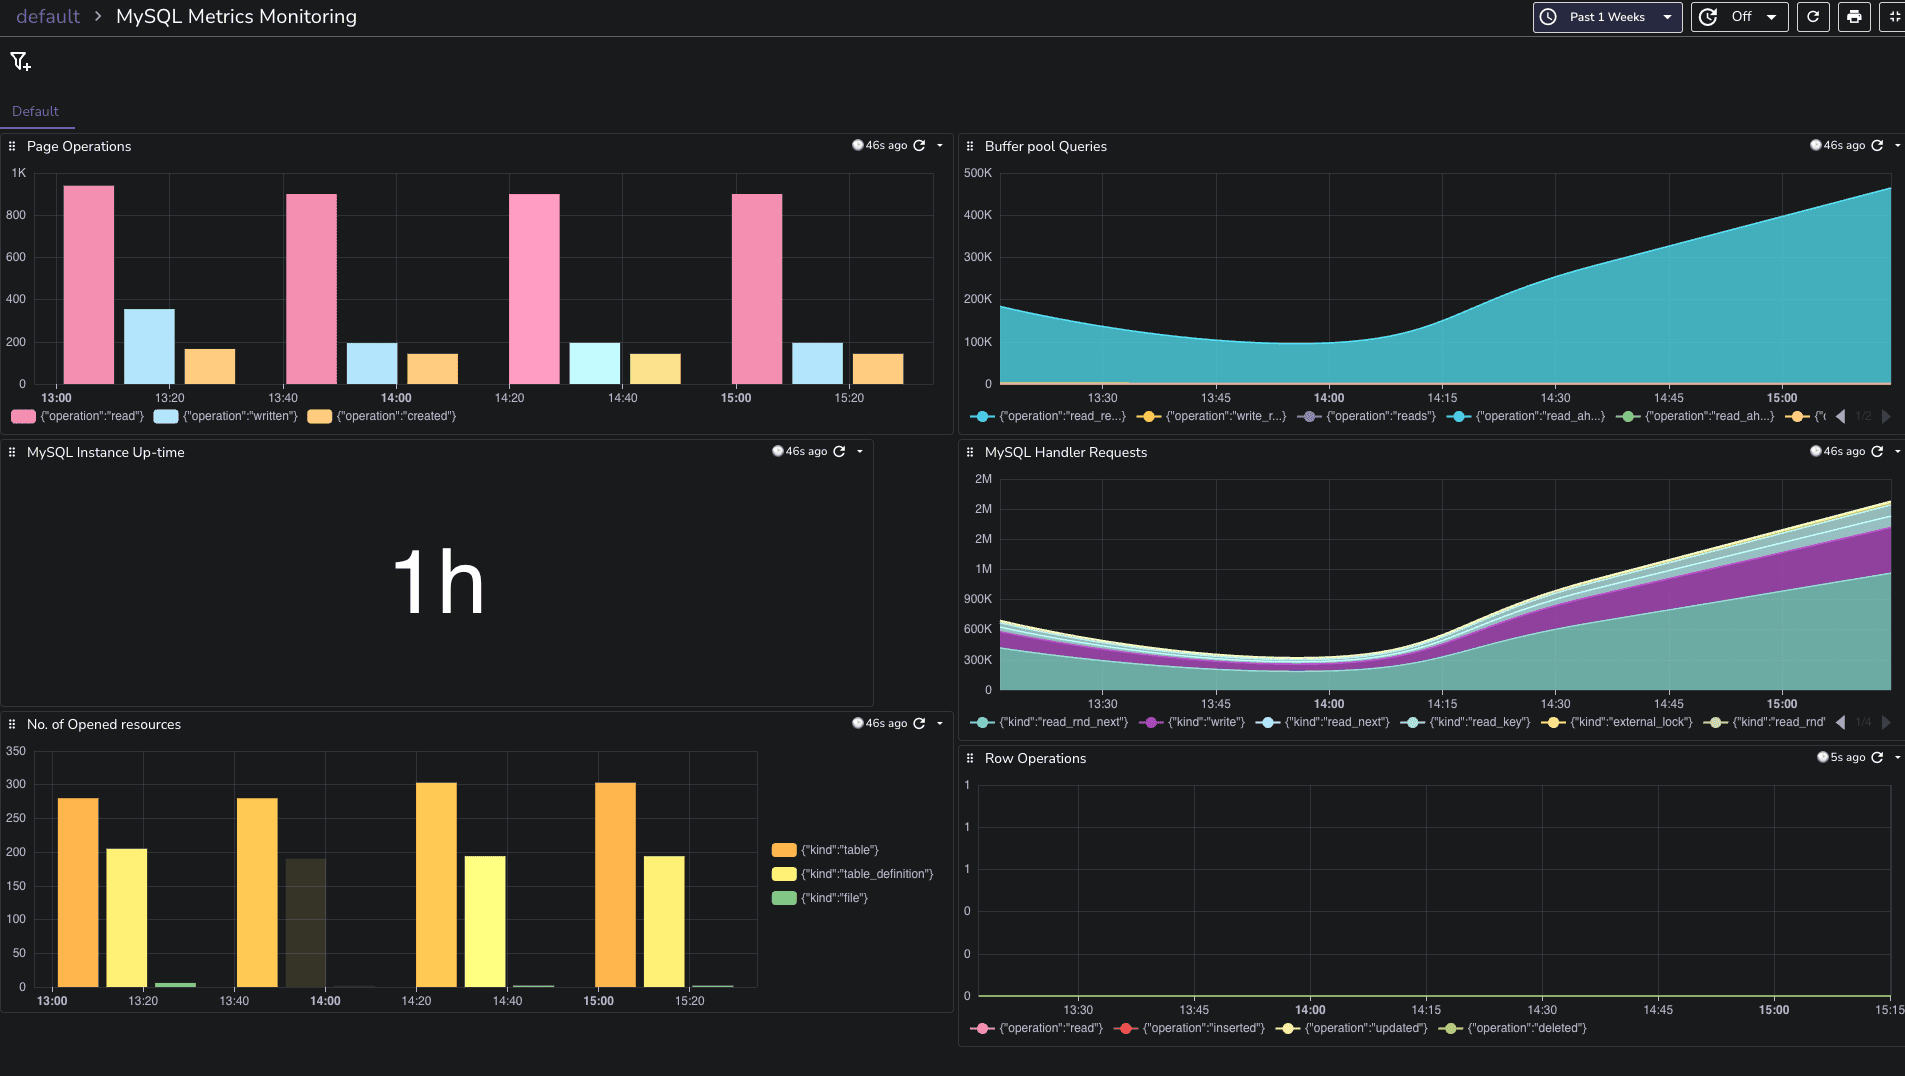
You can download the dashboards here.
If you encounter connection issues during setup, consider the following:
Congratulations! You’ve successfully set up a MySQL metrics monitoring system using OpenTelemetry and OpenObserve. This powerful combination allows you to gain valuable insights into your MySQL performance, enabling you to make informed decisions to optimize your applications.
For more information and detailed documentation, check out the OpenTelemetry MySQL Receiver Documentation and the OpenObserve Documentation.
Happy monitoring! 🚀
Manas is a passionate Dev and Cloud Advocate with a strong focus on cloud-native technologies, including observability, cloud, kubernetes, and opensource. building bridges between tech and community.