What is netflow and how to use it to analyze network traffic

Prabhat Sharma
January 19, 2024
6 min read
Don’t forget to share!
Try OpenObserve Cloud today for more efficient and performant observability.

Imagine a vigilant sentry at every exit and entrance of your network, meticulously recording every data packet that passes through. NetFlow is essentially that sentry, a technology that captures metadata about network traffic flows. It logs details like source and destination addresses, packet size, and application protocols, painting a detailed picture of how traffic ebbs and flows through your network. That is netflow in a nutshell.
You can go through the blog or watch the below video as well.
NetFlow's story begins in the mid-90s at Cisco. Back then, network monitoring relied heavily on SNMP, a protocol that interrogated devices for one-point-in-time snapshots. But imagine trying to understand a bustling highway by taking still photographs from a helicopter - NetFlow offered a dynamic, real-time view.
It quickly revolutionized network management. NetFlow data empowered admins to:
While Cisco initially held the reins, NetFlow's impact transcended vendor boundaries. The core concept proved so valuable that various iterations and standards emerged, like IPFIX and sFlow. Today, NetFlow has become a cornerstone of network monitoring, employed by diverse network devices and analyzed by powerful software tools.
There are 2 major versions of netflow in use today:
In addition to these, IPFIX is also used. IPFIX is an IETF standard based on netflow v9.
NetFlow records are traditionally exported via UDP by network devices like routers and switches. To capture these records, you need a collector. IP address and port number of netflow collector must be configured on the network device. 2055 is a common port used for netflow collection.
A sample netflow record may look like:
{
  "bgp_next_hop": "",
  "bytes": 73,
  "dst_addr": "221.43.87.148",
  "dst_as": 51751,
  "dst_mac": "00:00:00:00:00:00",
  "dst_net": "221.43.87.148/30",
  "dst_port": 12977,
  "dst_vlan": 0,
  "etype": "IPv4",
  "forwarding_status": 0,
  "fragment_id": 0,
  "fragment_offset": 0,
  "icmp_code": 0,
  "icmp_type": 0,
  "in_if": 0,
  "ip_flags": 0,
  "ip_tos": 0,
  "ip_ttl": 0,
  "ipv6_flow_label": 0,
  "next_hop": "36.206.171.217",
  "next_hop_as": 0,
  "observation_domain_id": 0,
  "observation_point_id": 0,
  "out_if": 0,
  "packets": 146,
  "proto": "TCP",
  "sampler_address": "10.1.46.97",
  "sampling_rate": 0,
  "sequence_num": 10298,
  "src_addr": "71.58.124.245",
  "src_as": 40904,
  "src_mac": "00:00:00:00:00:00",
  "src_net": "71.0.0.0/9",
  "src_port": 60524,
  "src_vlan": 0,
  "tcp_flags": 0,
  "time_flow_end_ns": 1705009598286792700,
  "time_flow_start_ns": 1705009466286792700,
  "time_received_ns": 1705009779286981600,
  "type": "NETFLOW_V5",
  "vlan_id": 0
}
A typical architecture for netflow collection is shown below.
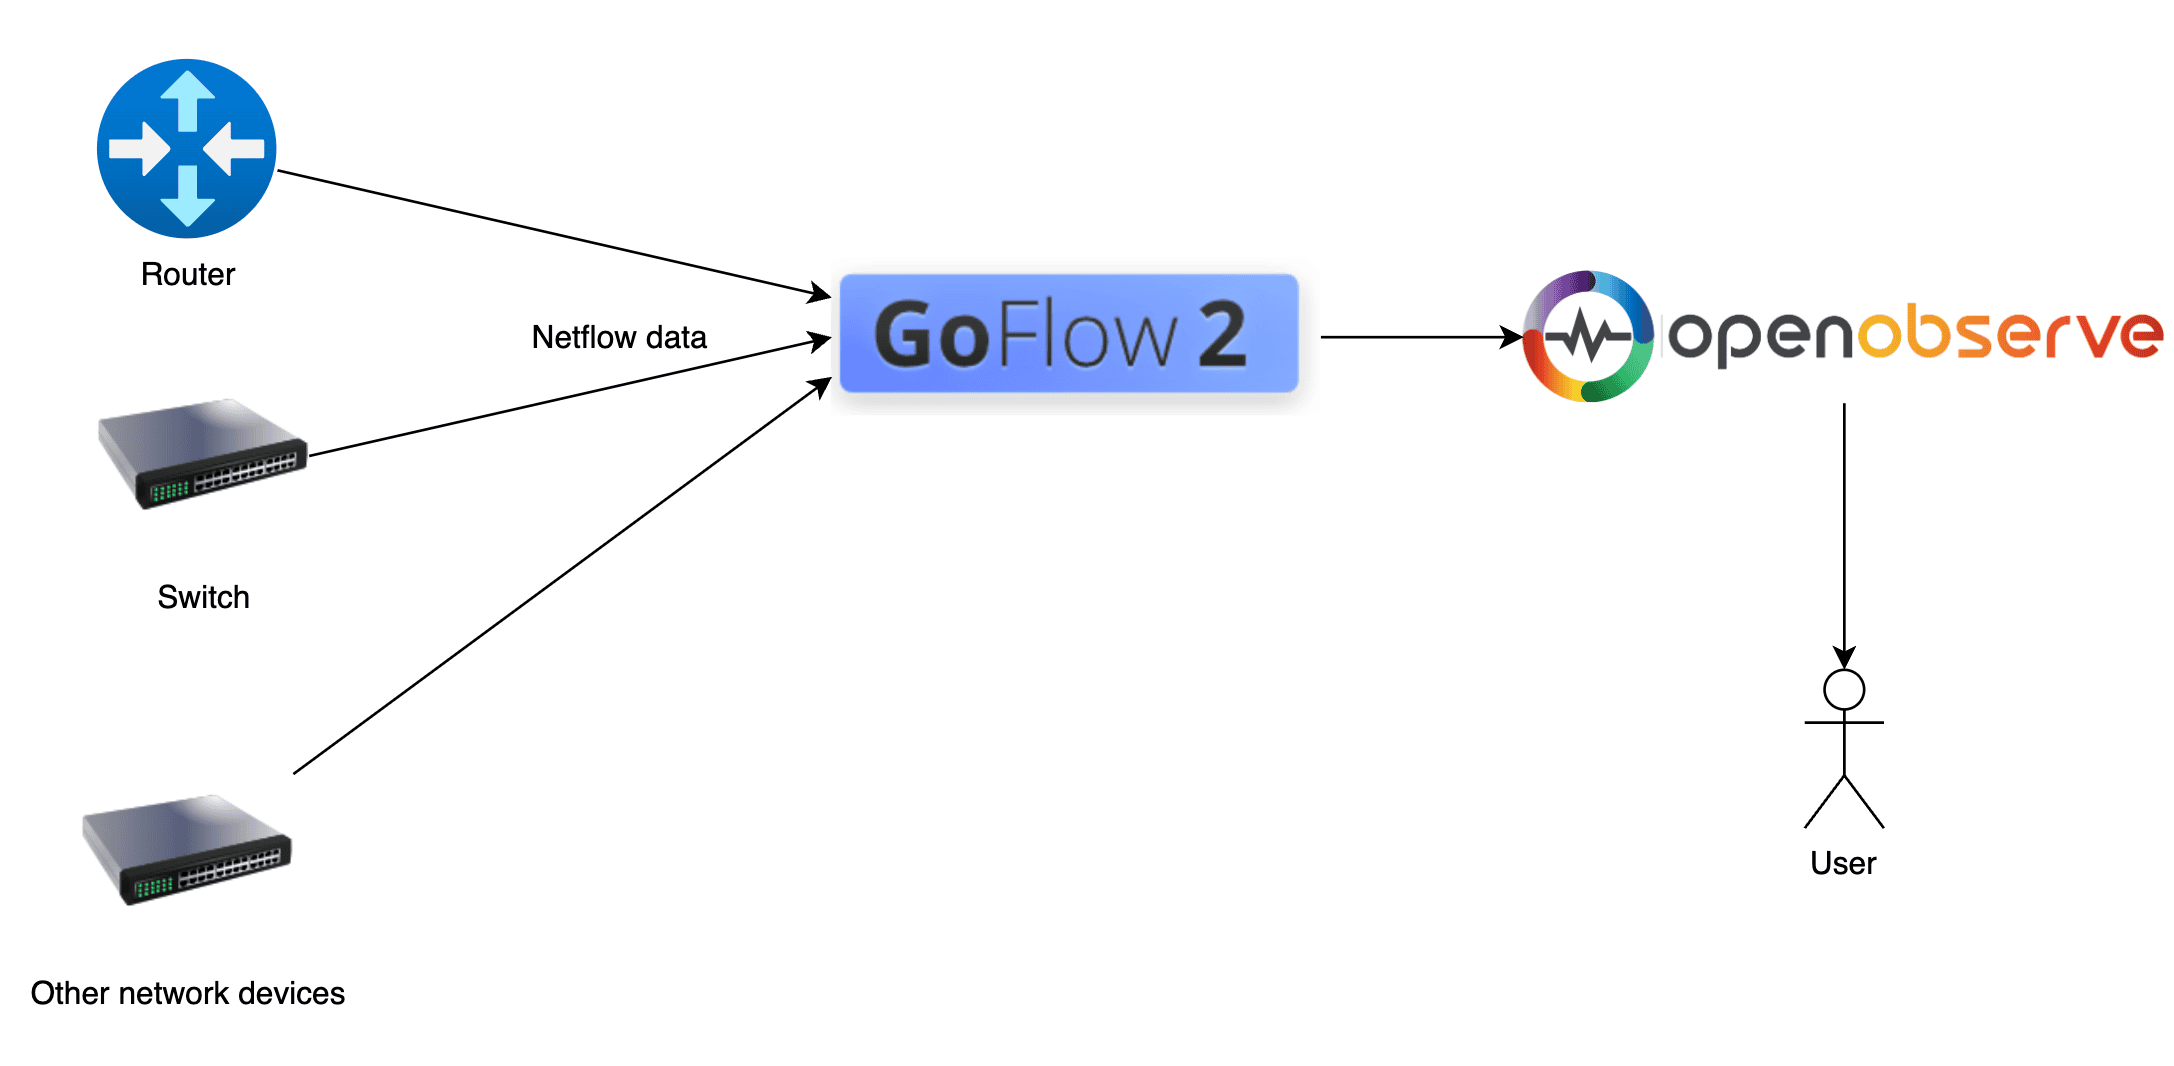
Network devices would send data to a netflow collector. The collector can then send the data to OpenObserve. OpenObserve can then be used to analyze the data. Goflow2 can be used as a netflow collector. We will be using a forked version of goflow2 that has an http transport which allows sending data to any http endpoint. goflow2, is a high-performance, open-source NetFlow/IPFIX/sFlow collector built in Go, that can be used to collect netflow records. We will use it for the purpose of collecting netflow records in this blog.
We weill do following in this article:
Let's download OpenObserve from release page. Now run OpenObserves using the following command on Mac or Linux (For other platforms, check quickstart guide ):
ZO_ROOT_USER_EMAIL="root@example.com" ZO_ROOT_USER_PASSWORD="Complexpass#123" ./openobserve
Once you have OpenObserve running, let's download and run goflow2 from the release page: https://github.com/openobserve/goflow2/releases/tag/v100.0.1
./goflow2 -transport=http \
  -transport.http.destination=http://localhost:5080/api/default/netflow1/_json \
  -transport.http.batchSize=100 \
  -transport.http.auth.header=Authorization \
  -transport.http.auth.credentials="Basic <openobserve ingestion token>"
Now we need nflow-generator to generate sample netflow records and send them to goflow2. nflow-generator does not provde prebuilt binaries, but only a docker image. You can run it using the following command:
You can either use the docker image or build it from source. To build it from source, you can use the following command:
git clone https://github.com/nerdalert/nflow-generator.git
cd nflow-generator
go build
One you have the binary, you can run it using the following command:
./nflow-generator -t 127.0.0.1 -p 2055
This command will send sample netflow records to goflow2 running on local machine which will then send it to OpenObserve.
Remember, in real life you will be exposing goflow2 using a load balancer or ingress(in kubernetes). For the sake of demonstration, we are using nflow-generator to send sample logs to goflow2.
Once this is running you will be able to get logs in OpenObserve.
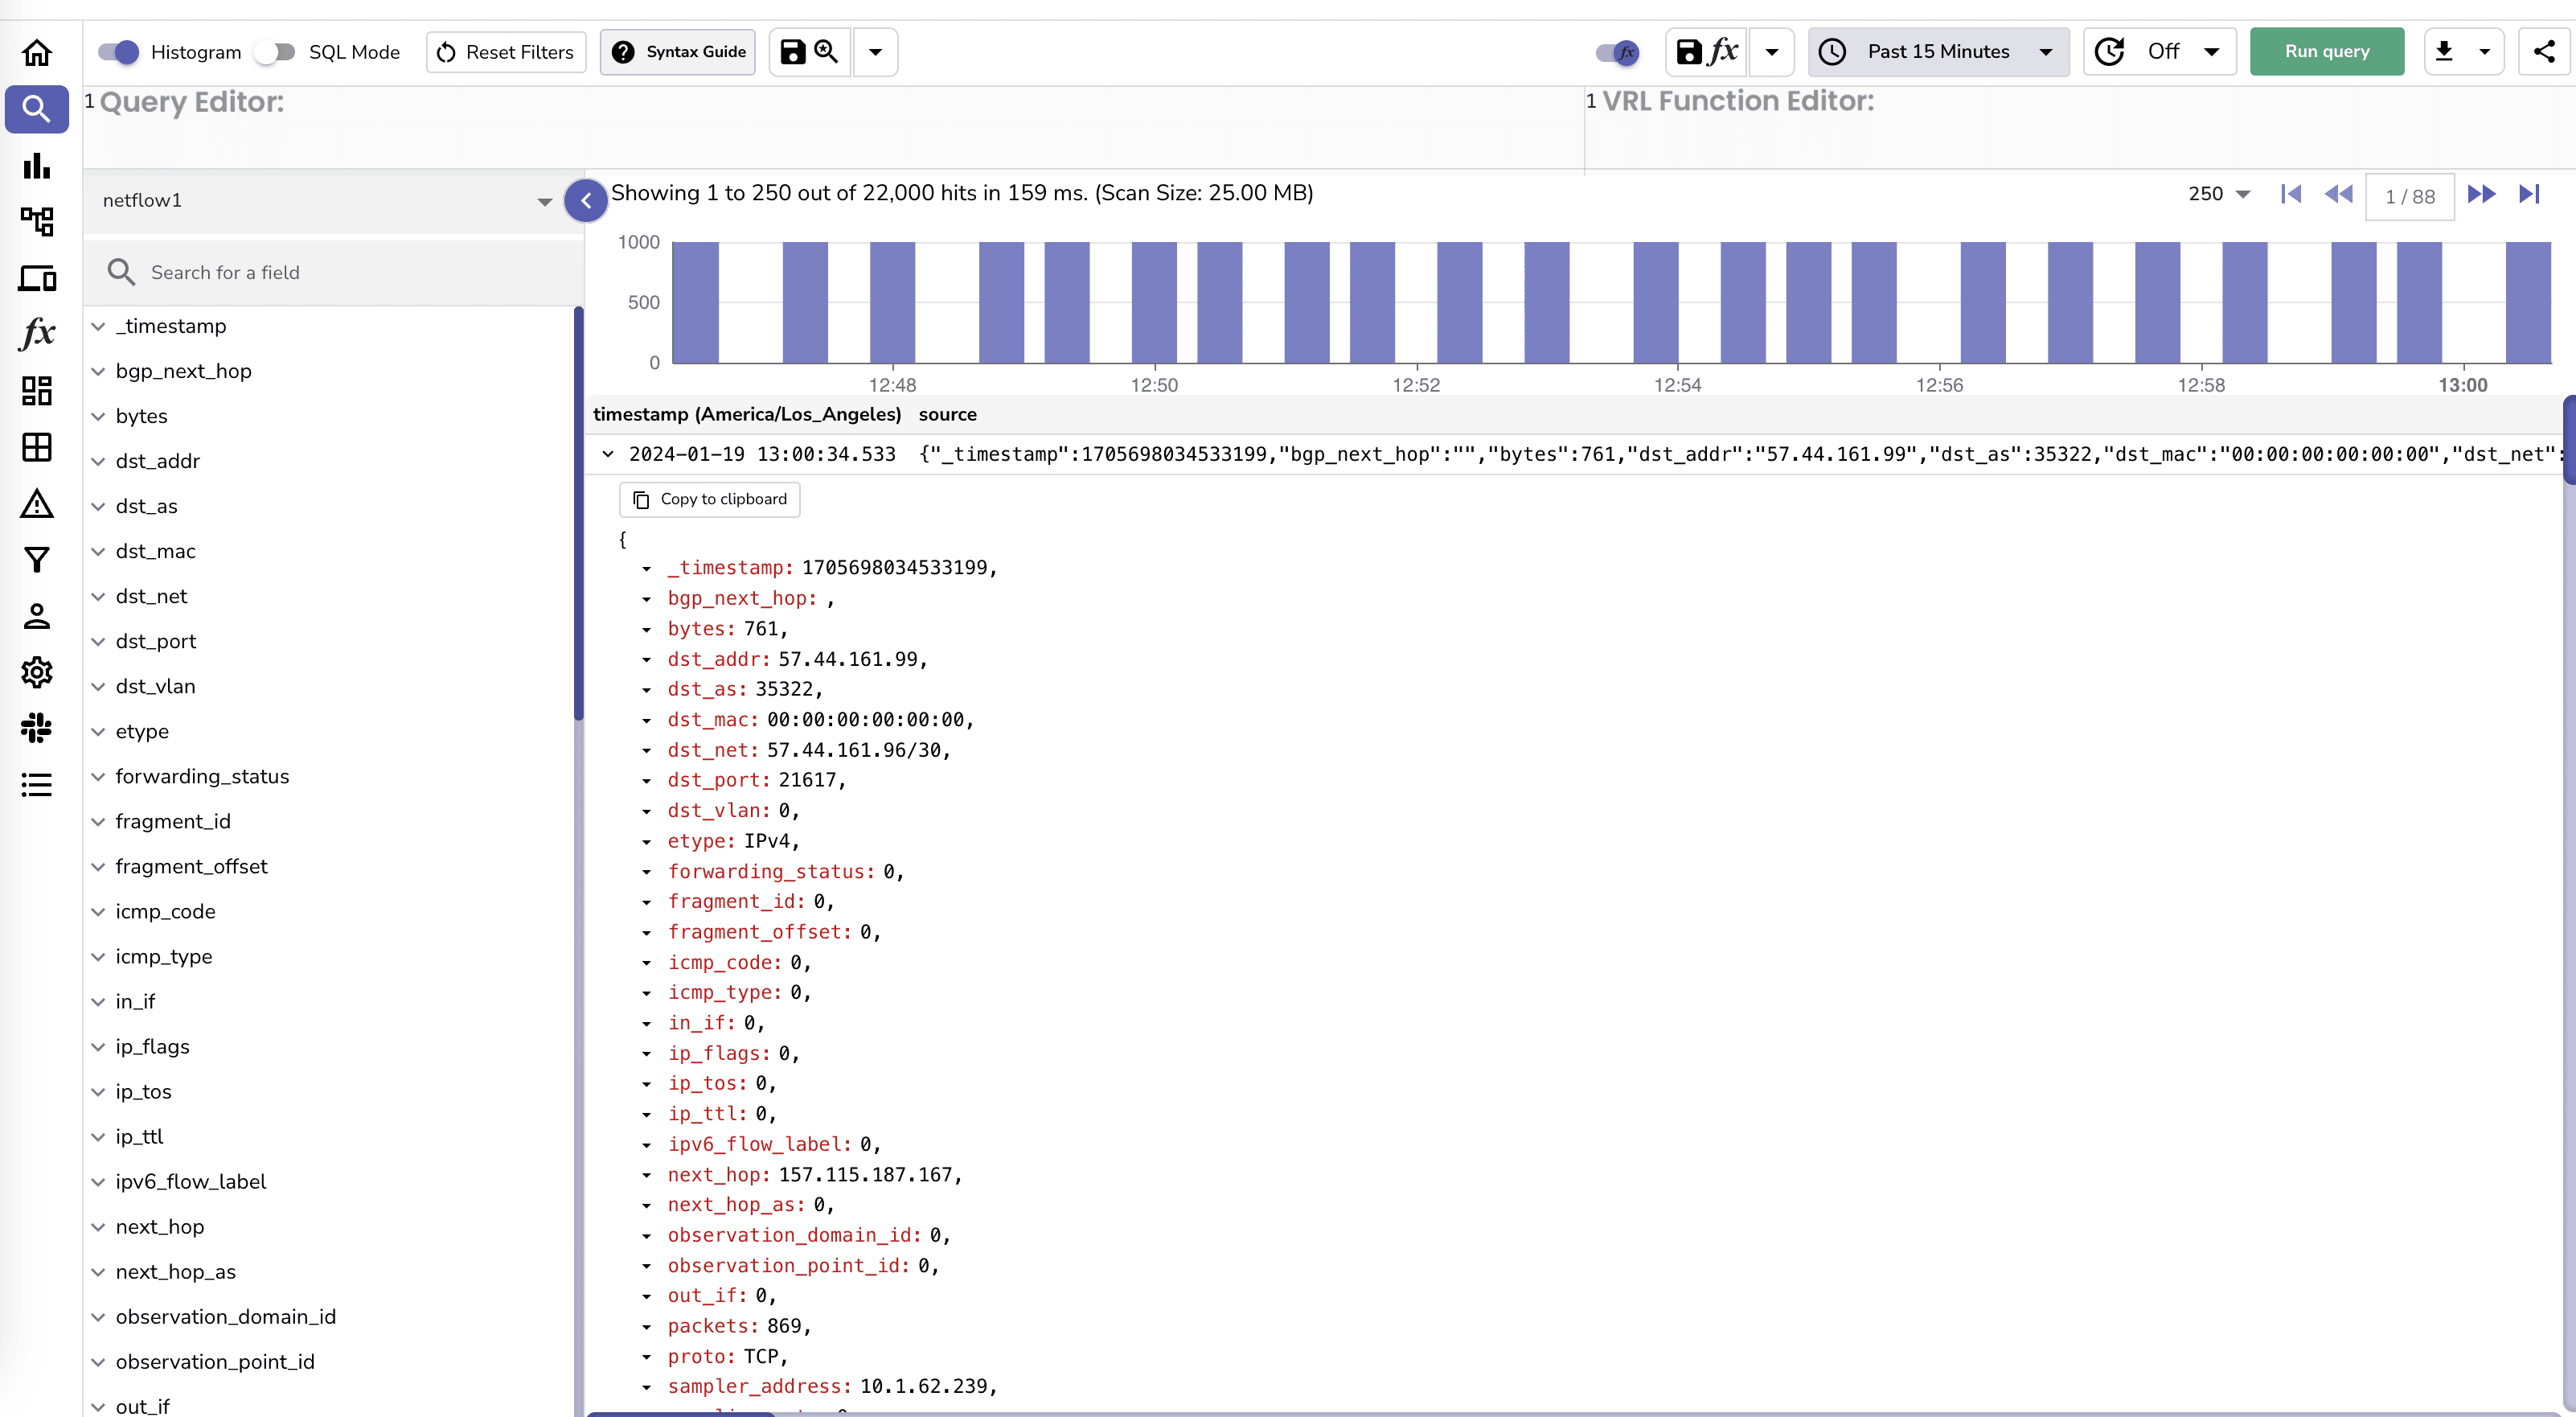
This was fast and easy. Now let's see how we can use the data to analyze network traffic.
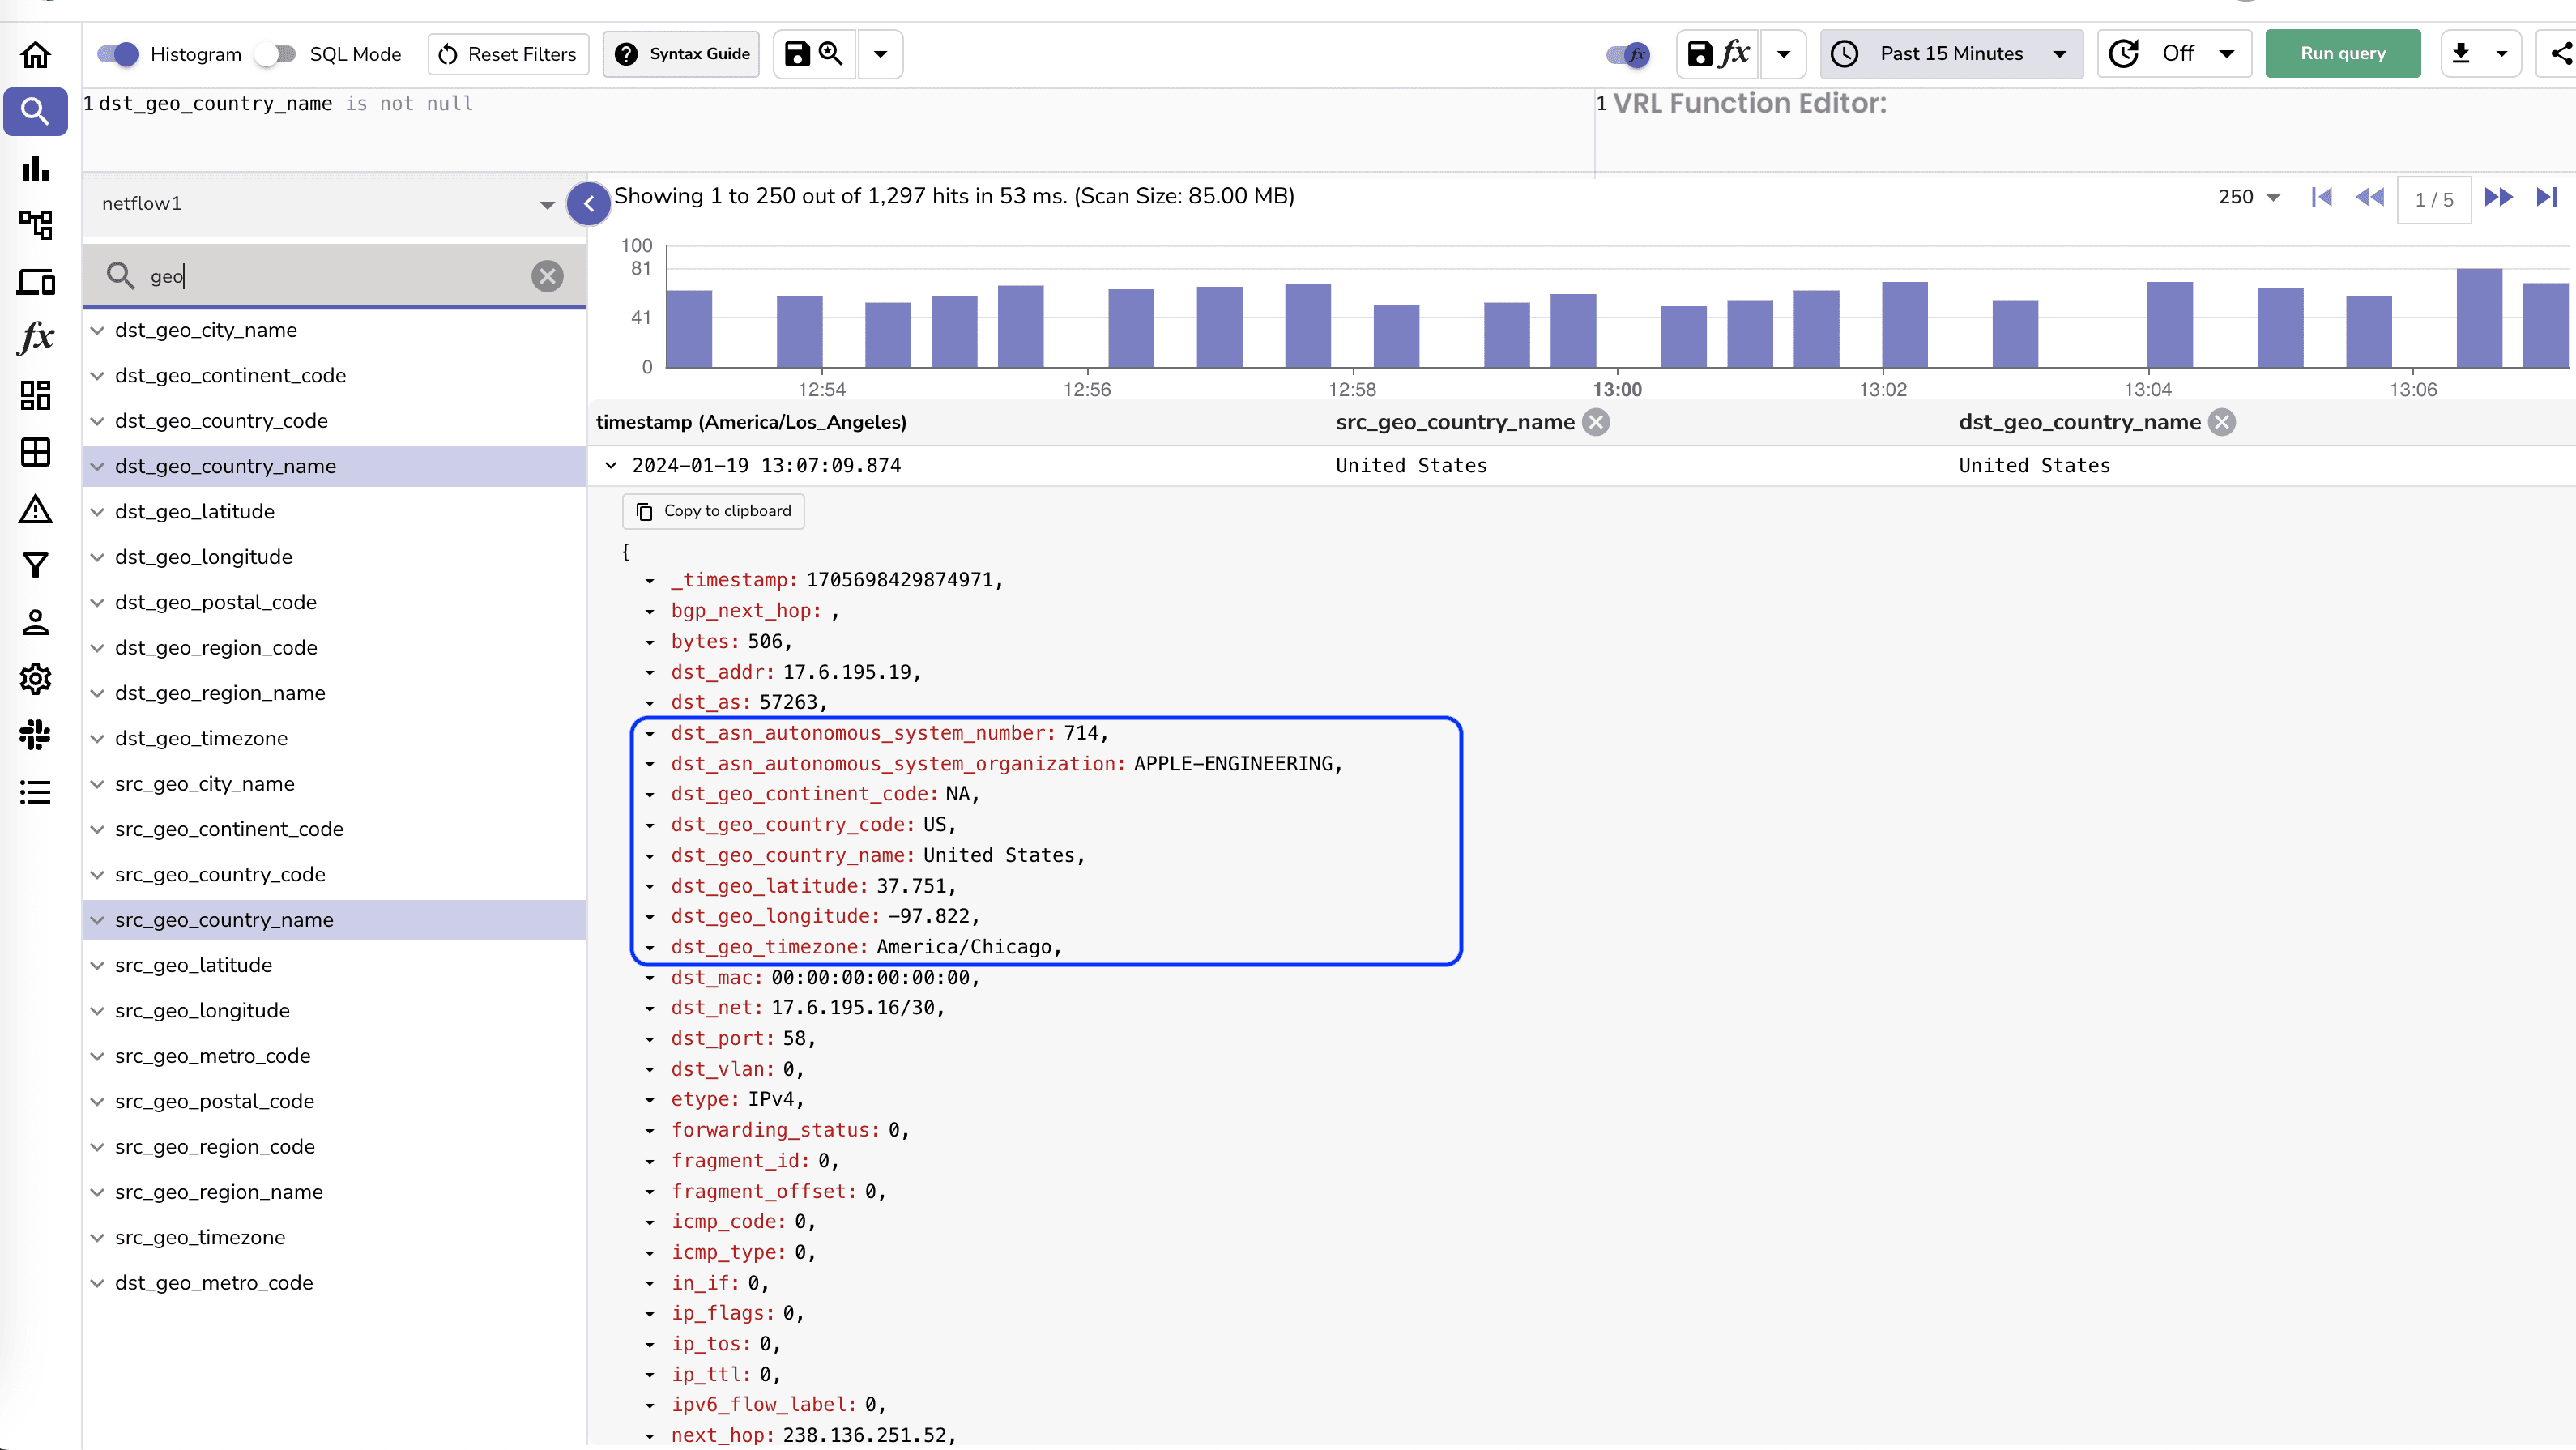
Before we do that let's enrich the records by adding Geolocation information to the records. This can be done very easily by by a simple VRL function. You can use the following script to create a VRL function:
.dst_geo = get_enrichment_table_record!("maxmind_city", {"ip": .dst_addr })
.dst_asn = get_enrichment_table_record!("maxmind_asn", {"ip": .dst_addr })

.src_geo = get_enrichment_table_record!("maxmind_city", {"ip": .src_addr })
.src_asn = get_enrichment_table_record!("maxmind_asn", {"ip": .src_addr })
Once the function is created you can associate it with the stream.
Once the function is associated with the stream, you will see the logs with geolocation data.
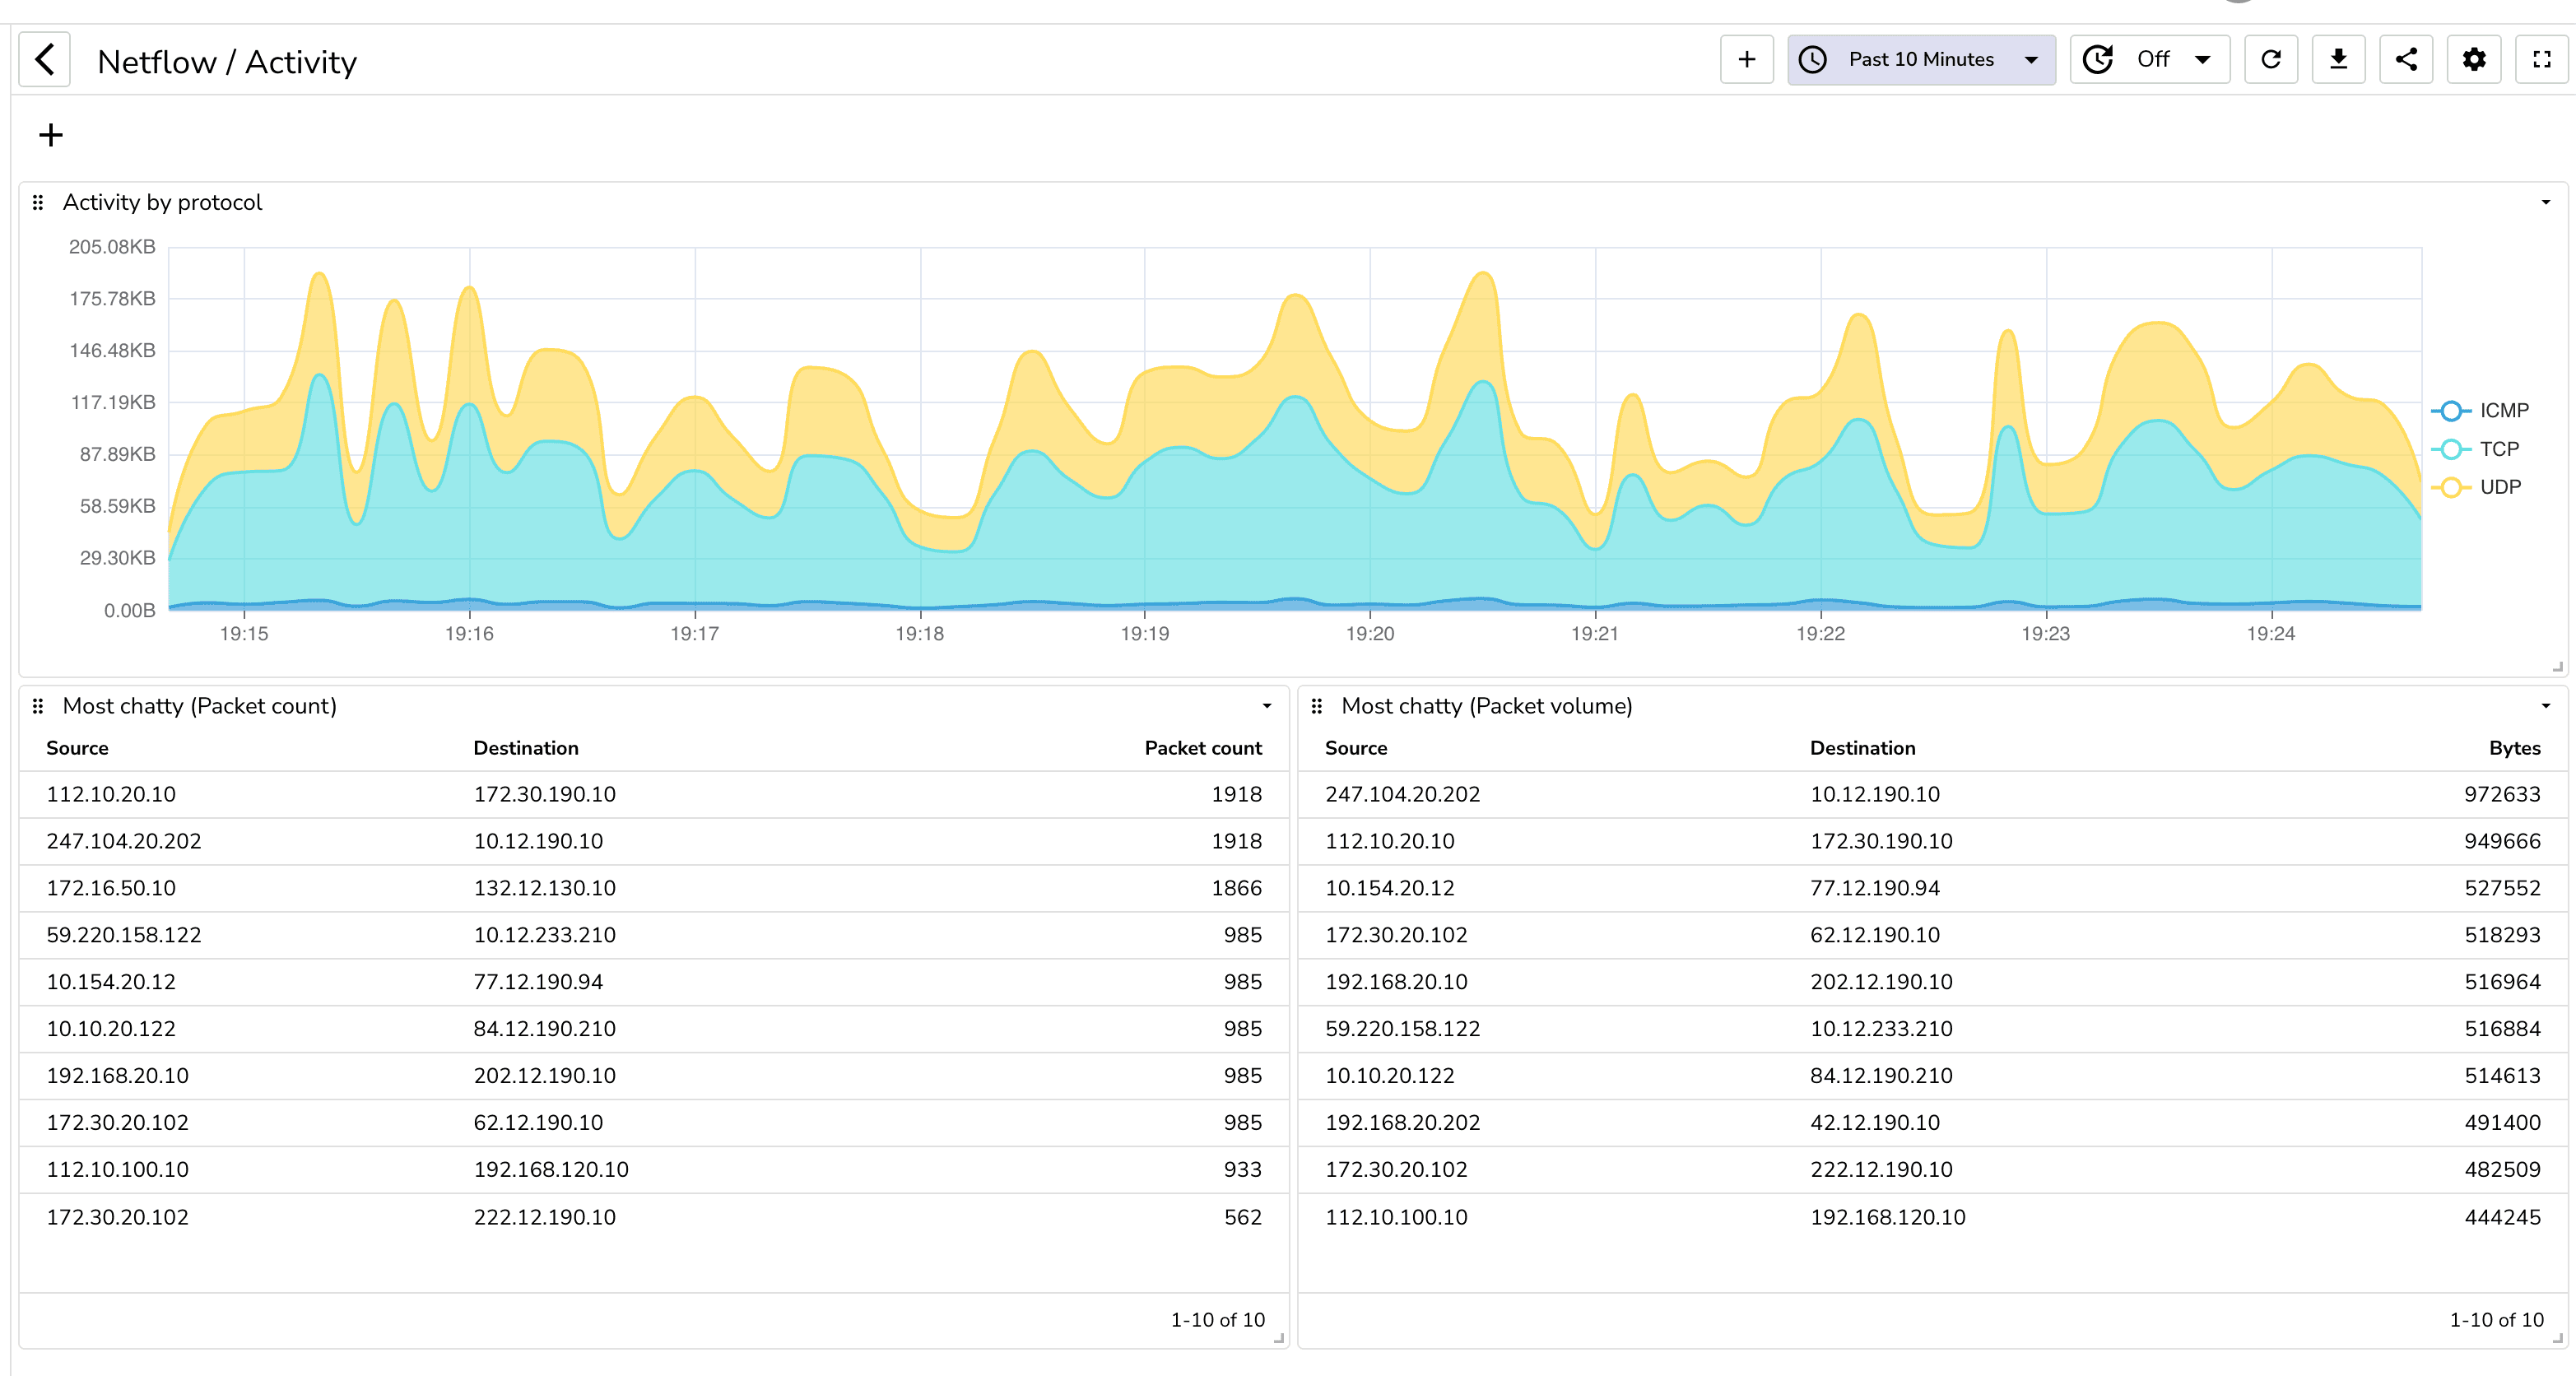
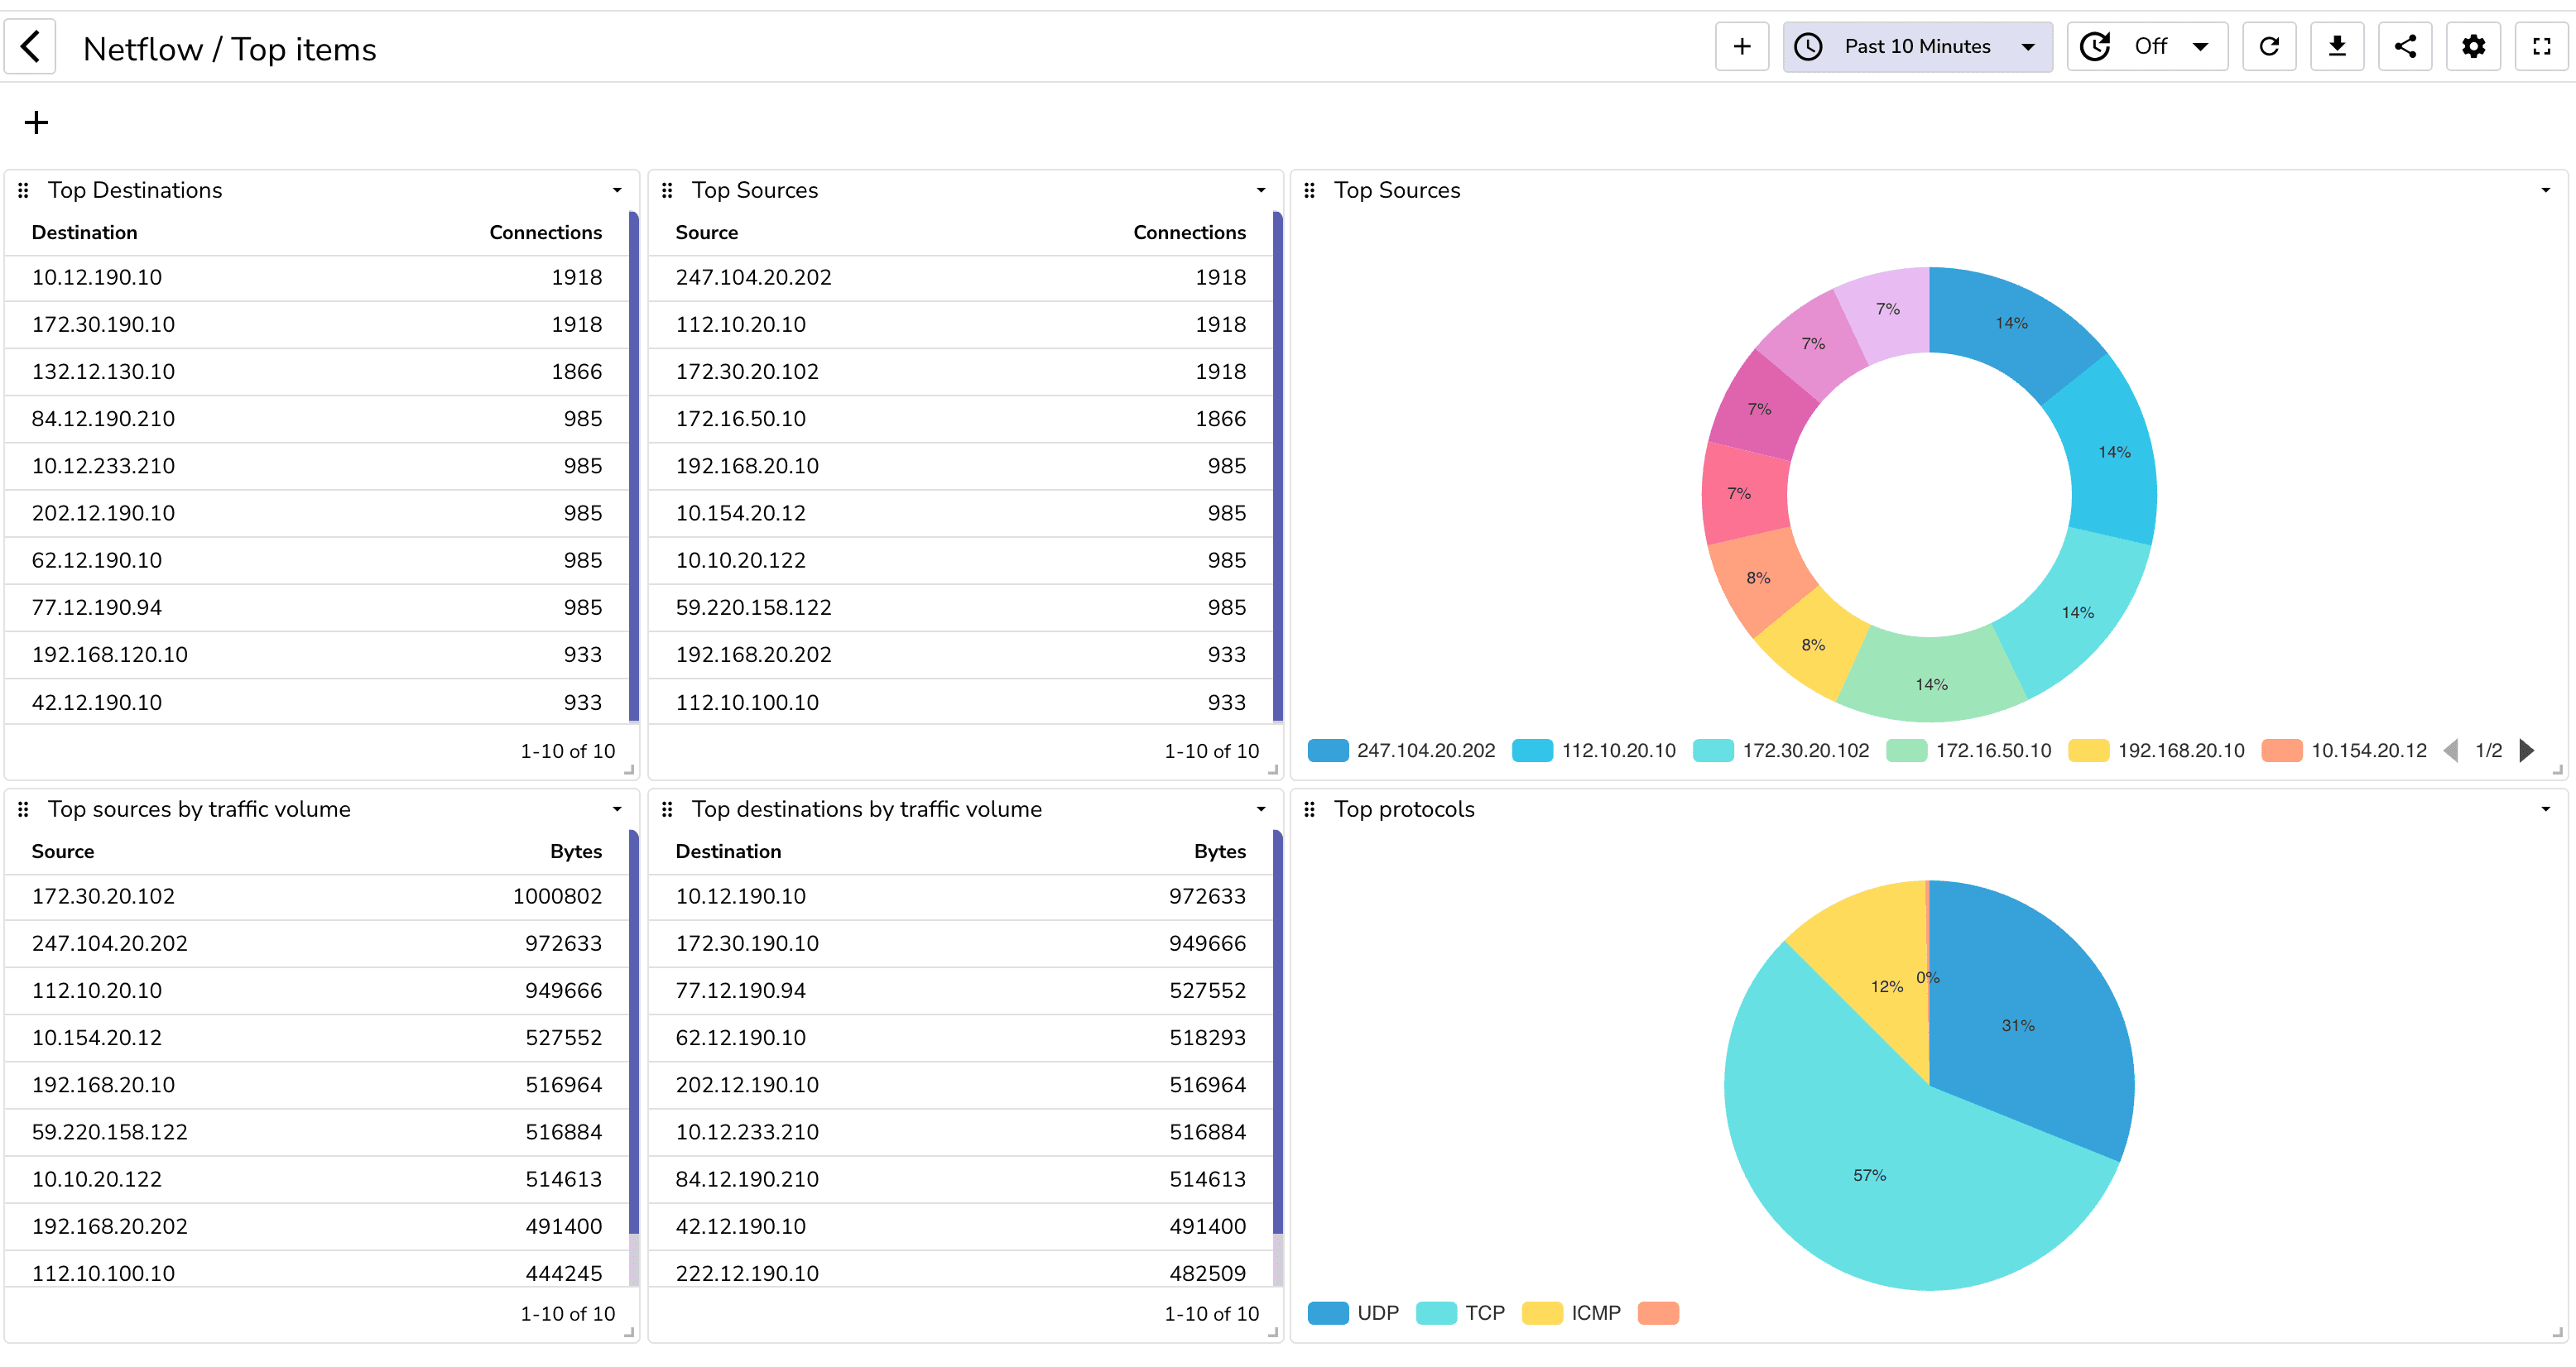
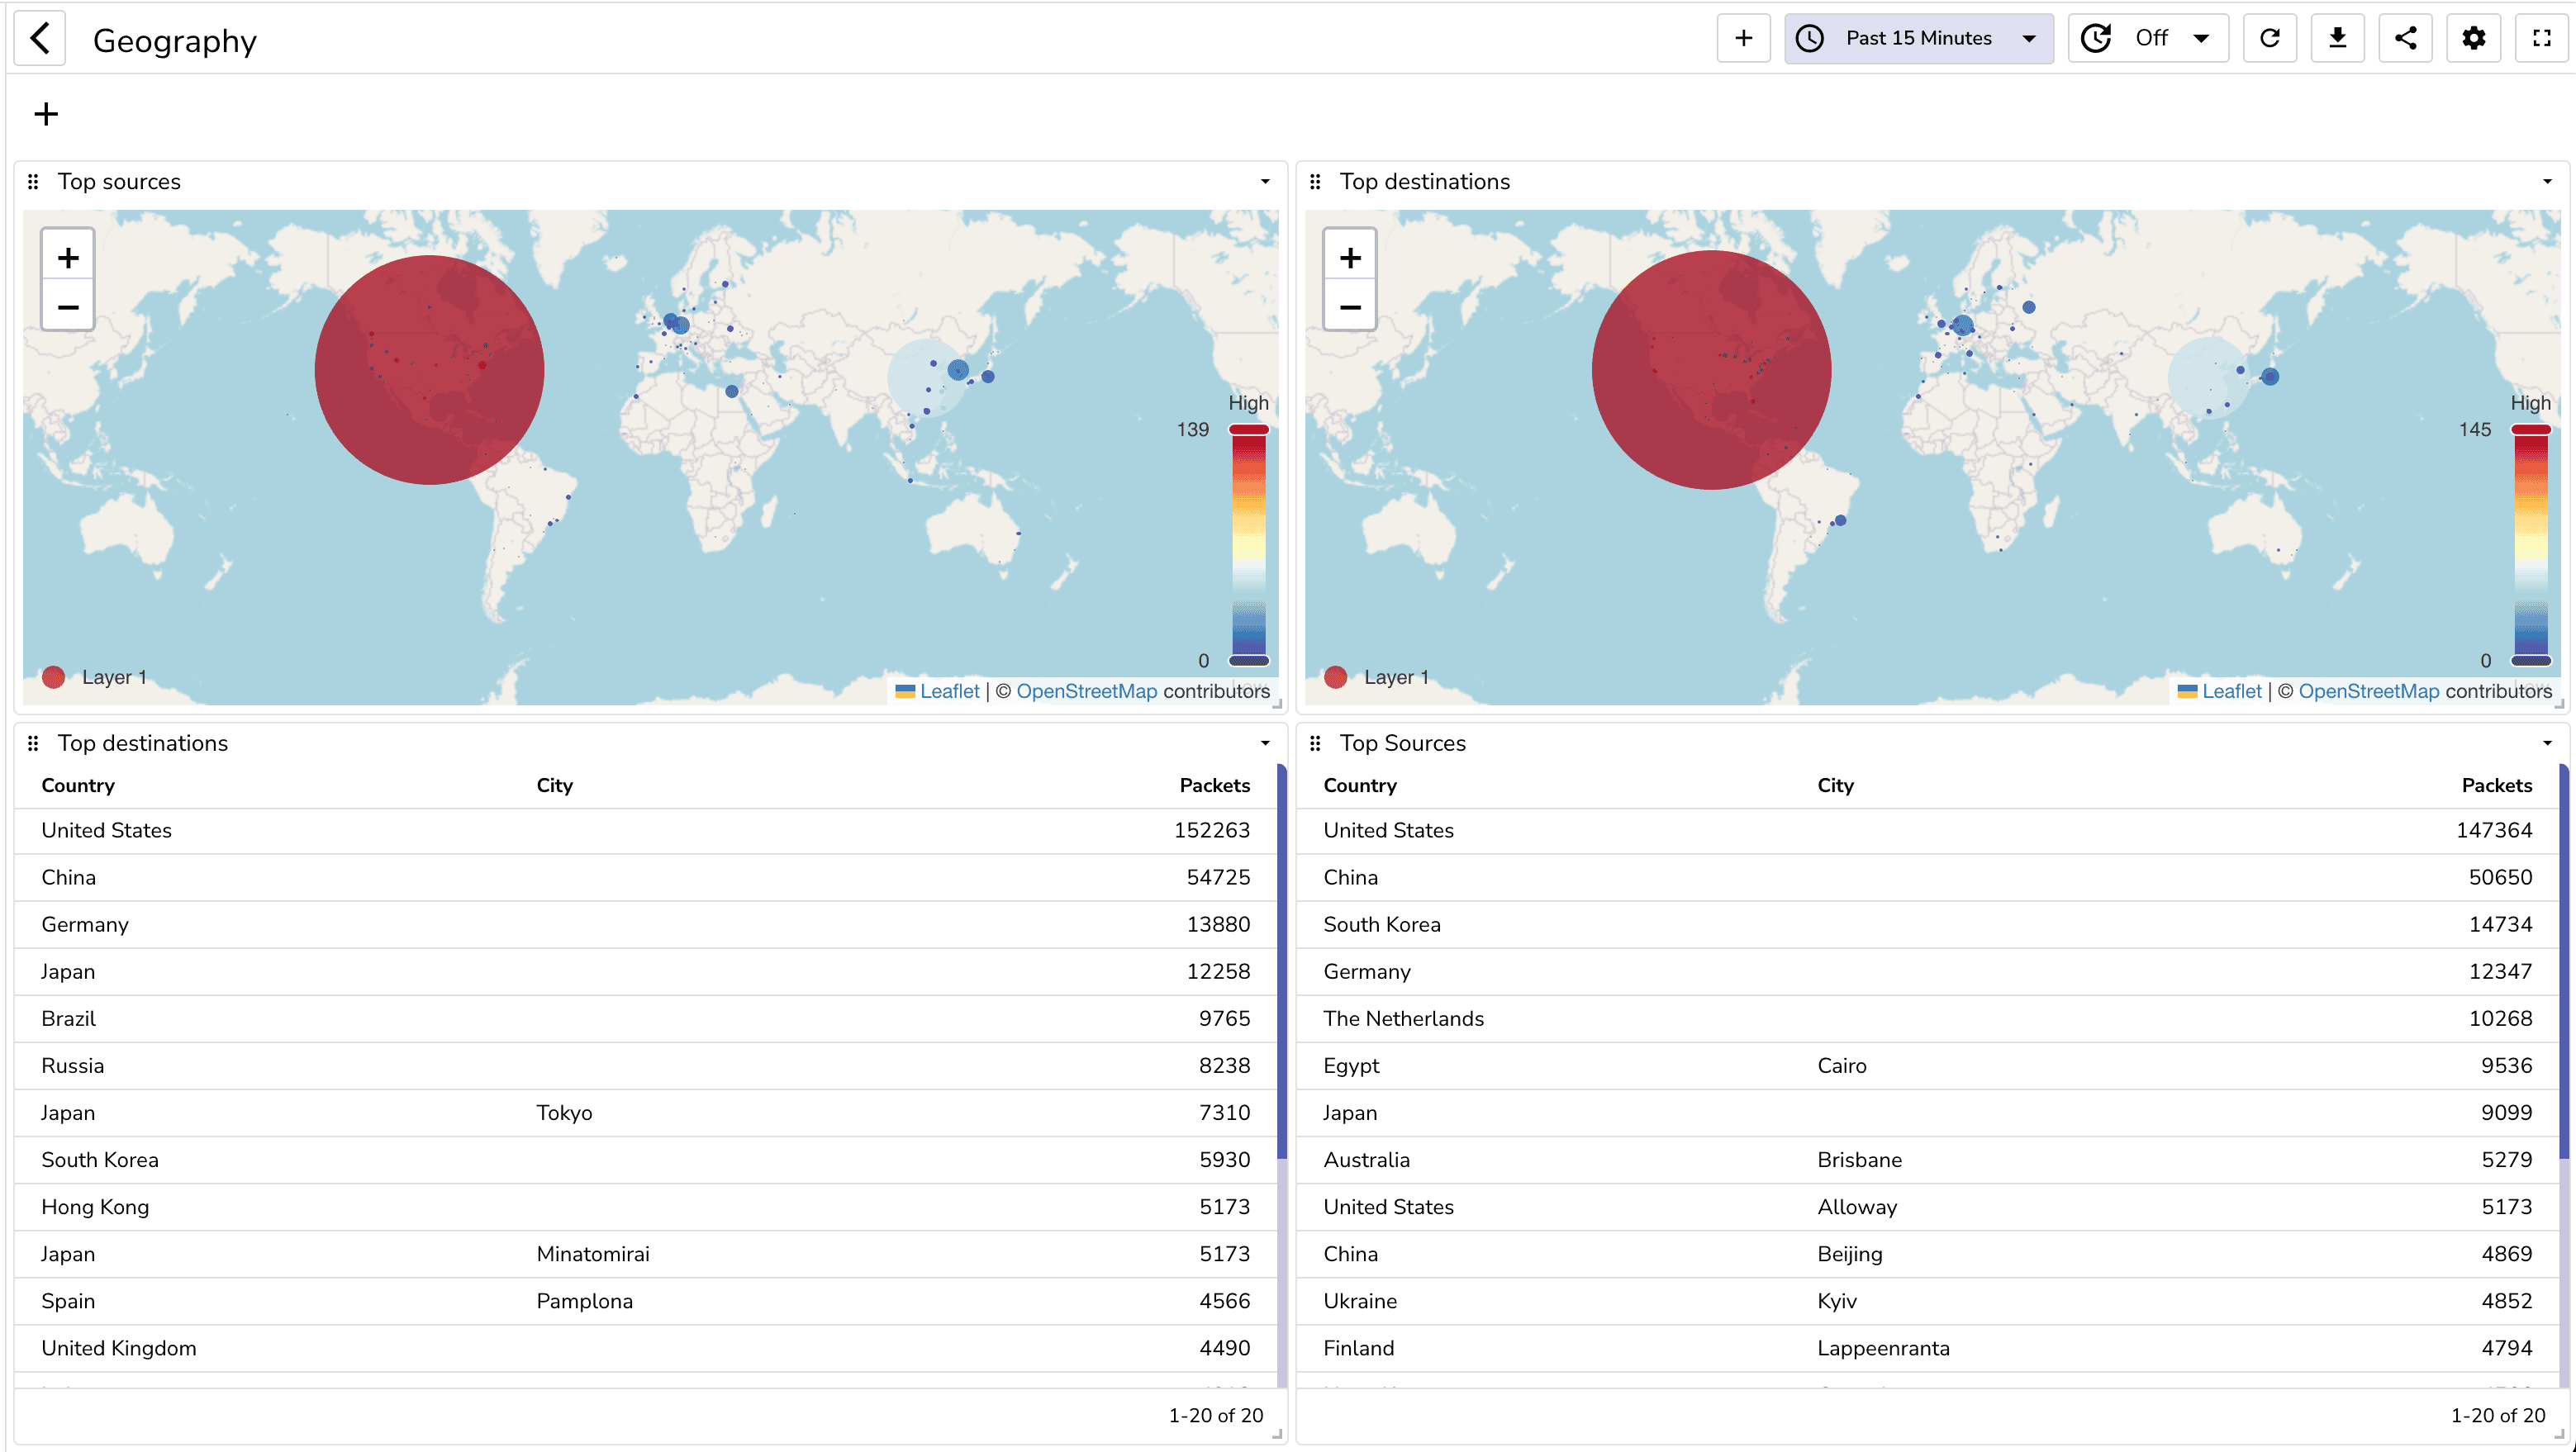
Now let's analyze the traffic. While you can create your own dashboard, you can also import the prebuilt dashboards from the dashboard repository.
You can build a dashboard to analyze network traffic. You can also import the prebuilt dashboards from the dashboard repository.
Once you import these dashboards, you will be able to see the following:
You can also create alerts to get notified when certain conditions are met. For example, you can create an alert to get notified when there is a spike in traffic.
Being able to analyze netflow data can provide you with a lot of insights about your network. You can use this data to optimize your network, identify security threats and also to bill your customers. OpenObserve and goflow2 make it very easy to analyze netflow data.
Prabhat Sharma is the founder of OpenObserve, bringing extensive expertise in cloud computing, Kubernetes, and observability. His interests also encompass machine learning, liberal arts, economics, and systems architecture. Outside of work, Prabhat enjoys spending quality time playing with his children.