Unlocking Insights from AWS Route 53 Logs: A Complete Guide


Try OpenObserve Cloud today for more efficient and performant observability.

Managing DNS traffic efficiently is critical for maintaining a robust and secure application infrastructure. AWS Route 53, a scalable and reliable DNS service, provides query logging that captures essential DNS query data. However, to make actionable insights from these logs, a systematic approach to log ingestion, transformation, and analysis is required. This guide will walk you through the end-to-end process of enabling Route 53 query logging, ingesting the logs for analysis, transforming the data for meaningful insights, and building dashboards for effective monitoring.
Before we begin, ensure the following:
/aws/route53/logs). 
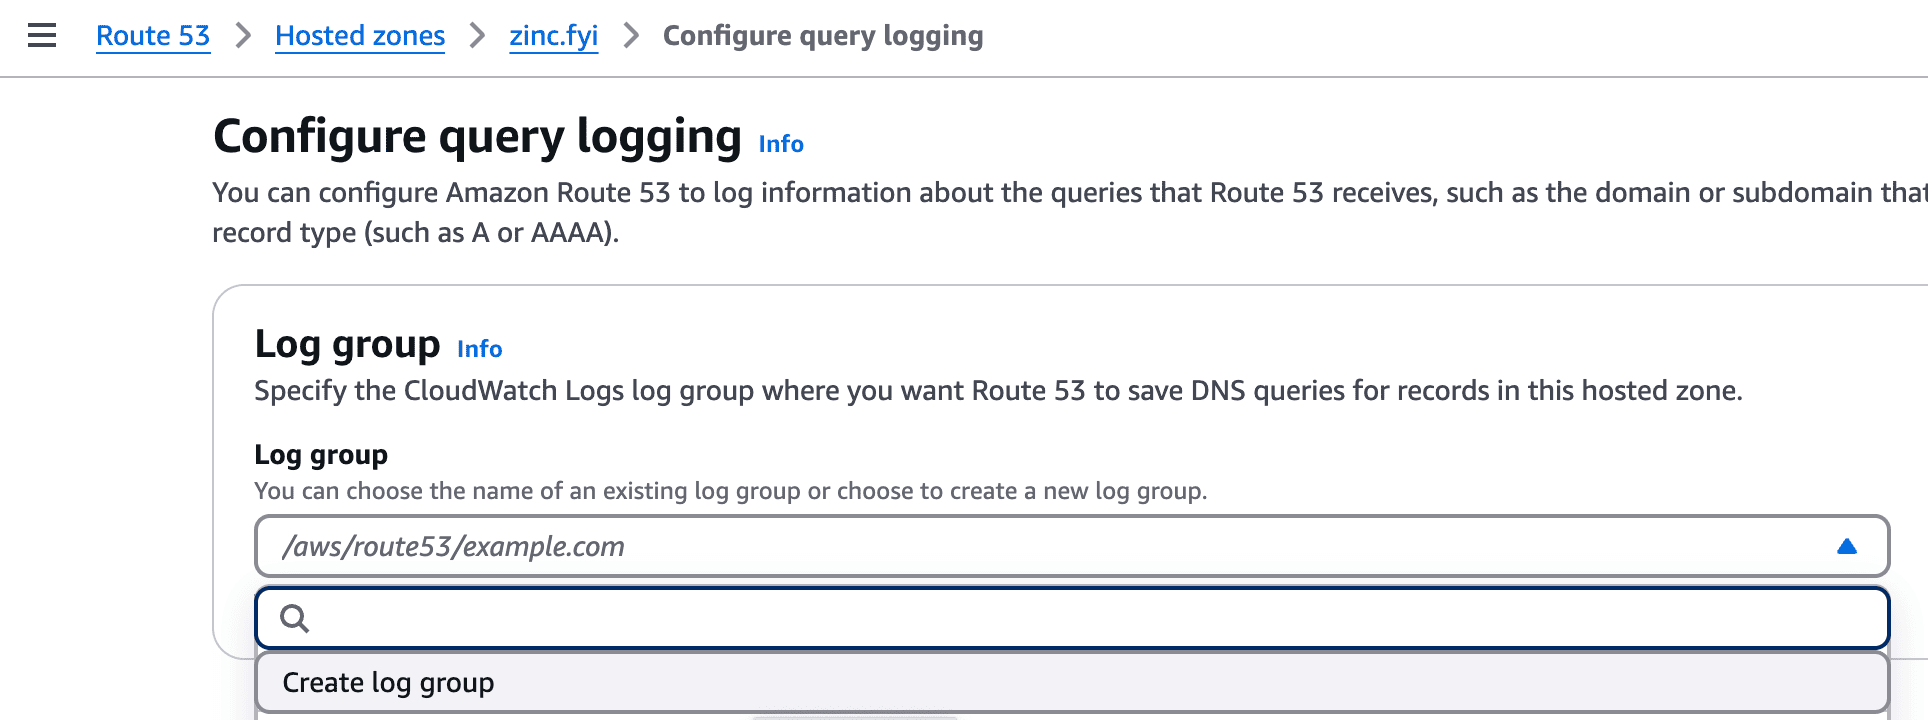
This can be achieved by following our documentation for Kinesis.
Route53 ingests the event as a single message and in order to transform it into individual attributes you can use inbuilt VRL function as mentioned below.
# Parse the message field into individual components
parsed_message = parse_regex!(.message, r'^(?P<version>\d+\.\d+) (?P<timestamp>[^ ]+) (?P<hosted_zone_id>[^ ]+) (?P<query_name>[^ ]+) (?P<query_type>[^ ]+) (?P<response_code>[^ ]+) (?P<protocol>[^ ]+) (?P<edge_location>[^ ]+) (?P<resolver_ip>[^ ]+) (?P<answer>[^ ]+)$')

# Add new fields from parsed message
.route53_version = parsed_message.version
.route53_query_timestamp = parsed_message.timestamp
.route53_hosted_zone_id = parsed_message.hosted_zone_id
.route53_query_name = parsed_message.query_name
.route53_query_type = parsed_message.query_type
.route53_response_code = parsed_message.response_code
.route53_protocol = parsed_message.protocol
.route53_edge_location = parsed_message.edge_location
.route53_resolver_ip = parsed_message.resolver_ip
.route53_answer = parsed_message.answer
.
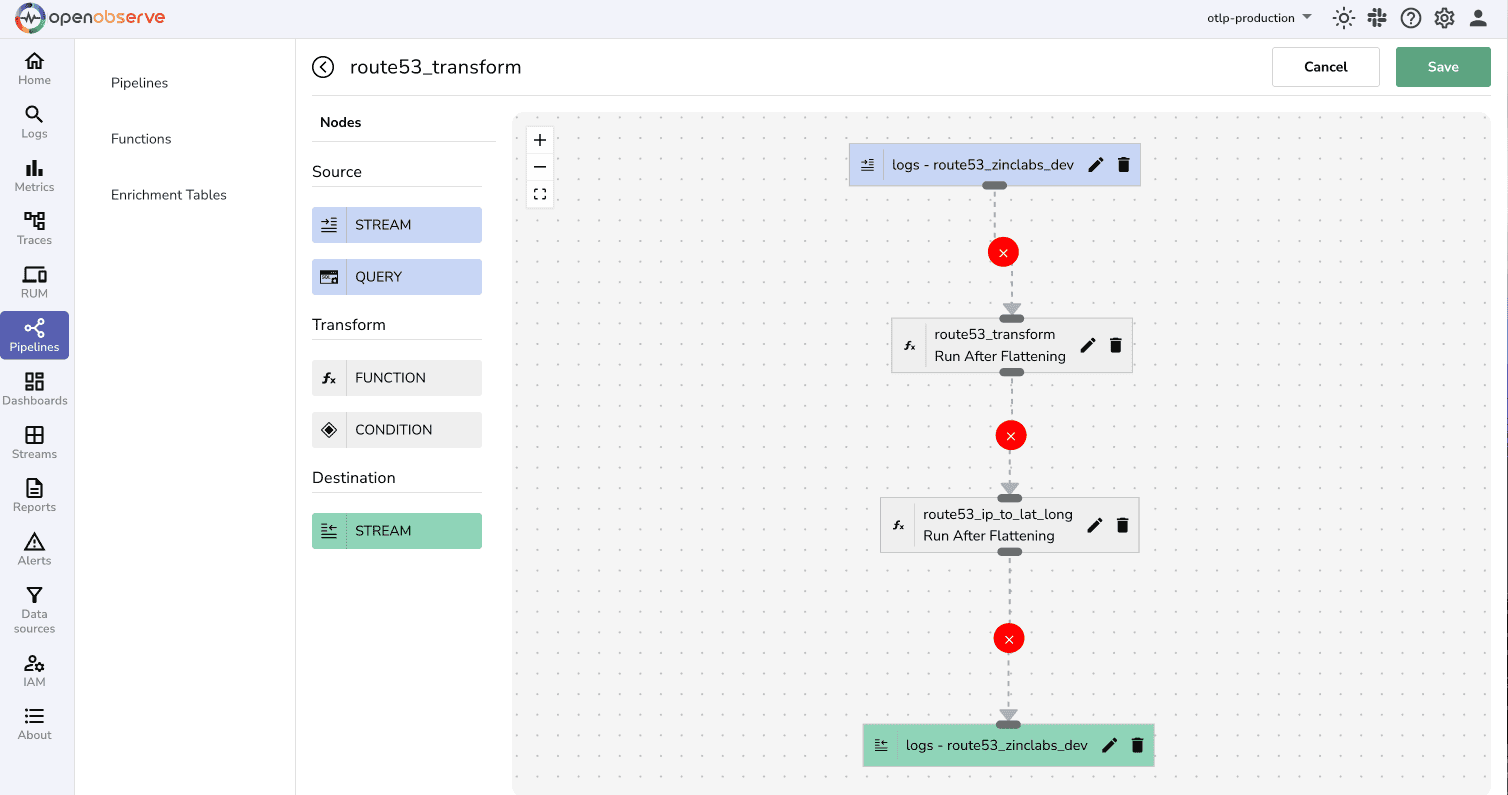
Now that you have transformed the data, you can also convert IPs to geo coordinates by using the below VRL function.
# Ensure 'route53_resolver_ip' exists and is a valid IP address (IPv4 or IPv6)
if exists(.route53_resolver_ip) && (is_ipv4(string!(.route53_resolver_ip)) || is_ipv6(string!(.route53_resolver_ip))) {
   # Perform GeoIP enrichment using the MaxMind City database
   .geo_city_data = get_enrichment_table_record!("maxmind_city", {"ip": string!(.route53_resolver_ip)})

   # Extract specific fields from the city data if enrichment is successful
   if exists(.geo_city_data) {
       .geo_city = .geo_city_data.city
       .geo_country = .geo_city_data.country
       .geo_latitude = .geo_city_data.latitude
       .geo_longitude = .geo_city_data.longitude

       # Optionally delete the raw geo_city_data field to clean up
       del(.geo_city_data)
   }

   # Perform GeoIP enrichment using the MaxMind ASN database
   .geo_asn_data = get_enrichment_table_record!("maxmind_asn", {"ip": string!(.route53_resolver_ip)})

   # Extract specific fields from the ASN data if enrichment is successful
   if exists(.geo_asn_data) {
       .geo_asn = .geo_asn_data.asn
       .geo_org = .geo_asn_data.organization

       # Optionally delete the raw geo_asn_data field to clean up
       del(.geo_asn_data)
   }
}
.
This will now help you create an OpenObserve pipeline which helps you create better dashboards with helpful insights. 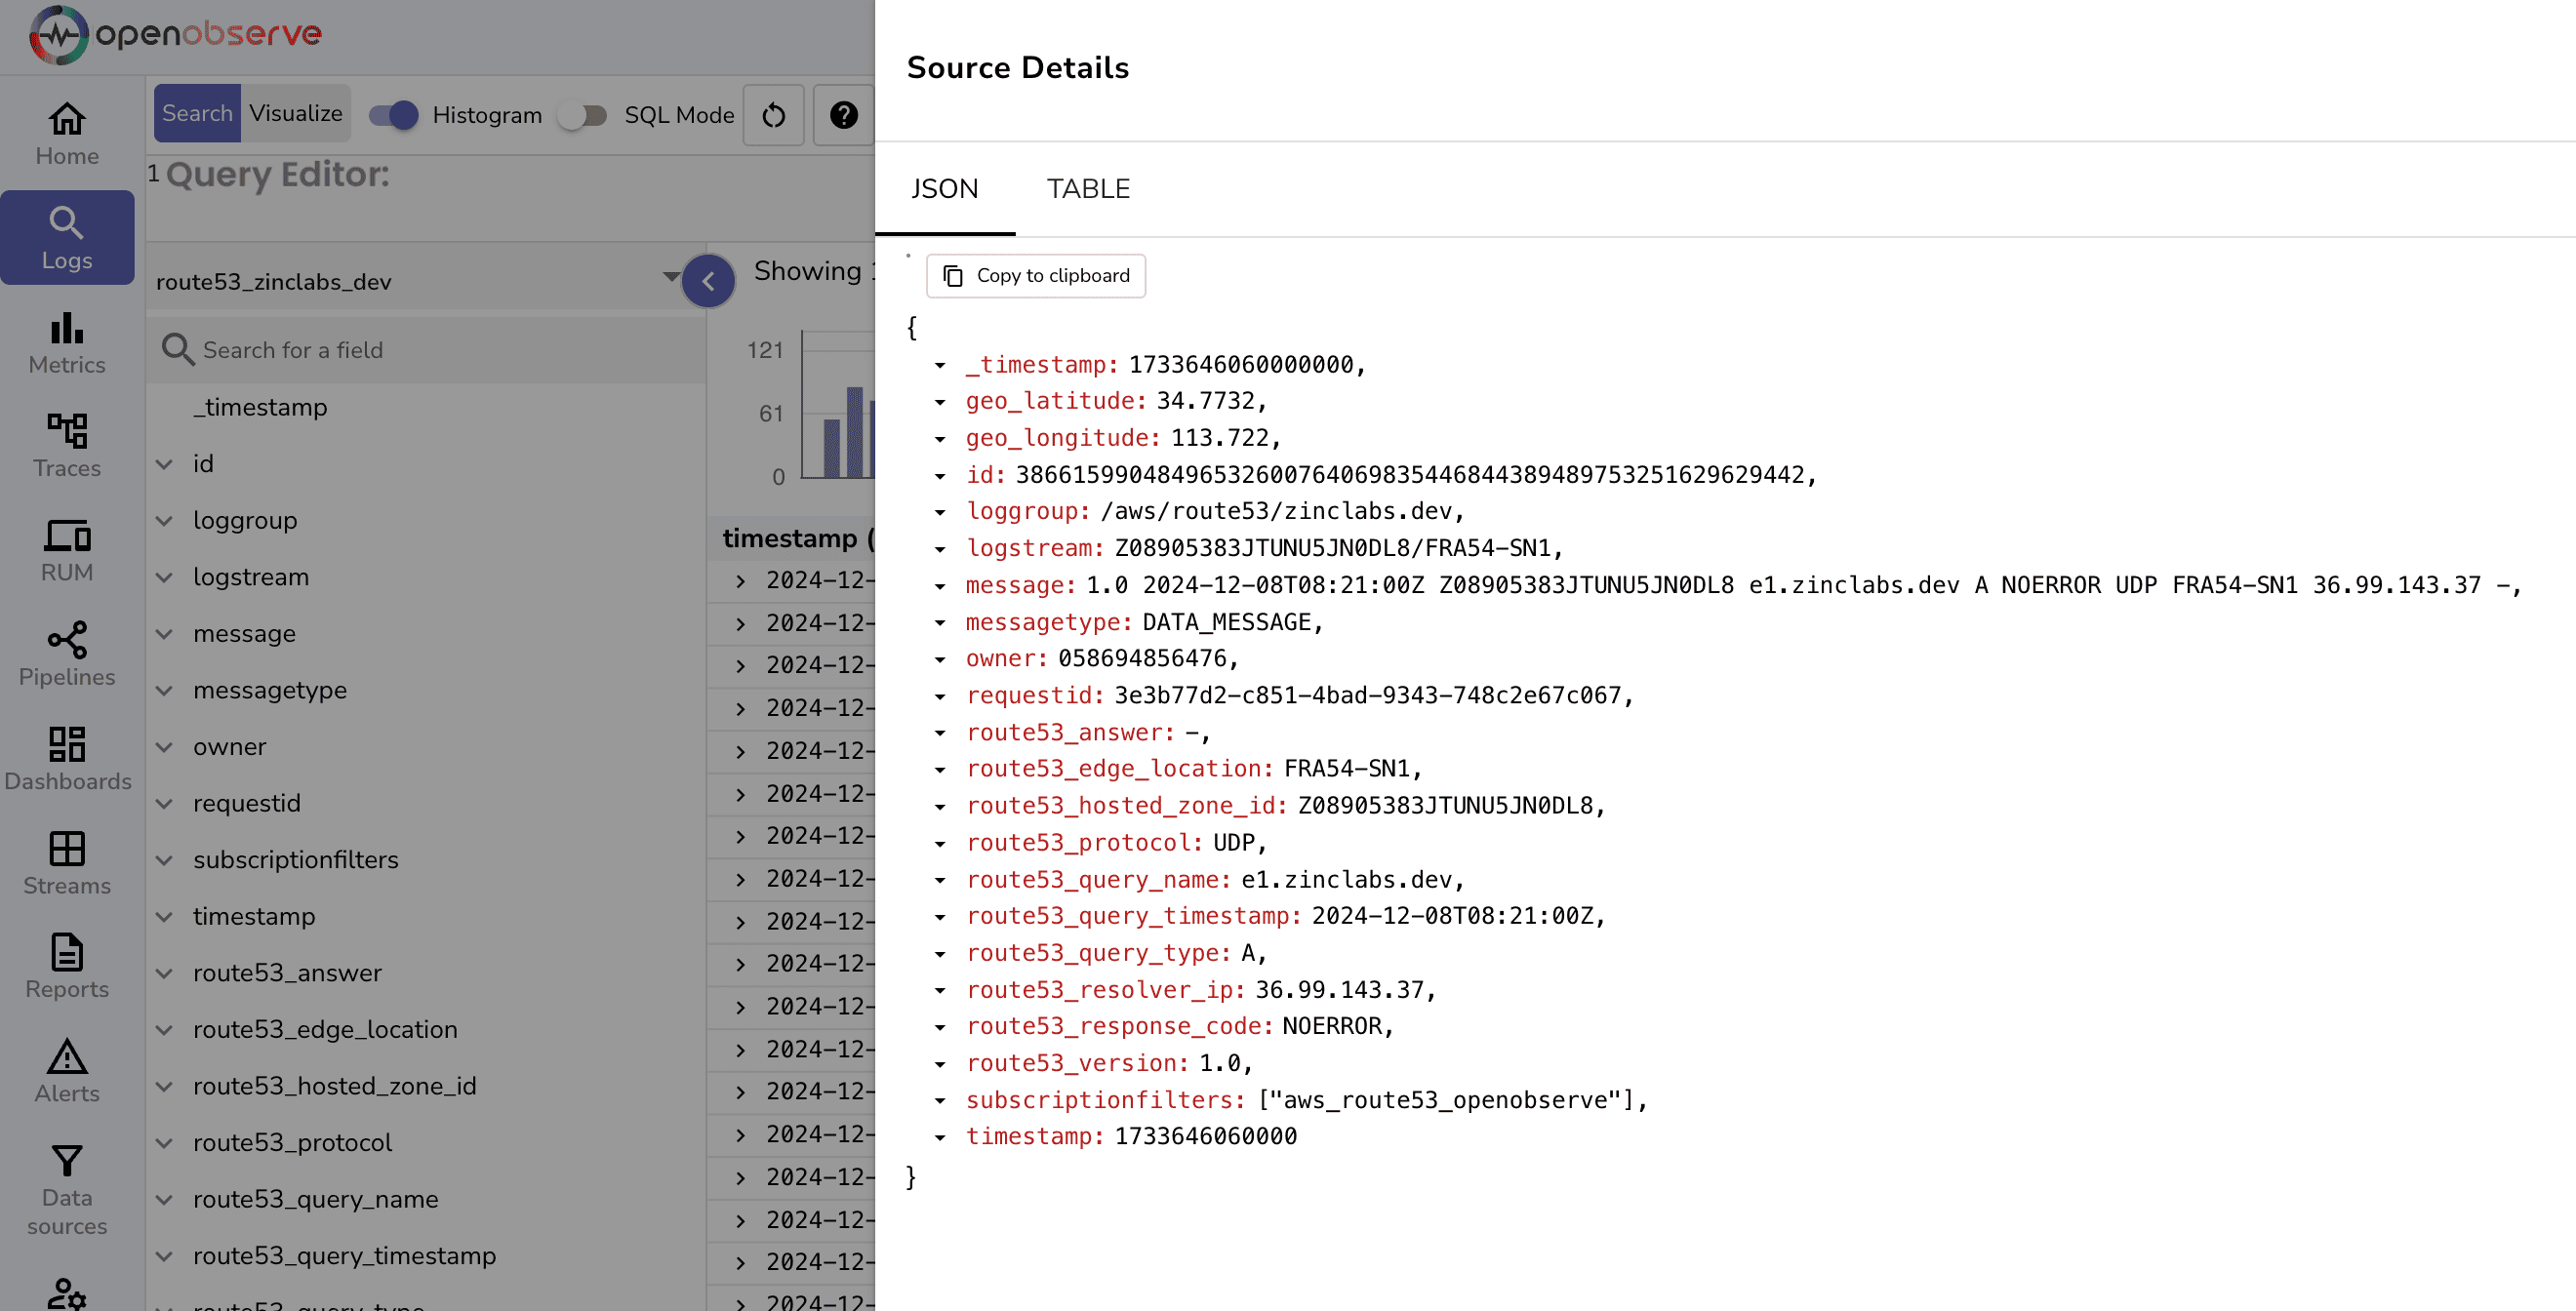
Once the logs are ingested and transformed, create dashboards to visualize DNS traffic and performance.
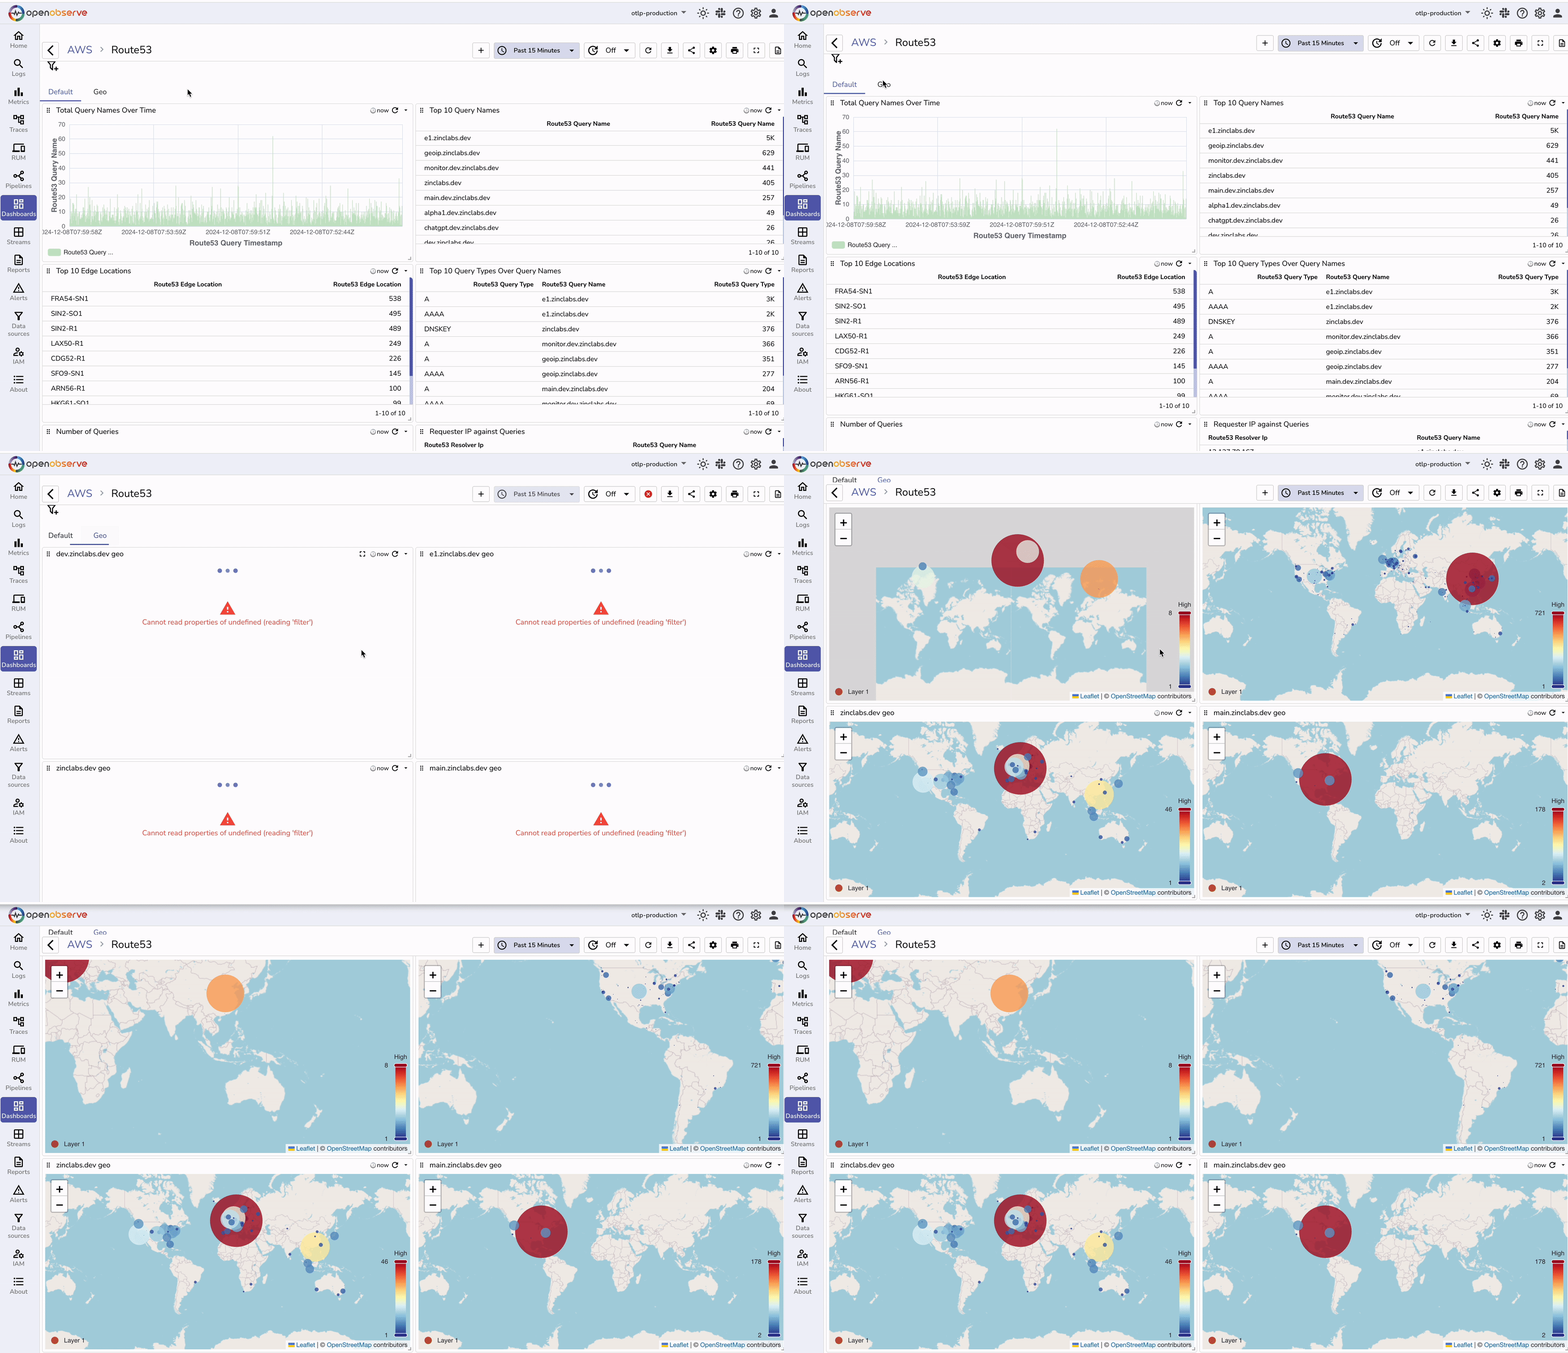
You can download our prebuilt dashboards from our git repository.
| Feature | Without Monitoring | With Monitoring |
|---|---|---|
| DNS Query Insights | No visibility into DNS query patterns. | Detailed insights into query types, names. |
| Response Code Analysis | Difficult to diagnose DNS failures. | Quick identification of NXDOMAIN, SERVFAIL. |
| Geographical Context | No knowledge of query origin. | Geographical distribution of DNS queries. |
| Trend Analysis | No historical data for troubleshooting. | Trend analysis for proactive optimization. |
| Security Monitoring | Limited ability to detect malicious activity. | Detect anomalies in DNS traffic patterns. |
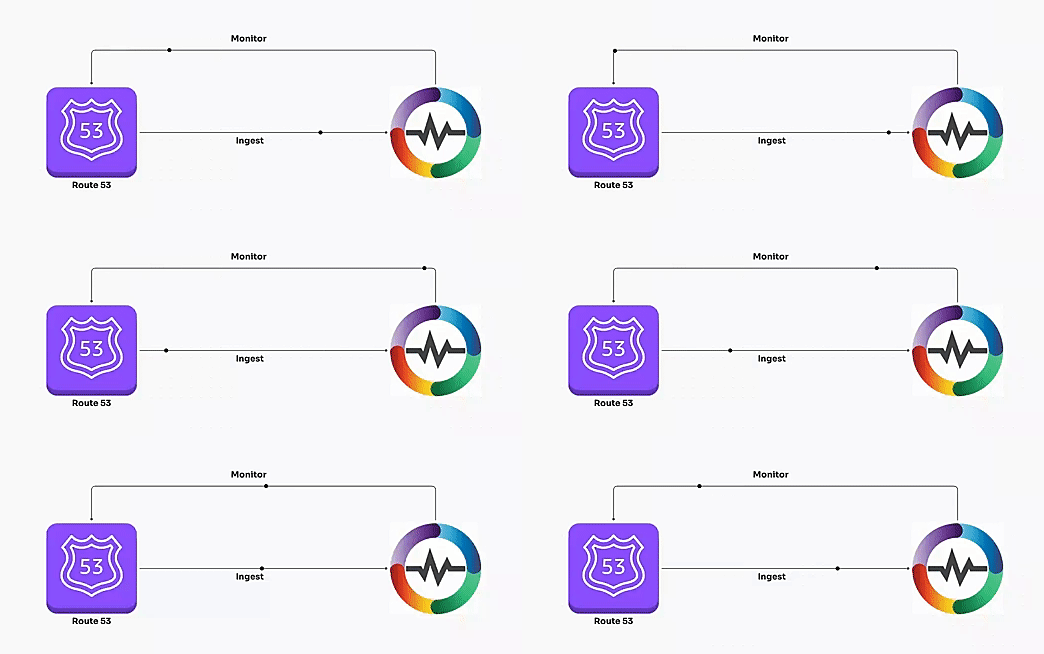 By enabling Route 53 query logging and leveraging powerful tools like Kinesis Data Firehose and VRL transformations, you can unlock actionable insights from your DNS logs. Dashboards further enhance your ability to monitor, analyze, and optimize DNS performance. This comprehensive setup transforms raw DNS logs into a goldmine of information, empowering you to make data-driven decisions and improve your infrastructure's resilience and security.
Uncover the full potential of your Route 53 logs with seamless integration and analysis using OpenObserve. Transform raw data into actionable insights, optimize your DNS traffic, and strengthen your infrastructure with advanced dashboards and monitoring.
Visit our website to learn how to get started and elevate your observability game today!

Chaitanya Sistla is a Principal Solutions Architect with 17X certifications across Cloud, Data, DevOps, and Cybersecurity. Leveraging extensive startup experience and a focus on MLOps, Chaitanya excels at designing scalable, innovative solutions that drive operational excellence and business transformation.