Top 10 Datadog Competitors in 2026: In-Depth Comparison for DevOps & SRE Teams

Simran Kumari
March 12, 2026
23 min read
Don’t forget to share!
Try OpenObserve Cloud today for more efficient and performant observability.
Datadog is one of the most recognized cloud monitoring and observability platforms on the market. It unifies metrics, logs, traces, and Application Performance Monitoring (APM) into a single SaaS solution with powerful dashboards and hundreds of integrations. So why are engineering teams actively searching for Datadog competitors?
The answer almost always comes down to four pain points:
1. Unpredictable, Rapidly Escalating Costs
Datadog charges per host, per metric, per log ingested, and per span indexed. As infrastructure grows , especially in Kubernetes environments with thousands of ephemeral pods , bills scale in ways that are hard to forecast. Teams frequently report bill shock when migrating to microservices or enabling custom metrics, which Datadog can auto-generate in large quantities. See how Datadog's hidden pricing mechanics compare to OpenObserve in a real metrics cost analysis.
2. Data Sovereignty and Compliance Requirements
Regulated industries (healthcare, finance, government) often cannot send telemetry data to a third-party US-based SaaS. They need on-premises deployments or region-specific data residency , something Datadog's core product doesn't natively support.
3. Vendor Lock-In
Datadog uses proprietary agents, proprietary query languages, and proprietary data formats. Switching away means re-instrumenting every service from scratch , a prospect that keeps teams locked in even when they're unhappy.
4. Over-Engineering for Simpler Use Cases
Some teams only need solid log analytics or lightweight infrastructure metrics. Paying Datadog's premium for features they'll never use doesn't make sense. Competitors often deliver purpose-built tooling at a fraction of the cost.
Before evaluating any specific tool, establish your selection criteria. The right Datadog competitor for a 50-person startup looks very different from the right choice for a Fortune 500 enterprise. Here are the dimensions that matter most:
| Criterion | Why It Matters |
|---|---|
| Unified Observability | Avoid tool sprawl , look for a single pane covering metrics, logs, and traces |
| Pricing Model | Understand what drives costs: hosts, data volume, users, or features |
| Deployment Flexibility | SaaS, self-hosted, or hybrid , match your compliance and ops requirements |
| OpenTelemetry Support | OTel-native tools protect you from future vendor lock-in |
| Query Language | PromQL, SQL, proprietary DSL , choose what your team already knows |
| High-Cardinality Handling | Critical for user-level tracing and request-ID correlation |
| Migration Path | How painful is the switch? Does it require code changes? |
| Alerting Quality | Flexible alert conditions, multi-channel notifications, SLO support |
| Community & Ecosystem | Active OSS communities reduce long-term risk |
| Scalability | Ingestion throughput and query performance at production scale |
Here's a quick orientation before we dive deep into each tool:
Best for: Teams wanting a unified, open-source Datadog replacement with significantly lower costs
Official Site: openobserve.ai | GitHub: openobserve/openobserve | Cloud: cloud.openobserve.ai
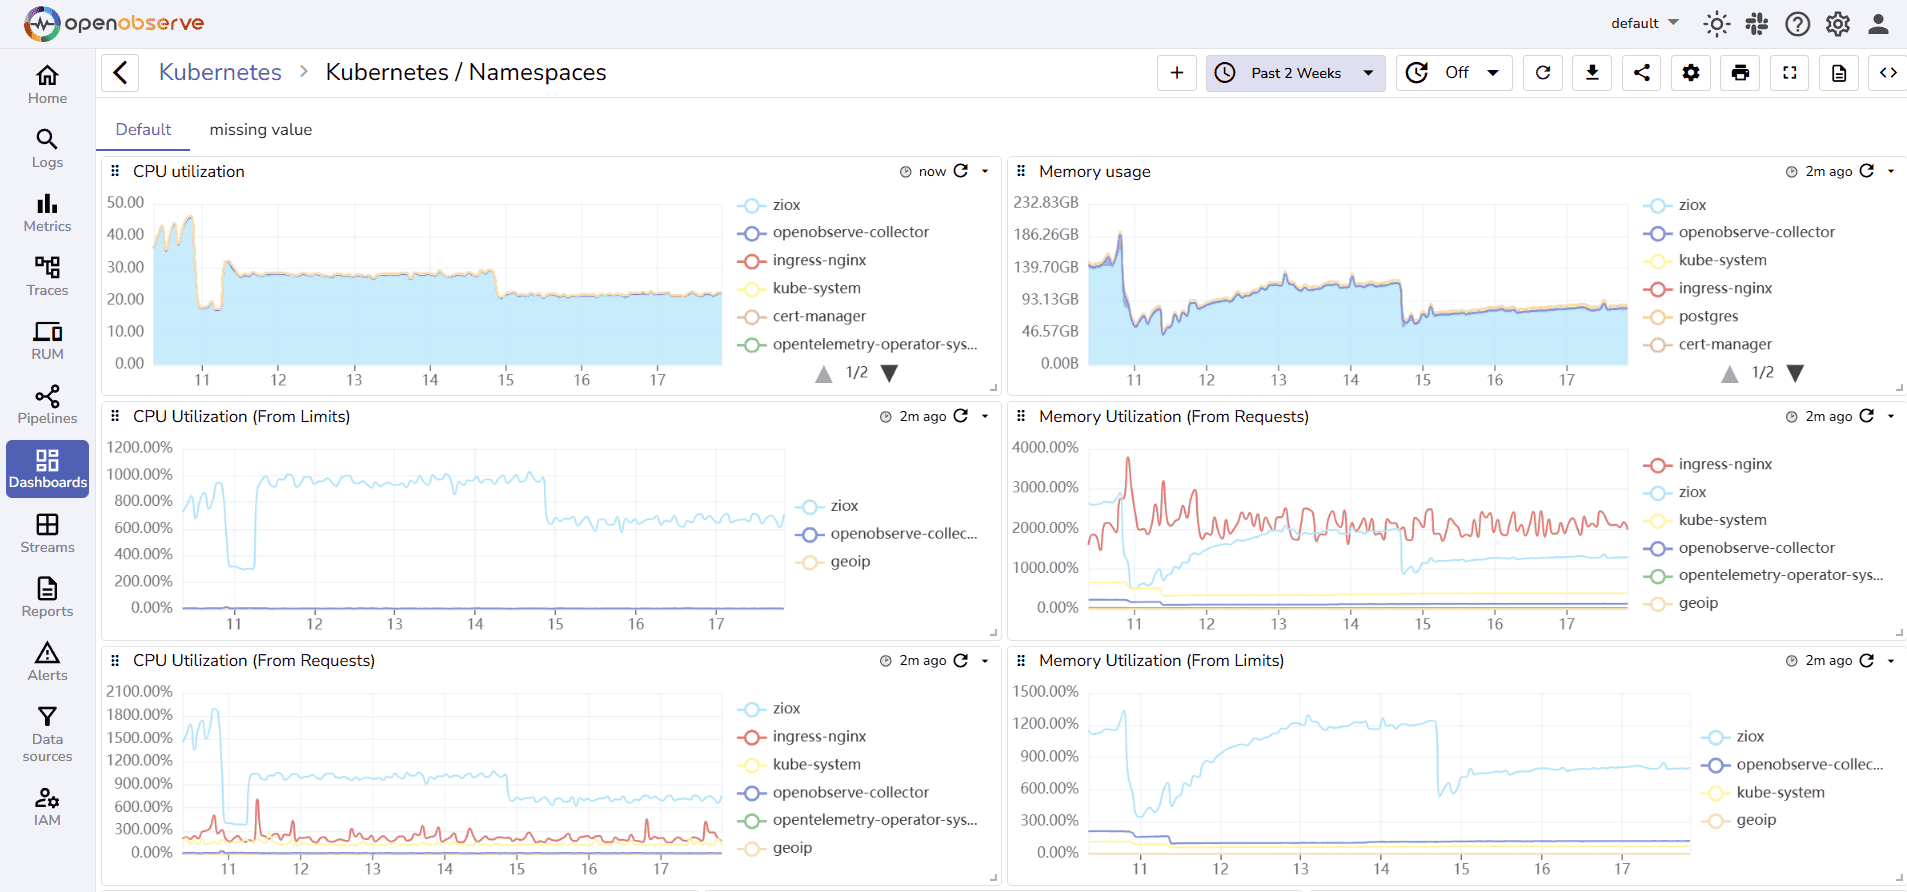
OpenObserve is a modern, open-source observability platform that covers logs, metrics, and traces in a single unified interface , the same experience Datadog promises, but without usage-based pricing that spirals as you scale. It is built around 140x compression technology that dramatically reduces storage requirements and ingestion costs compared to traditional observability backends.
What makes OpenObserve stand out as a Datadog competitor is its combination of architectural simplicity and operational power. It replaces the need for separate tools for each observability signal. Teams migrating from Datadog can route existing telemetry through the OpenTelemetry Collector and start ingesting data into OpenObserve without touching a single line of application code.
The OpenObserve team has published an extensive series comparing every dimension of the two platforms head-to-head:
| Comparison Area | Article |
|---|---|
| Full Platform Overview | Datadog vs OpenObserve , Complete Comparison |
| Log Management | Log search, retention policies, cost per GB |
| Metrics & Custom Metrics Pricing | PromQL support, high-cardinality, billing analysis |
| Traces & APM | Service maps, flamegraphs, distributed tracing |
| Dashboards | Real test data showing 98% cost savings |
| Alerts & Monitoring | SQL-based alerts vs. Datadog monitor syntax |
| Migration Guide | Step-by-step: Migrate Datadog metrics via OpenTelemetry |
Kubernetes-heavy environments, cost-conscious engineering teams, companies with data residency requirements, and any organization looking to escape Datadog's vendor lock-in while maintaining unified observability.
→ Download OpenObserve (self-hosted) | Start OpenObserve Cloud free
Best for: Teams with strong DevOps/SRE capabilities who want maximum flexibility through best-in-class open-source components
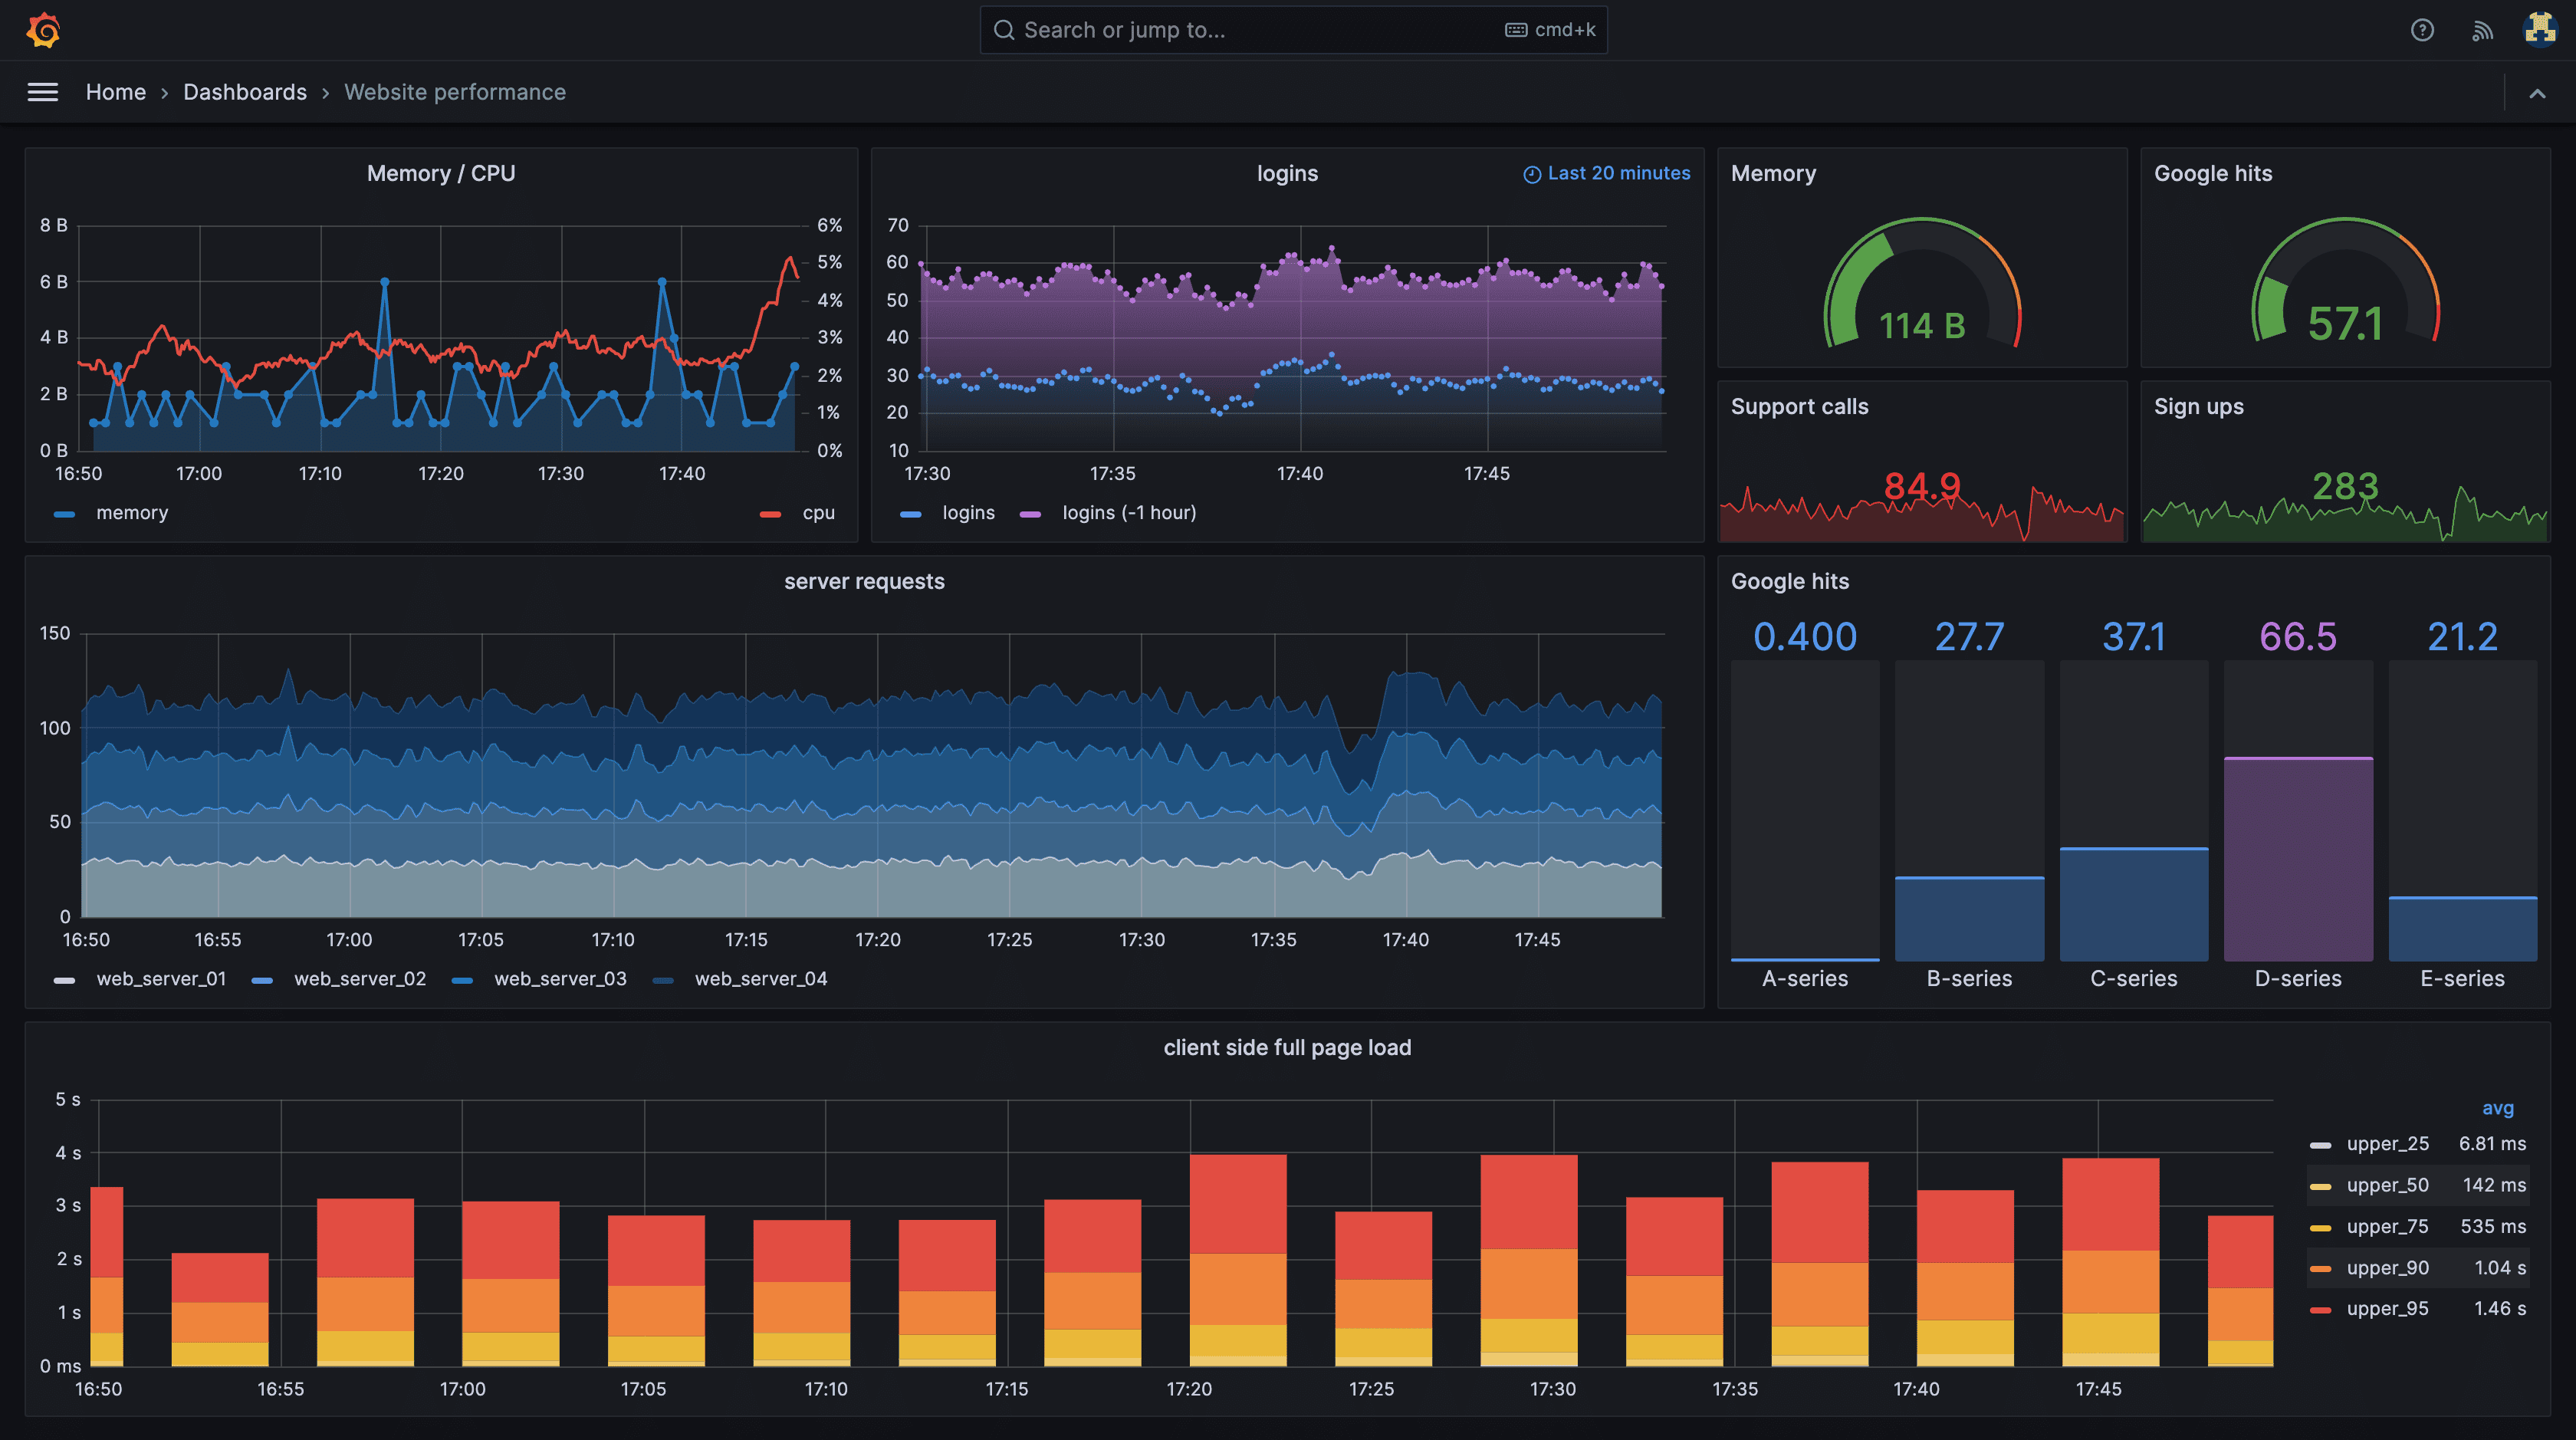
The Grafana stack is arguably the most widely deployed open-source alternative to Datadog's unified offering. Rather than a single product, it's a curated combination of tools: Prometheus for metrics, Loki for logs, Tempo for distributed traces, and Grafana as the visualization and alerting layer that ties everything together.
This modular approach is both the stack's greatest strength and its primary challenge. You can adopt components incrementally , starting with Prometheus for Kubernetes metrics while keeping Datadog for logs , and evolve your stack at your own pace. But you're also responsible for operating, scaling, and integrating multiple systems.
Organizations with mature platform engineering teams, those already invested in the CNCF ecosystem, and teams that want full control over every layer of their observability stack.
Also see: Top 10 Grafana Alternatives in 2026 , if Grafana itself isn't meeting your needs.
Best for: Teams currently using Datadog who want a SaaS switch with minimal workflow disruption
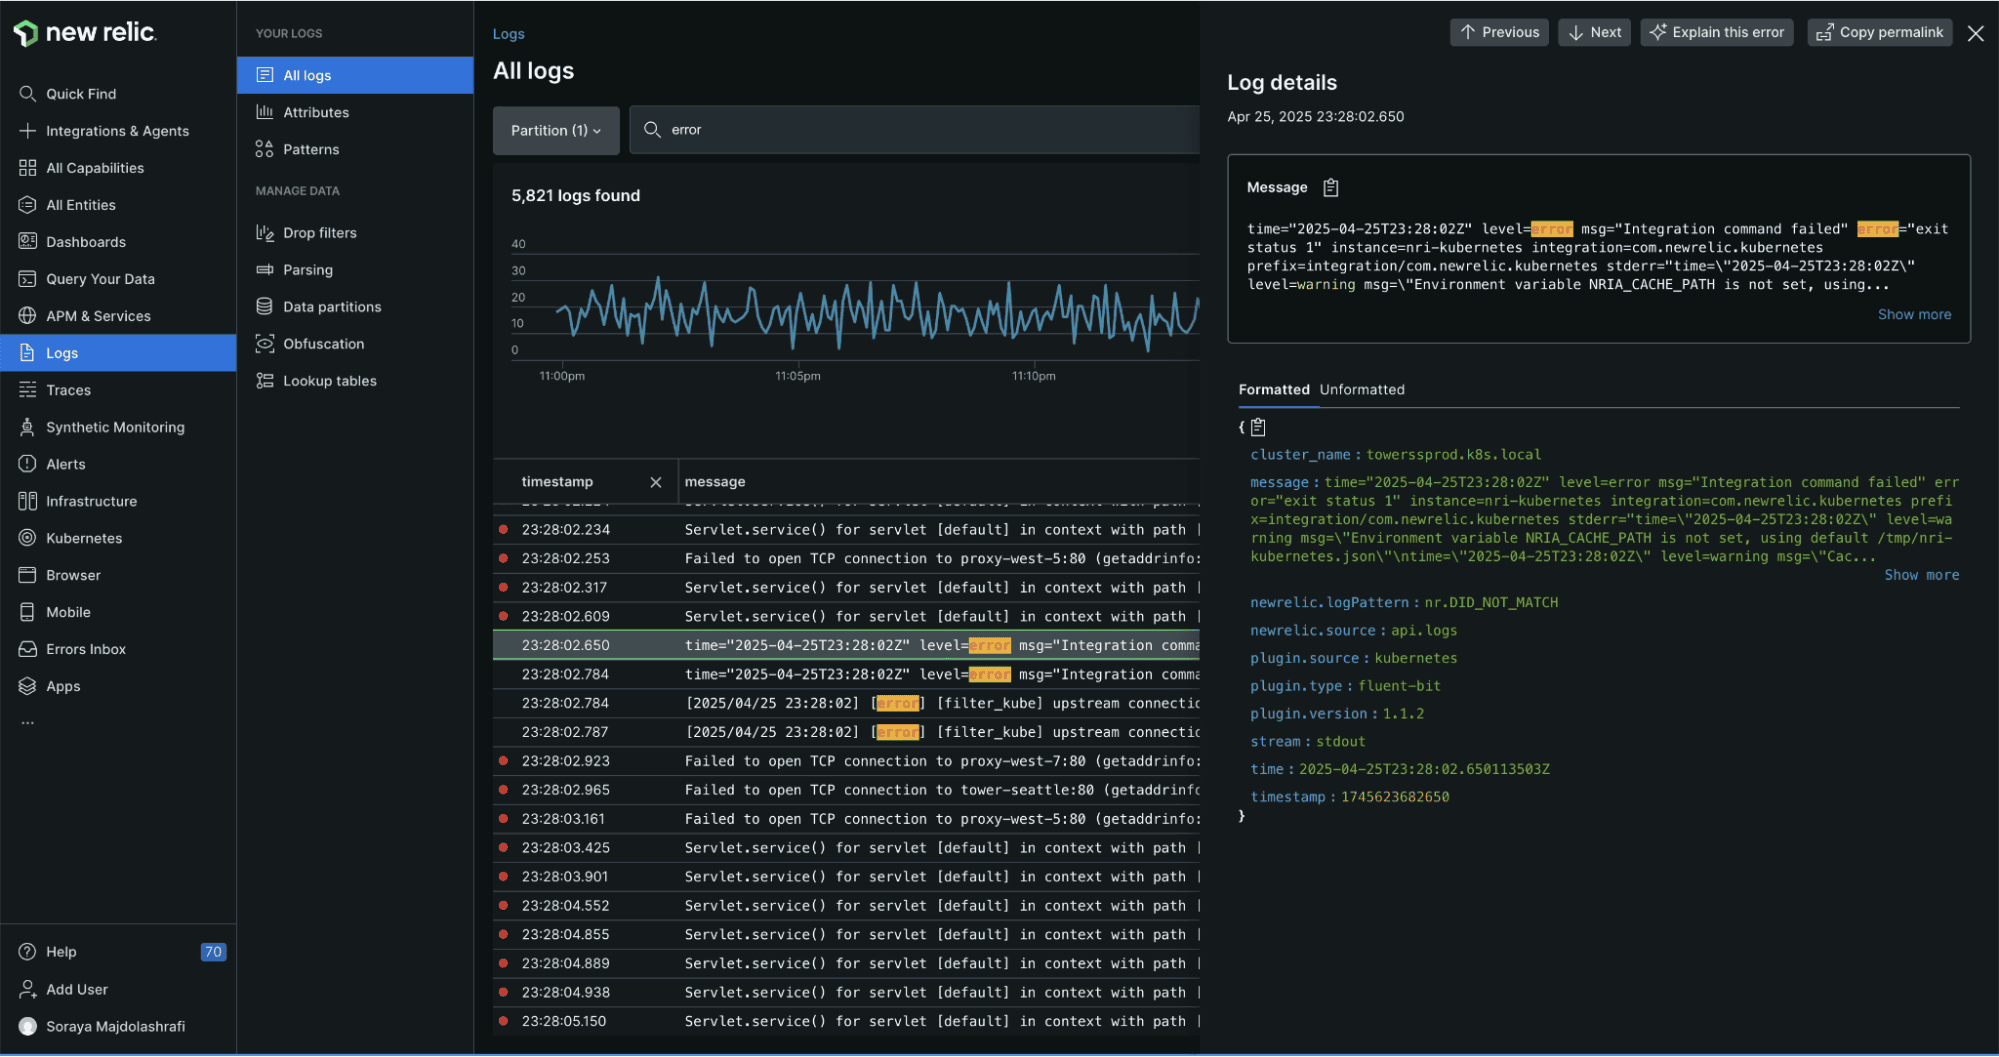
New Relic is the closest like-for-like SaaS Datadog competitor. It offers a similarly unified observability experience , metrics, logs, traces, Real User Monitoring (RUM), and synthetic monitoring , in a single platform with a polished interface that Datadog users will find intuitive from day one.
New Relic's shift to user-based pricing in recent years made it significantly more competitive for infrastructure-heavy deployments. However, ingestion volume still drives costs, and large data volumes can still produce substantial bills.
Mid-market and enterprise teams currently on Datadog who need to cut costs without retraining their engineers or rebuilding their dashboards and alert logic.
Also see: Top 10 New Relic Alternatives in 2026 , if New Relic's pricing also becomes a concern.
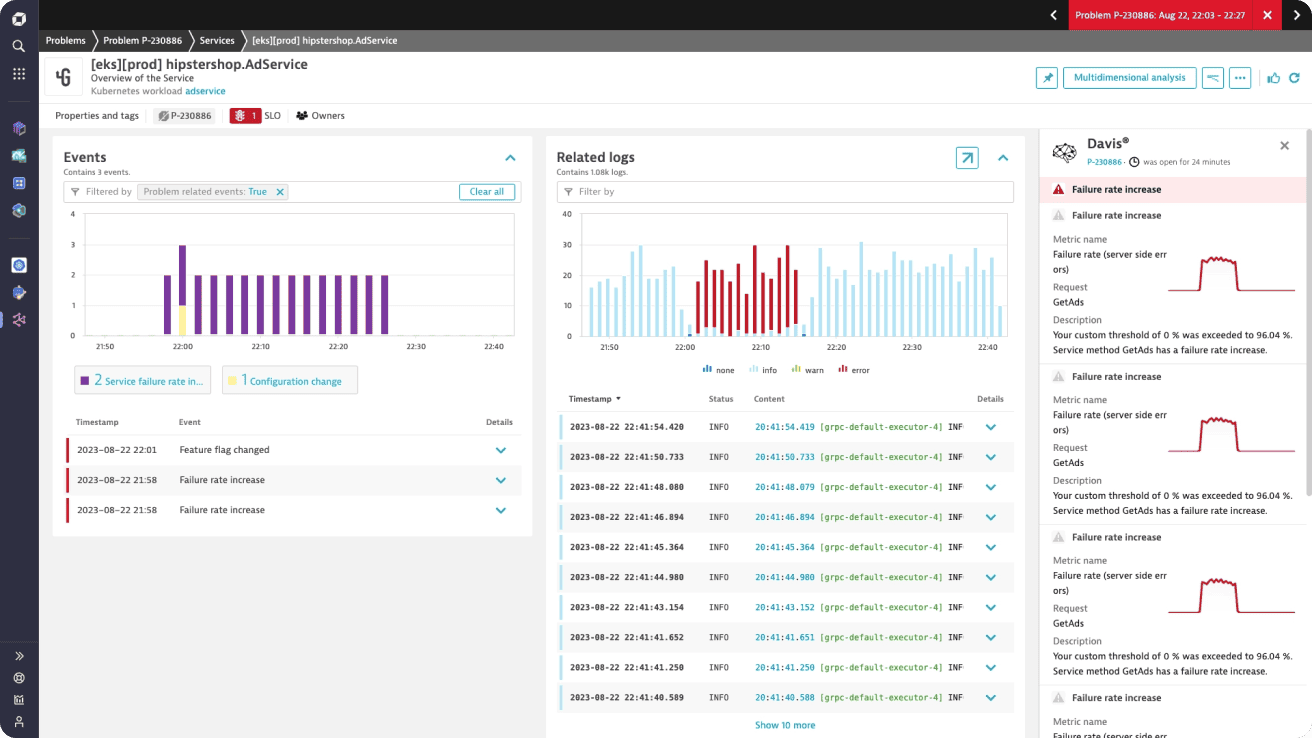
Best for: Large enterprises that need automated full-stack instrumentation and AI-assisted root cause analysis
Dynatrace targets the upper end of the enterprise market with its fully automated instrumentation approach. Its OneAgent technology auto-discovers and instruments every component of your stack , from infrastructure hosts to application code to end-user sessions , with minimal manual configuration. This is a meaningful advantage over Datadog for large, complex environments where manual instrumentation at scale becomes operationally burdensome.
The Davis AI engine continuously analyzes telemetry across all signals and automatically correlates anomalies to probable root causes, substantially reducing mean time to resolution (MTTR) for large on-call teams.
Large enterprises replacing Datadog at scale who need automated instrumentation, AI-driven operations, and can justify a premium price tag for reduced operational overhead.
Also see: Top 10 Dynatrace Alternatives in 2026 , if Dynatrace's cost profile isn't a fit either.
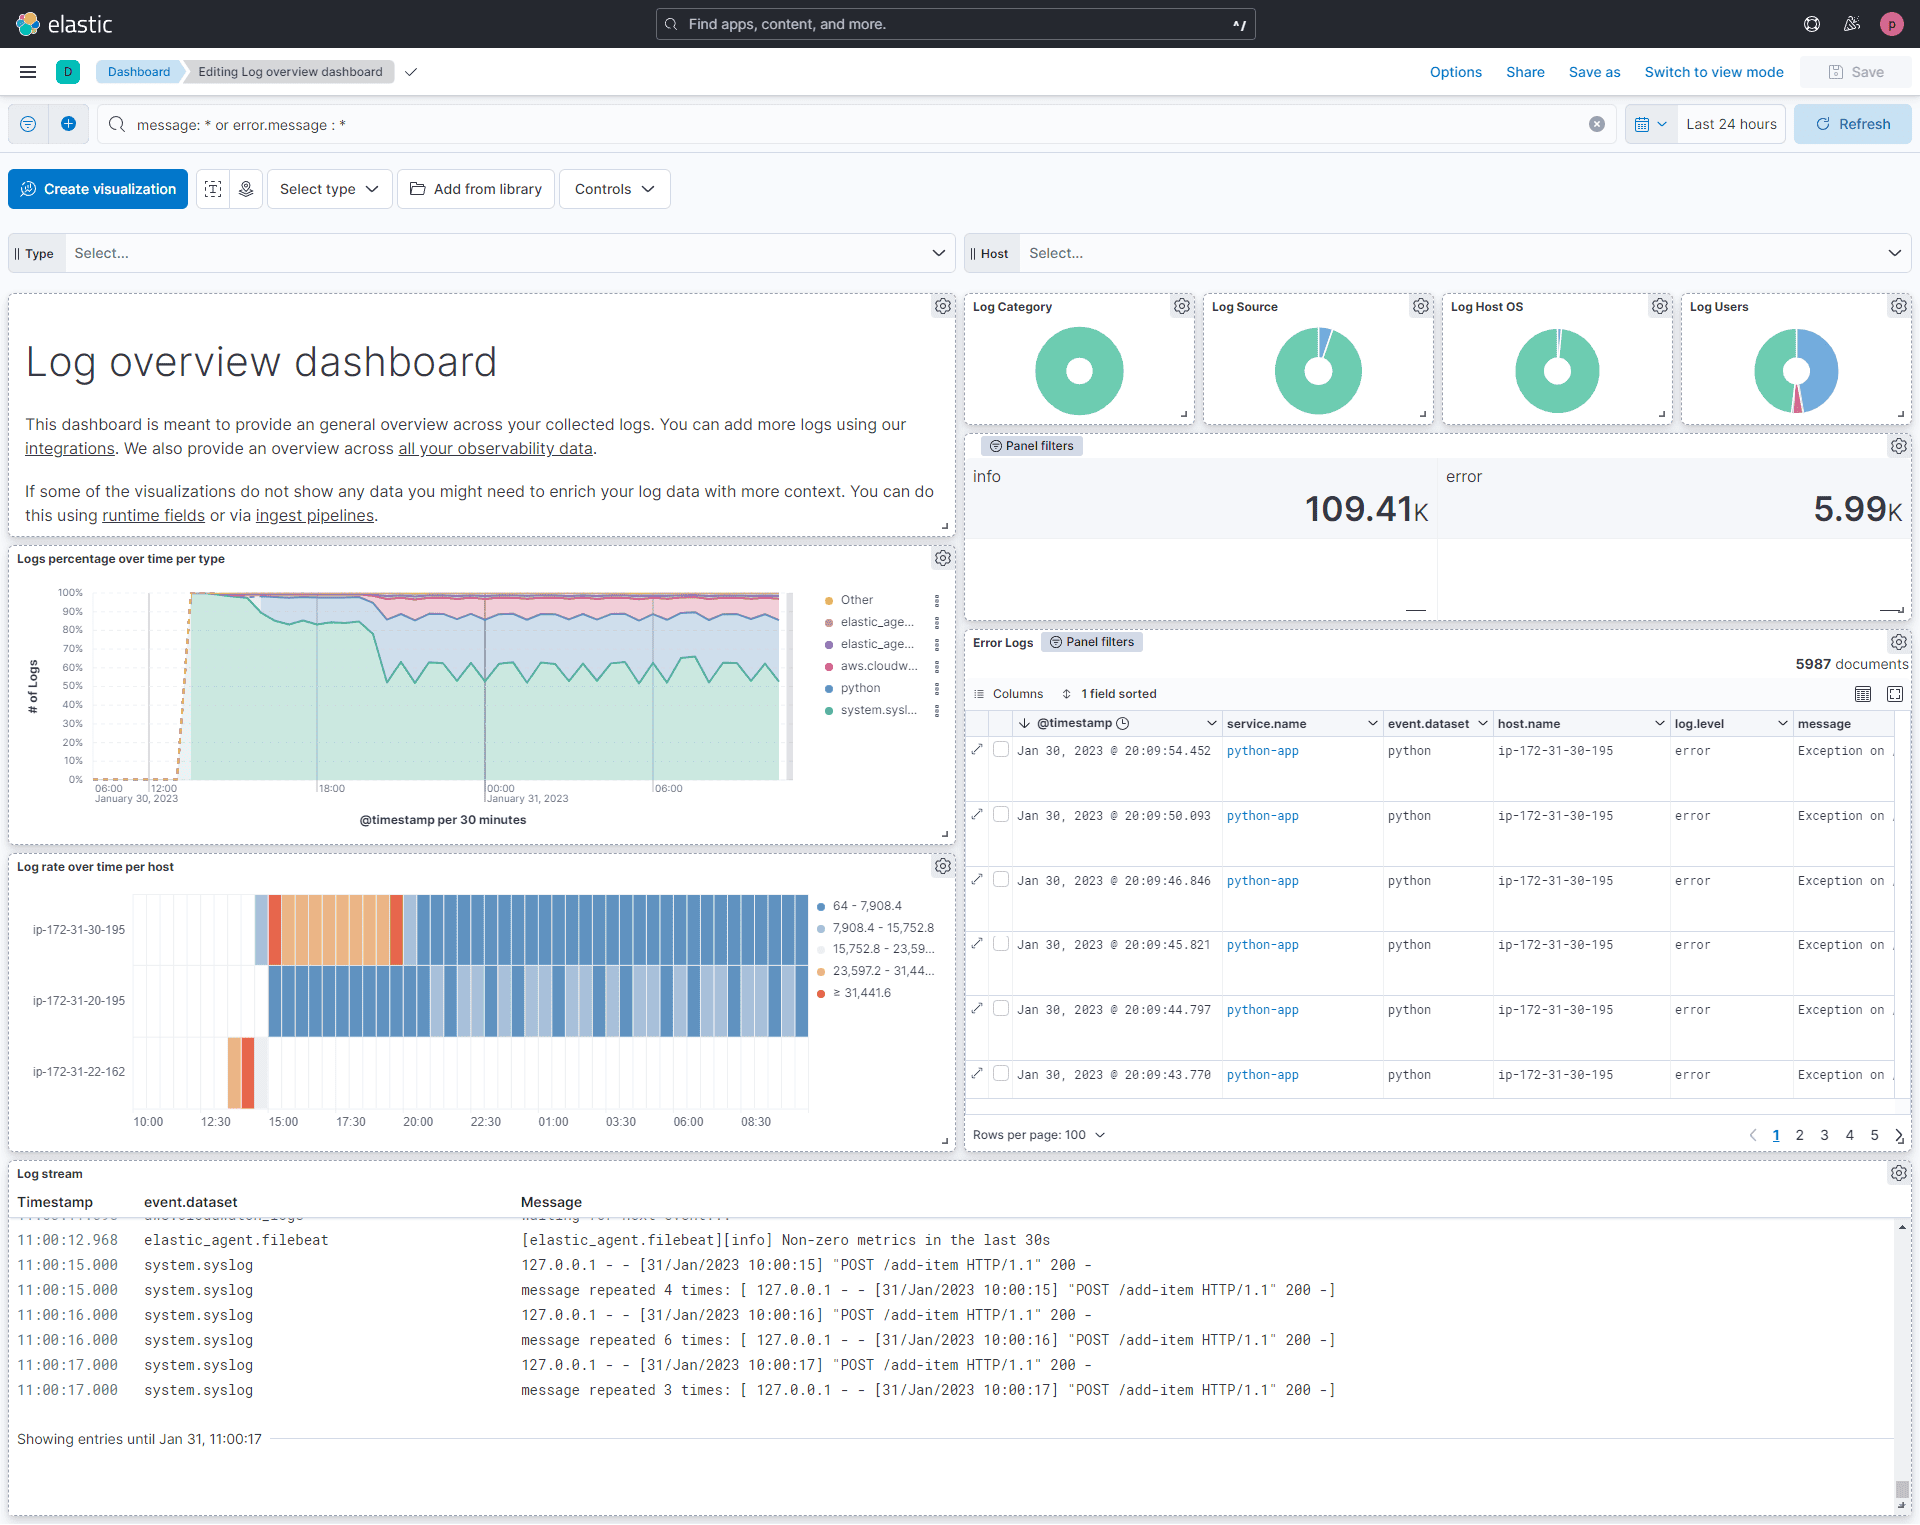
Best for: Teams with strong log analytics requirements and existing Elasticsearch expertise
Elastic Observability extends the famous ELK Stack (Elasticsearch, Logstash, Kibana) into a full observability platform covering logs, metrics, and APM traces. Elasticsearch's powerful full-text and structured search capabilities make it exceptional for log analytics workloads , particularly for teams dealing with complex log correlation or compliance-driven log retention.
Elastic is available as a fully managed Elastic Cloud service or as a self-hosted deployment, giving teams deployment flexibility similar to the Grafana stack.
Teams with existing Elasticsearch expertise, log-centric observability workflows, or organizations that need to combine security event monitoring with application observability.
Also see: Top 10 Elasticsearch Alternatives in 2026 , for a full comparison of search and log backends.
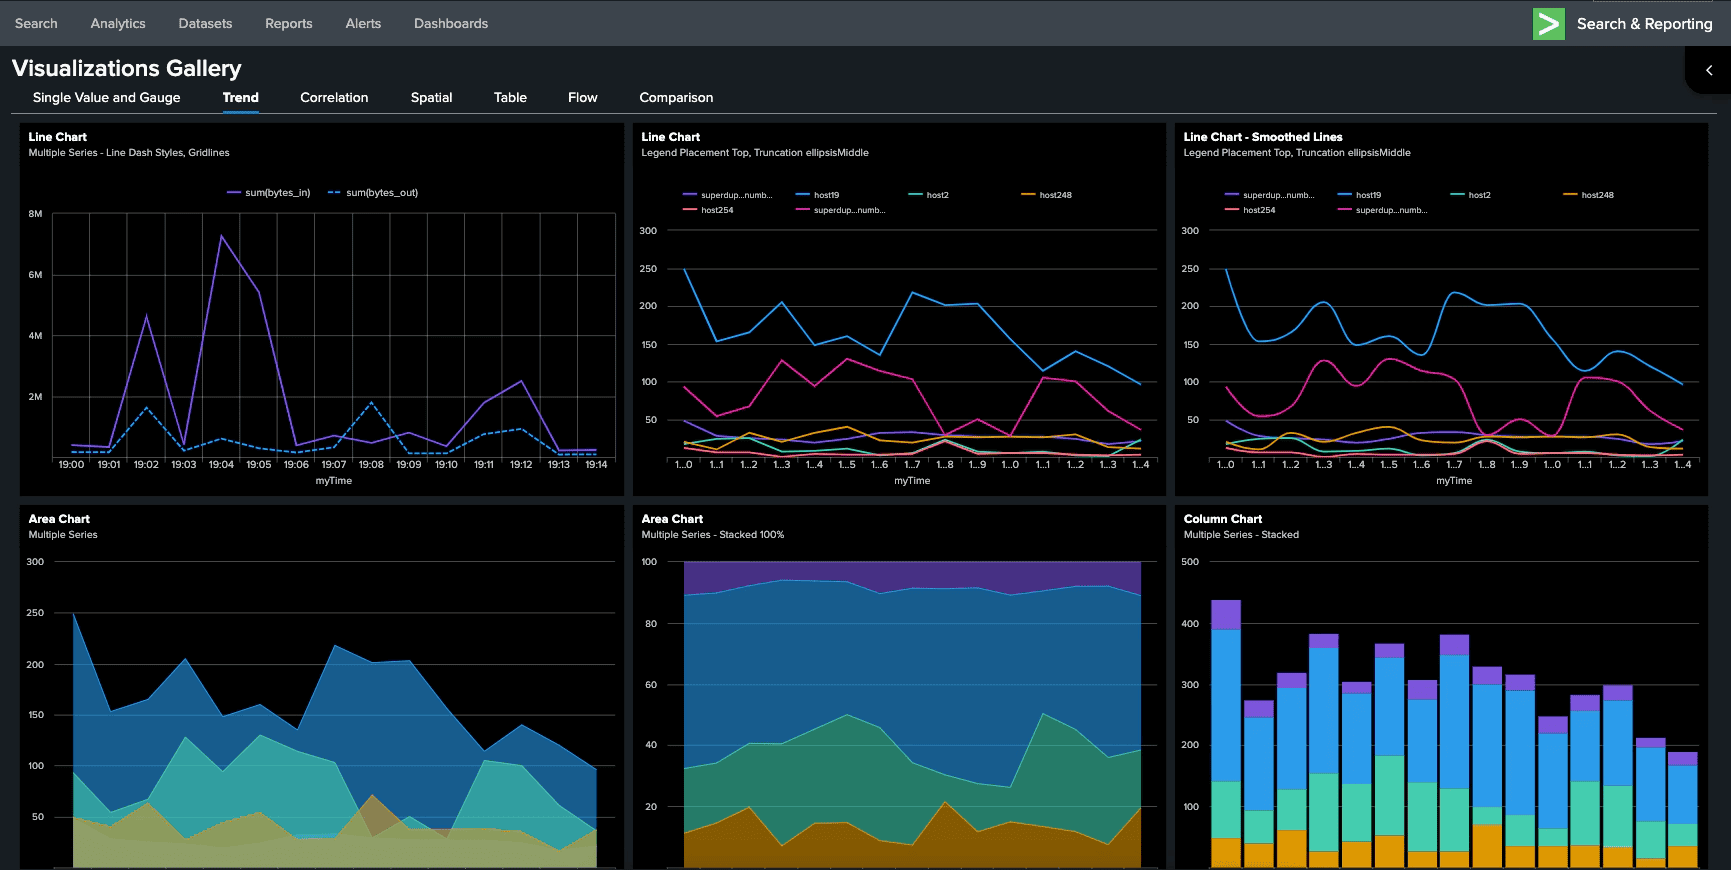
Best for: Enterprises prioritizing compliance, security, and advanced analytics over pure cost efficiency
Splunk is the incumbent leader in enterprise log analytics and SIEM. Its Search Processing Language (SPL) is extraordinarily powerful for complex event correlation, compliance reporting, and security forensics. Organizations in highly regulated industries , government, finance, healthcare , often already have Splunk for security and extend it to operational observability as well.
Enterprise organizations where observability and security monitoring must share a single platform, and where compliance requirements justify premium pricing.
Best for: Engineering teams debugging complex distributed systems and microservices at high cardinality
Honeycomb takes a fundamentally different approach to observability than most Datadog competitors. Rather than organizing around metrics, logs, and traces as separate signals, Honeycomb is built around events , arbitrary key-value payloads that capture everything about a request at the moment it happens. This event-centric model is exceptionally powerful for debugging unknown unknowns in production microservices.
Honeycomb excels at high-cardinality analysis. Where Datadog charges extra for custom metrics and degrades performance at high cardinality, Honeycomb is purpose-built for querying across millions of unique dimension values (user IDs, request IDs, feature flags) with fast, ad-hoc exploratory queries.
Developer-centric teams running complex microservices architectures who need superior distributed tracing and are willing to pair Honeycomb with a separate metrics/log tool.
Best for: Large enterprises monitoring business transactions in complex hybrid and legacy environments
AppDynamics, now part of Cisco, is a mature APM platform that maps technical performance directly to business outcomes , a differentiator for organizations where application performance has direct revenue impact. Its business transaction monitoring capability shows not just that a service is slow, but exactly which customer flows and revenue-generating transactions are affected.
The Cognition Engine provides AI-powered root cause analysis similar to Dynatrace's Davis AI, automatically correlating performance anomalies across infrastructure and application layers.
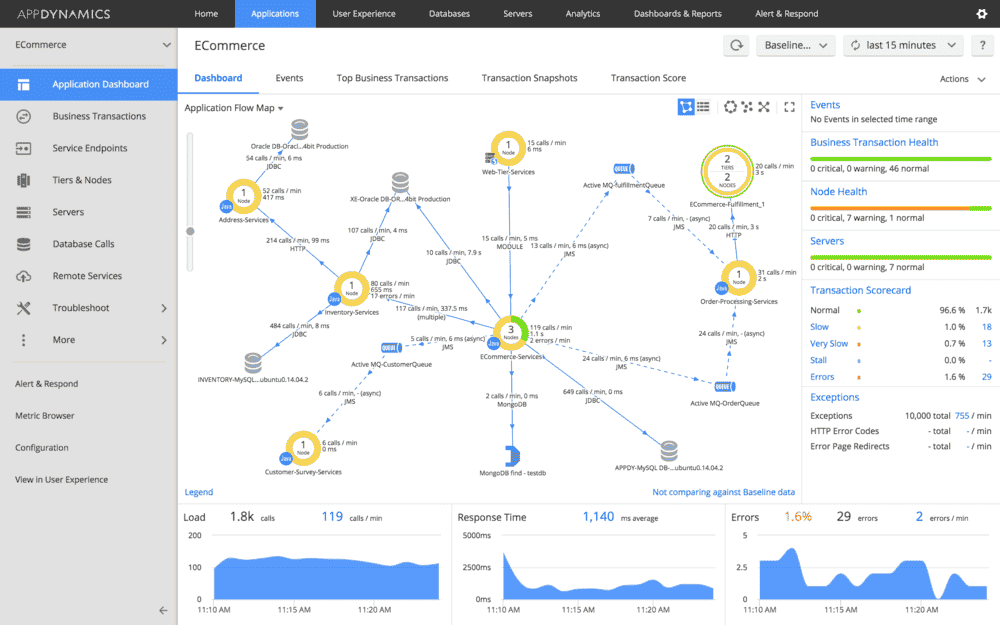
Large enterprises with complex hybrid environments, significant on-premises infrastructure, and existing Cisco tooling investments.
Best for: Teams that need free, self-hosted infrastructure monitoring without APM requirements
Zabbix is a fully open-source, zero-cost infrastructure monitoring platform with a long track record in enterprise environments. It excels at traditional host, network, and server monitoring , CPU, memory, disk I/O, network throughput, SNMP devices , and provides robust alerting with flexible escalation policies.
As a Datadog competitor, Zabbix only covers a portion of Datadog's functionality. There is no native APM, no distributed tracing, and log analytics capabilities are limited. But for teams that primarily need infrastructure monitoring and cannot spend money on SaaS tools, Zabbix delivers genuine enterprise-grade functionality at zero licensing cost.
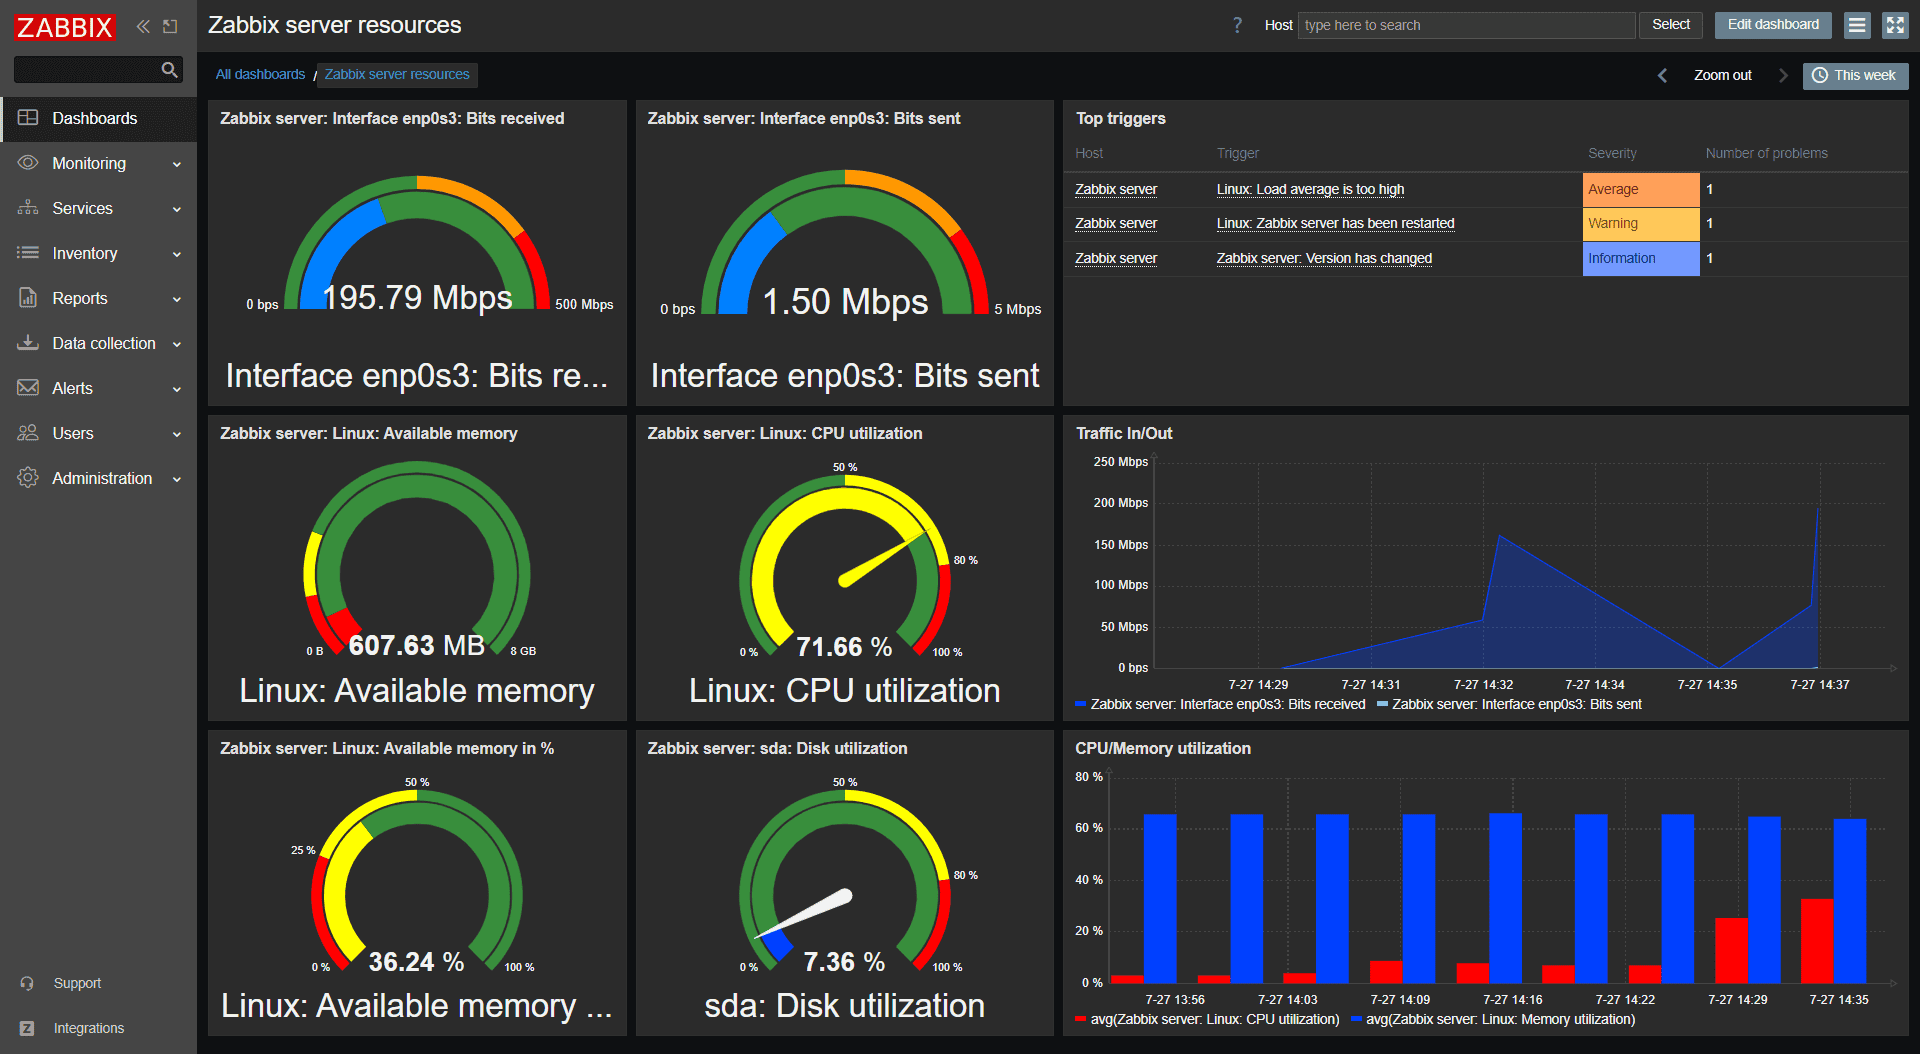
On-premises heavy organizations, network operations teams, and infrastructure teams that need zero-cost host monitoring without application-layer observability.
Best for: Teams wanting a lightweight, OpenTelemetry-native Datadog APM replacement at low cost
Uptrace is a newer entrant in the Datadog competitor space, built entirely around OpenTelemetry from the ground up. It uses ClickHouse as its storage backend , a columnar database that delivers exceptional analytical query performance at low storage cost , making it a compelling option for teams prioritizing tracing and APM without the overhead of a full observability platform.
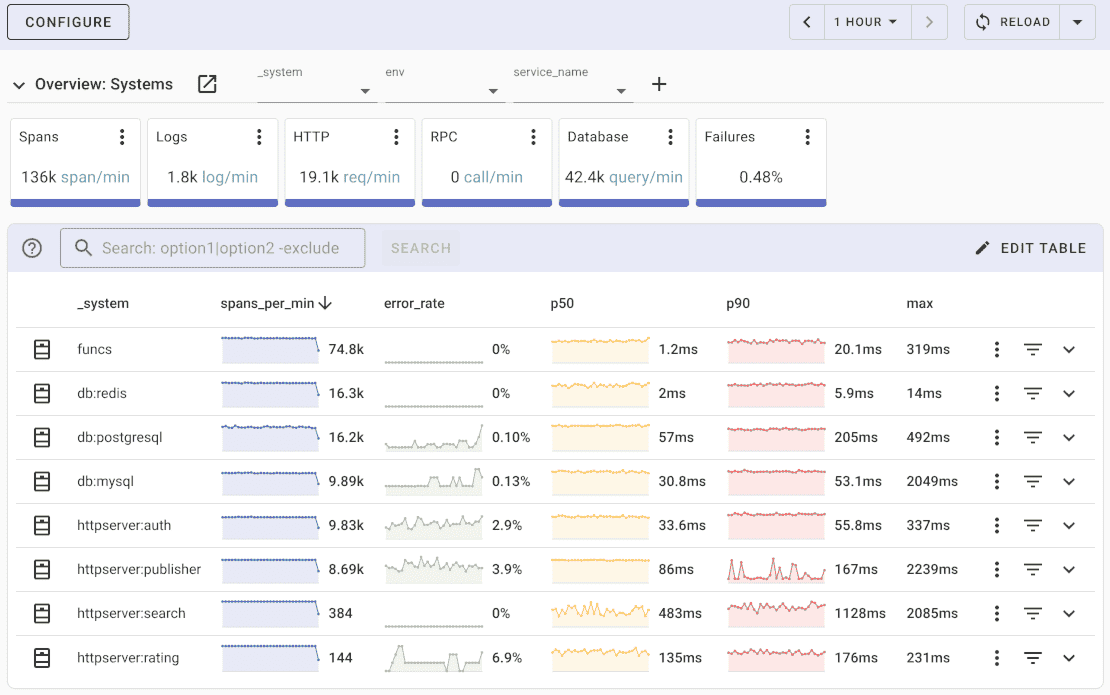
Startups and small-to-medium engineering teams that want a lightweight, low-cost Datadog APM replacement built on open standards.
| Competitor | Deployment | Metrics | Logs | Traces/APM | Pricing Model | Best Differentiator vs. Datadog |
|---|---|---|---|---|---|---|
| OpenObserve | Self-hosted / Cloud | ✅ | ✅ | ✅ | Open Source + Usage-based Cloud | 60–98% cost savings, SQL queries, OTel-native |
| Grafana Stack | Self-hosted / Managed | ✅ | ✅ | ✅ | Open Source + Grafana Cloud | Maximum flexibility, CNCF-native stack |
| New Relic | SaaS | ✅ | ✅ | ✅ | User-based SaaS | Minimal migration disruption for Datadog users |
| Dynatrace | SaaS / Hybrid | ✅ | ✅ | ✅ | Host/Unit-based | Automated instrumentation, AI root cause |
| Elastic Observability | Self-hosted / Cloud | ✅ | ✅ | ✅ | Data/Host-based | Best-in-class log search and SIEM overlap |
| Splunk | SaaS / On-prem | ✅ | ✅ | ✅ | Volume-based | Security + observability convergence |
| Honeycomb | SaaS only | ⚠️ | ⚠️ | ✅ | Event-based | Best high-cardinality distributed tracing |
| AppDynamics | SaaS / On-prem | ✅ | ✅ | ✅ | Unit-based | Business transaction monitoring, Cisco integration |
| Zabbix | Self-hosted | ✅ | ⚠️ | ❌ | Free (open source) | Zero licensing cost for infra monitoring |
| Uptrace | Self-hosted / Cloud | ✅ | ✅ | ✅ | Open Source + Cloud | Lightweight OTel-native APM at low cost |
⚠️ = Partial support | ❌ = Not supported | ✅ = Full support
With ten strong options evaluated, here's a decision framework based on the scenarios most teams face:
If the goal is to dramatically reduce observability spend, prioritize OpenObserve (open-source, 60–98% savings as documented in the dashboard comparison study), Grafana Stack (free components, pay only for infrastructure), or Uptrace (low-cost ClickHouse backend). Avoid New Relic, Dynatrace, and Splunk if cost is your primary concern , they're competitive with Datadog on cost, not dramatically cheaper.
OpenObserve, Grafana Stack, Elastic Observability, Zabbix, and Uptrace all support full self-hosted deployment. Dynatrace and AppDynamics also offer on-premises managed versions for enterprise customers. Honeycomb and core New Relic are SaaS-only and cannot satisfy strict data residency requirements.
New Relic is the easiest SaaS-to-SaaS migration , familiar UX, similar feature set, good migration tooling. For open-source migrations, OpenObserve and Uptrace are the most seamless because they accept OpenTelemetry data natively. Read the complete Datadog to OpenObserve migration guide for a step-by-step walkthrough.
Dynatrace (automatic instrumentation, AI operations) and AppDynamics (business transaction monitoring, Cisco integration) are the natural choices. Both handle complex hybrid environments with legacy components better than cloud-native-first platforms.
OpenObserve Kubernetes Monitoring (handles high-cardinality Kubernetes metrics natively), Grafana Stack (Prometheus is the CNCF standard for Kubernetes), and Elastic Observability are the strongest options for large Kubernetes deployments.
Honeycomb is the best distributed tracing experience available , particularly for high-cardinality tracing across microservices. Uptrace is a strong runner-up for teams that need self-hosted deployment. OpenObserve's APM and tracing provides solid tracing alongside unified log and metric context.
Splunk is the established leader when observability and SIEM must share a single platform. Elastic Observability is the strong open-source alternative in this space.
Datadog is a genuinely powerful observability platform. But "powerful" and "right for your team" are not the same thing. The observability landscape in 2026 has matured to the point where every major use case , unified monitoring, deep APM, distributed tracing, log analytics, infrastructure monitoring , is served by multiple strong competitors, many of which cost substantially less than Datadog.The common thread across the best migrations from Datadog: adopt OpenTelemetry as your instrumentation standard before you switch. OTel creates a portable instrumentation layer that makes any future backend change a configuration problem rather than an engineering project , and that flexibility is worth more than any single tool feature.
What is the most cost-effective Datadog competitor in 2026?
OpenObserve consistently delivers the most dramatic cost reductions , production data shows savings of 60–98% compared to equivalent Datadog configurations. The savings come from 140x compression technology, no per-host billing, and no per-custom-metric charges. The dashboard comparison study documents real numbers from production workloads. For teams using only infrastructure metrics without APM, Zabbix costs nothing if you have the ops capacity to self-host it.
Can I switch from Datadog without rewriting my instrumentation?
Yes, if you use the OpenTelemetry Collector. By inserting the OTel Collector between your services and your observability backend, you can redirect telemetry to any OpenTelemetry-native platform , OpenObserve, Honeycomb, Uptrace, Grafana Tempo, New Relic , without changing a single line of application code. Read the full Datadog-to-OpenObserve migration walkthrough for a practical, step-by-step guide.
Which Datadog competitor is best for Kubernetes monitoring?
OpenObserve and the Grafana Stack (particularly Prometheus + Grafana) are the strongest for Kubernetes-specific monitoring. Prometheus is the CNCF-endorsed standard for Kubernetes metrics. OpenObserve adds unified logs and traces in the same platform. Both handle the high-cardinality dimension explosion that Kubernetes environments produce.
Is Grafana a direct Datadog competitor?
Grafana as a standalone visualization tool is not a Datadog competitor. The full Grafana Stack , Grafana + Prometheus + Loki + Tempo , together provides coverage comparable to Datadog. Many teams use Grafana as the visualization layer on top of other backends (Prometheus, OpenObserve, Elastic), rather than adopting the entire stack.
What makes Honeycomb different from other Datadog competitors?
Honeycomb's event-centric, high-cardinality approach is architecturally distinct from both Datadog and most other competitors. Rather than pre-aggregating metrics, Honeycomb stores every event and allows ad-hoc slicing across any dimension at query time. This makes it uniquely powerful for debugging unknown production issues , but it is not a full replacement for infrastructure metrics monitoring.
Does Dynatrace cost less than Datadog?
Generally no. Dynatrace targets the enterprise premium market and pricing is typically comparable to or higher than Datadog. The value proposition is reduced operational overhead through automation and AI, not lower costs.
Which Datadog competitors support OpenTelemetry natively?
OpenObserve, Honeycomb, Uptrace, New Relic, and Grafana (via Grafana Tempo and Mimir) all offer native OpenTelemetry support. Dynatrace, Elastic Observability, and Splunk have added OTel support but primarily rely on proprietary agents for full-featured instrumentation.
What is the best free alternative to Datadog?
For a fully free self-hosted option covering metrics, logs, and traces, OpenObserve (open-source edition) provides the most complete Datadog-comparable feature set at zero licensing cost. The Grafana Stack (Grafana + Prometheus + Loki + Tempo) is similarly free but requires operating four separate systems. Zabbix is free for pure infrastructure monitoring.
Passionate about observability, AI systems, and cloud-native tools. All in on DevOps and improving the developer experience.


