Implementing Distributed Tracing in a Java Application with OpenObserve

Simran Kumari
March 03, 2026
11 min read
Don’t forget to share!
Try OpenObserve Cloud today for more efficient and performant observability.

Monitoring microservices is hard. When a user request fans out across multiple services each with its own database, its own logs, and its own failure modes traditional monitoring tools give you a fragmented picture. You see that something is slow, but not where or why.
Distributed tracing solves this by tracking a single request as it travels through every service in your system. In this tutorial, we'll implement distributed tracing for a custom-built Java Spring Boot microservices application using two open-source tools: OpenTelemetry and OpenObserve. If your stack includes other languages, we also have guides on implementing distributed tracing in .NET, Go, and Node.js applications with OpenTelemetry.
By the end, you will have:
In a microservices architecture, a single user action may touch dozens of services. If the request takes 3 seconds, which service is responsible? Which database query is the bottleneck?
Read our detailed guide on Distributed Tracing and beyond
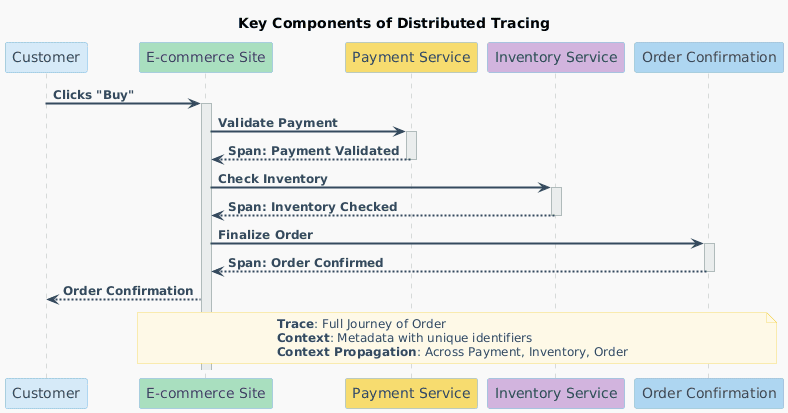
Distributed tracing answers these questions by attaching a trace context a trace_id and span_id to every request at the entry point, then propagating it through every downstream service call via HTTP headers. This produces a trace: a complete, end-to-end record of the request's journey through your system.
A trace is composed of spans one per operation. Each span records:
When visualized together, spans form a flamegraph that immediately shows where time was spent and where failures occurred.
OpenTelemetry is a CNCF project that provides a vendor-agnostic standard for generating and exporting telemetry data (traces, metrics, logs). For Java, it provides a powerful Java Agent a single JAR that auto-instruments your application at JVM startup. It detects Spring Boot, JDBC, HTTP clients, and 100+ popular libraries with no code changes required.
OpenTelemetry handles instrumentation. It exports data using the OTLP (OpenTelemetry Protocol) to a backend of your choice.
OpenObserve is that backend. It is a high-performance open-source observability platform built for logs, metrics, and traces. Written in Rust, it is:
We will build a custom Spring Boot microservices application from scratch with four services:
| Service | Port | Responsibility |
|---|---|---|
discovery-service |
8761 | Eureka service registry |
user-service |
8081 | User CRUD, backed by MySQL |
order-service |
8082 | Order management; calls user-service |
payment-service |
8083 | Payment processing; calls order-service |
The key distributed tracing scenario is triggered when a payment is processed:
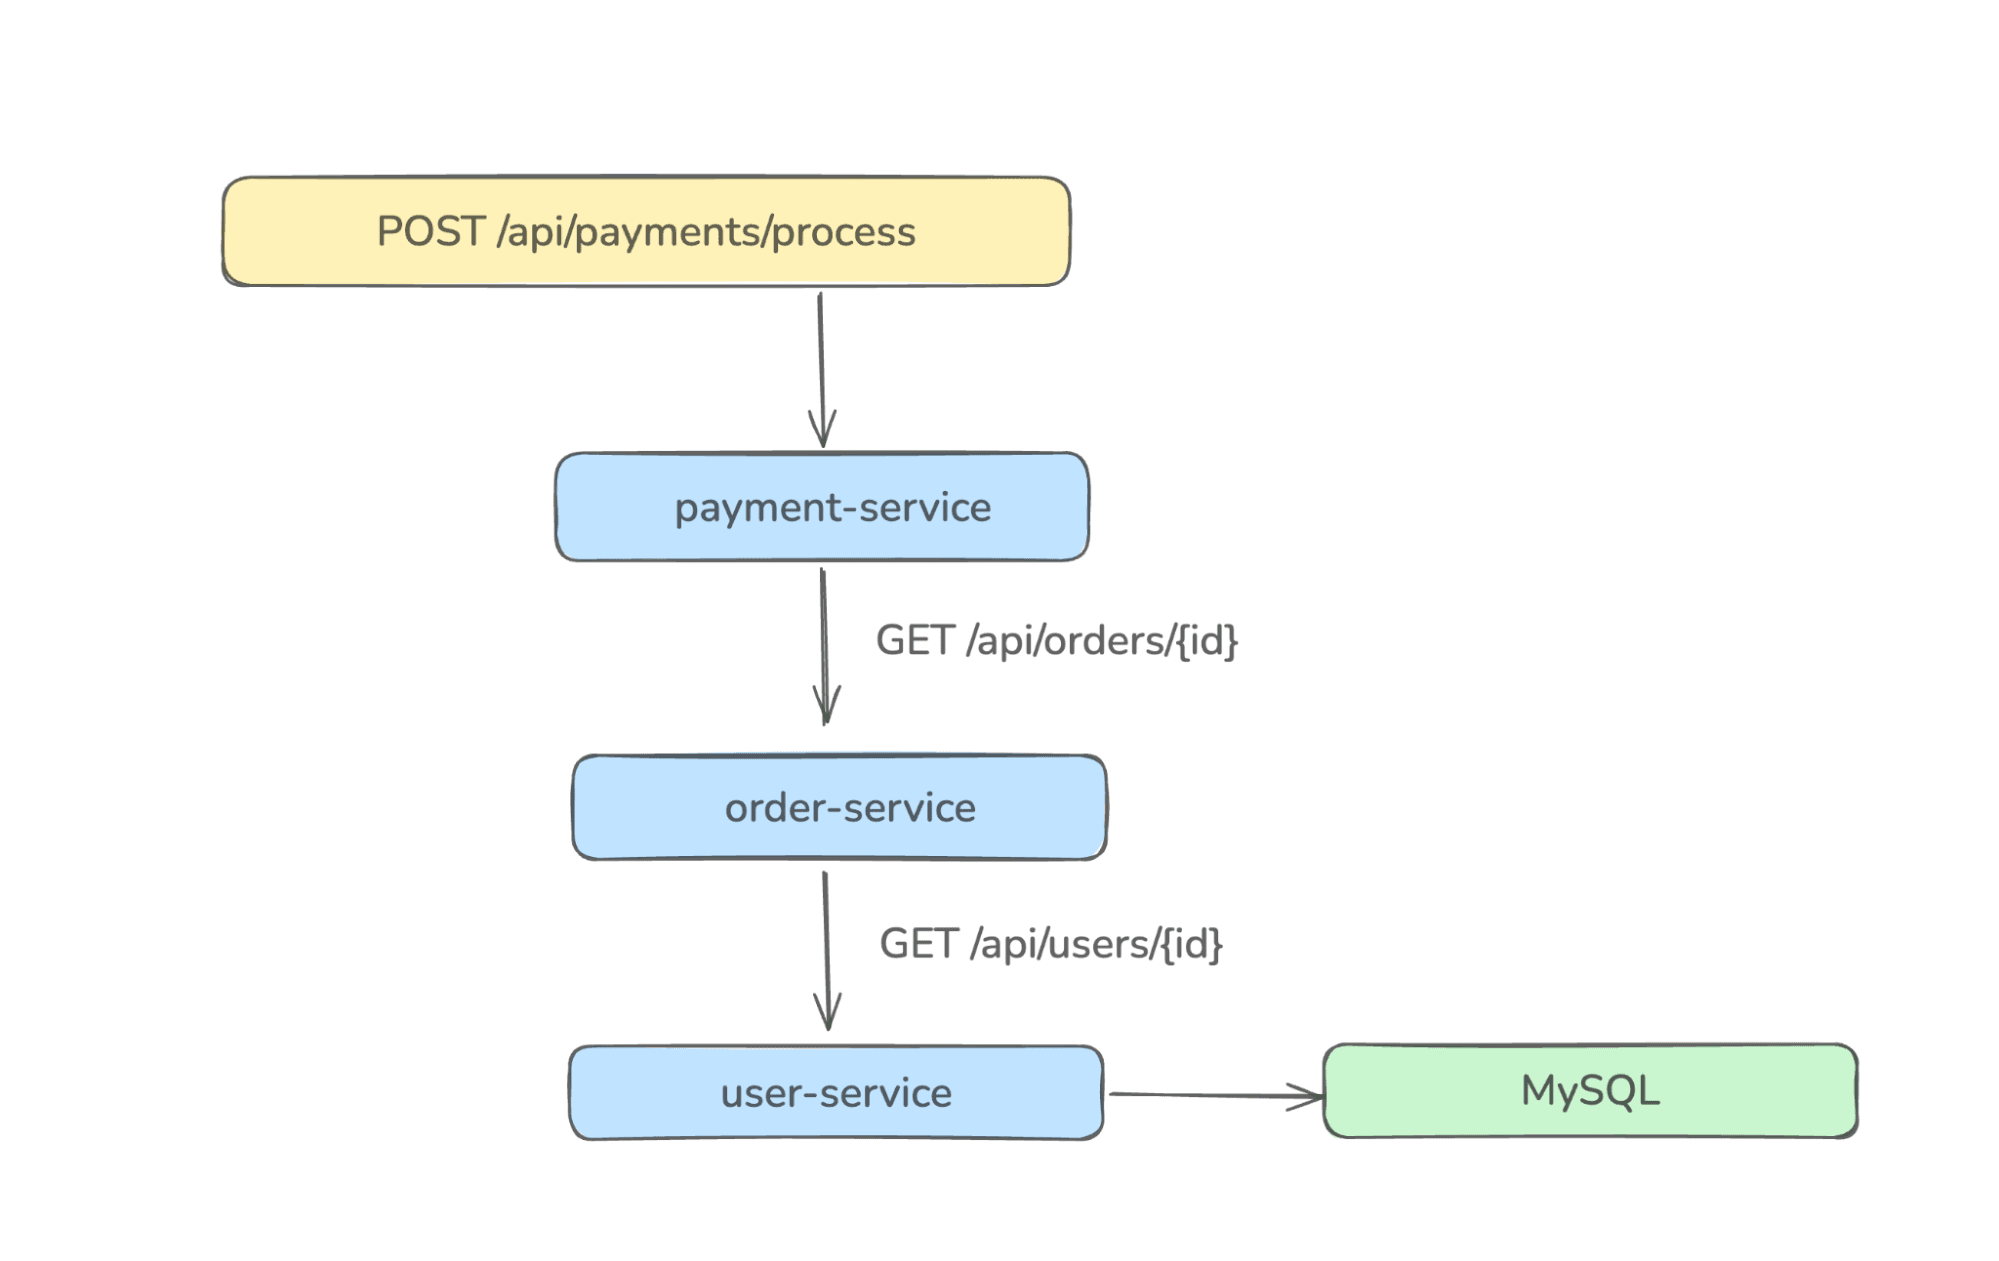 This creates a trace with spans spanning three services and one database, which is exactly the kind of request chain that's invisible without distributed tracing.
Each service runs with the OpenTelemetry Java Agent attached, which propagates the trace_id via traceparent HTTP headers automatically.
The complete source code for all four services is available in this repository. Clone it and navigate into the project root:
git clone https://github.com/openobserve/java-distributed-tracing.git
cd java-distributed-tracing
The docker-compose.yml in the project root spins up both OpenObserve and MySQL:
docker-compose up -d
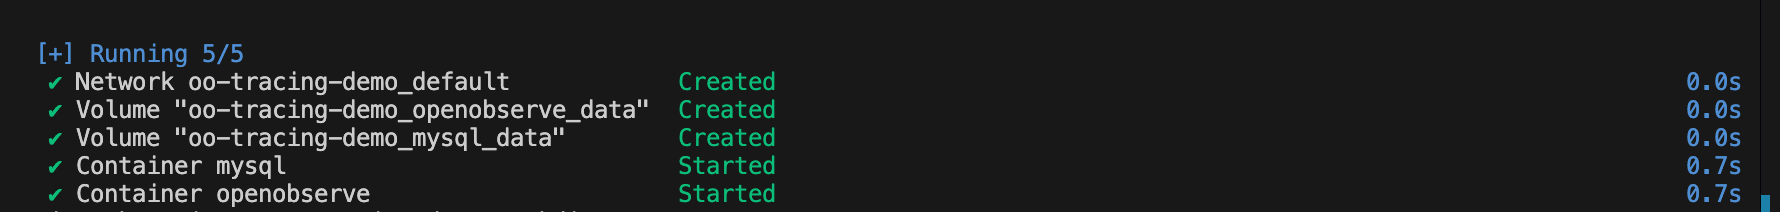
This starts:
http://localhost:5080 (UI + OTLP HTTP endpoint)localhost:3306 with a tracingdb databaseVerify OpenObserve is running by opening http://localhost:5080 in your browser. Log in with:
admin@example.comAdmin123!You should see the OpenObserve dashboard.
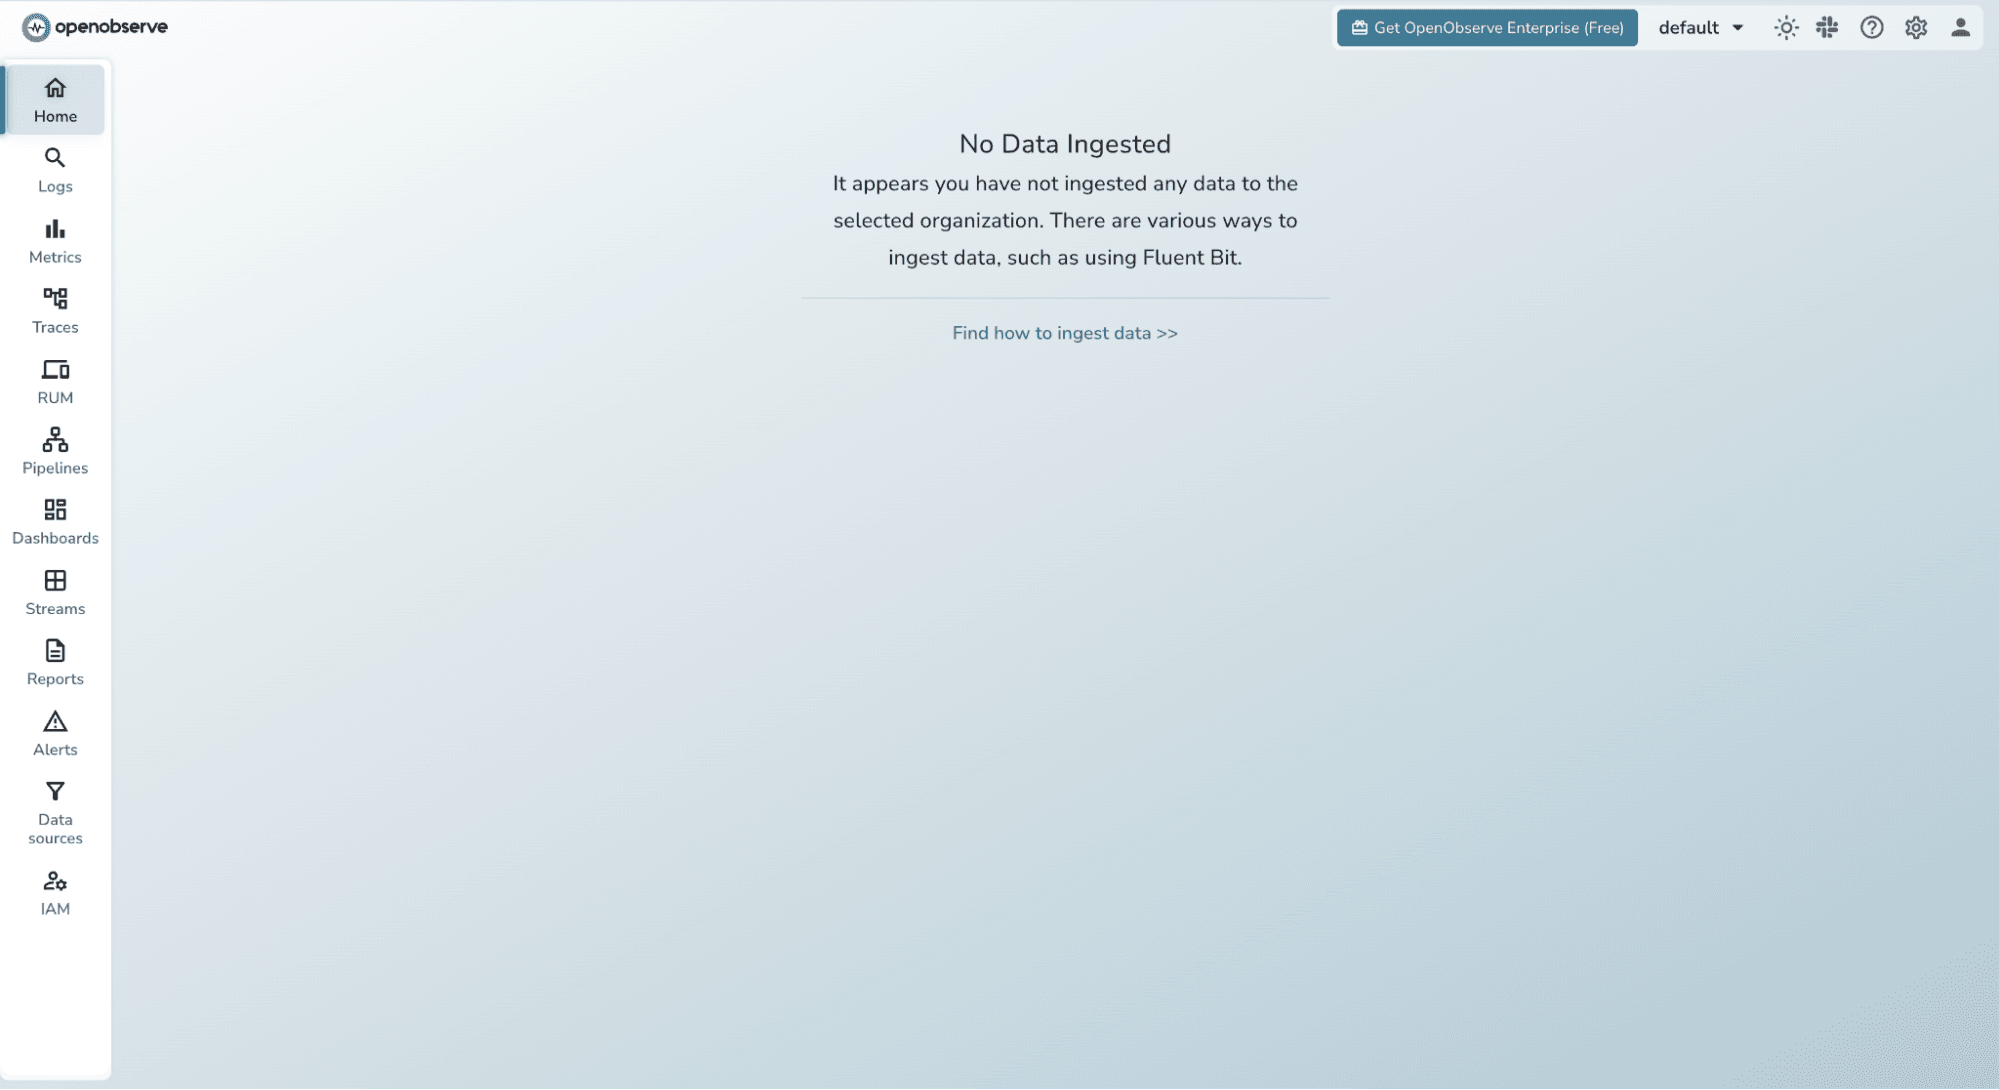
Navigate to Traces in the sidebar it will be empty for now, but we'll fix that shortly.
The OpenTelemetry Java Agent auto-instruments Spring Boot, JDBC, RestTemplate, and more all without touching your source code.
Create an agents/ folder in the project root and download the latest agent JAR:
mkdir agents
curl -L https://github.com/open-telemetry/opentelemetry-java-instrumentation/releases/latest/download/opentelemetry-javaagent.jar \
     -o agents/opentelemetry-javaagent.jar
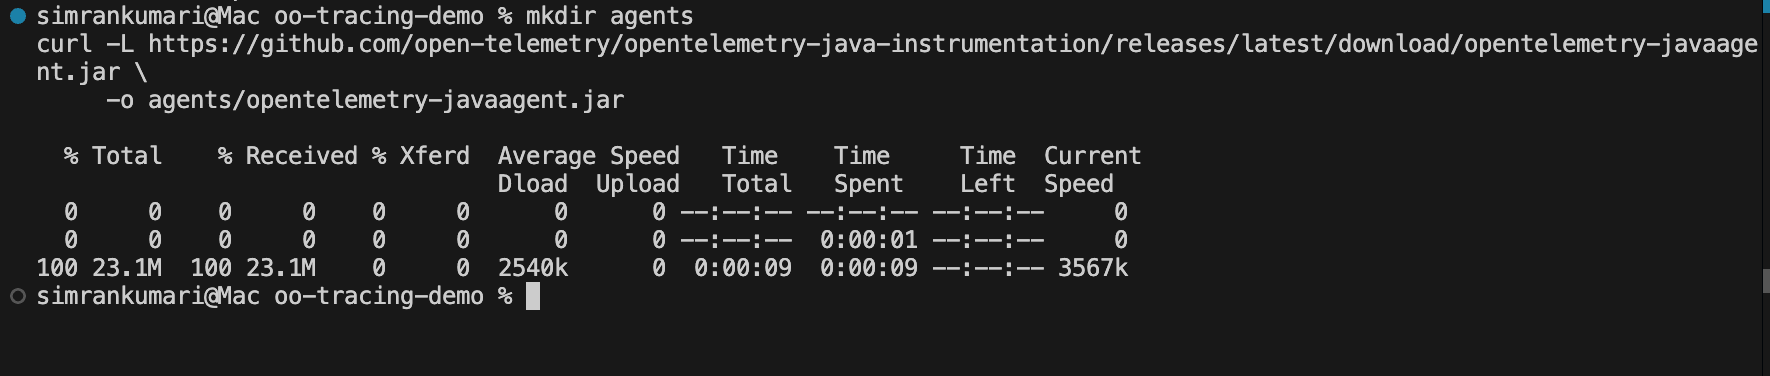
All four service startup scripts reference ../agents/opentelemetry-javaagent.jar, so this single download covers every service.
Each service's scripts/start.sh configures the OpenTelemetry Java Agent to export traces to OpenObserve. Let's break down what each flag does.
Here is the startup script for user-service (the other services follow the same pattern):
export OTEL_SERVICE_NAME=user-service
export OTEL_RESOURCE_ATTRIBUTES=service.name=user-service,deployment.environment=dev
export OTEL_TRACES_EXPORTER=otlp
export OTEL_METRICS_EXPORTER=none
export OTEL_LOGS_EXPORTER=none
export OTEL_EXPORTER_OTLP_TRACES_ENDPOINT=http://localhost:5080/api/default/traces
export OTEL_EXPORTER_OTLP_TRACES_PROTOCOL=http/protobuf
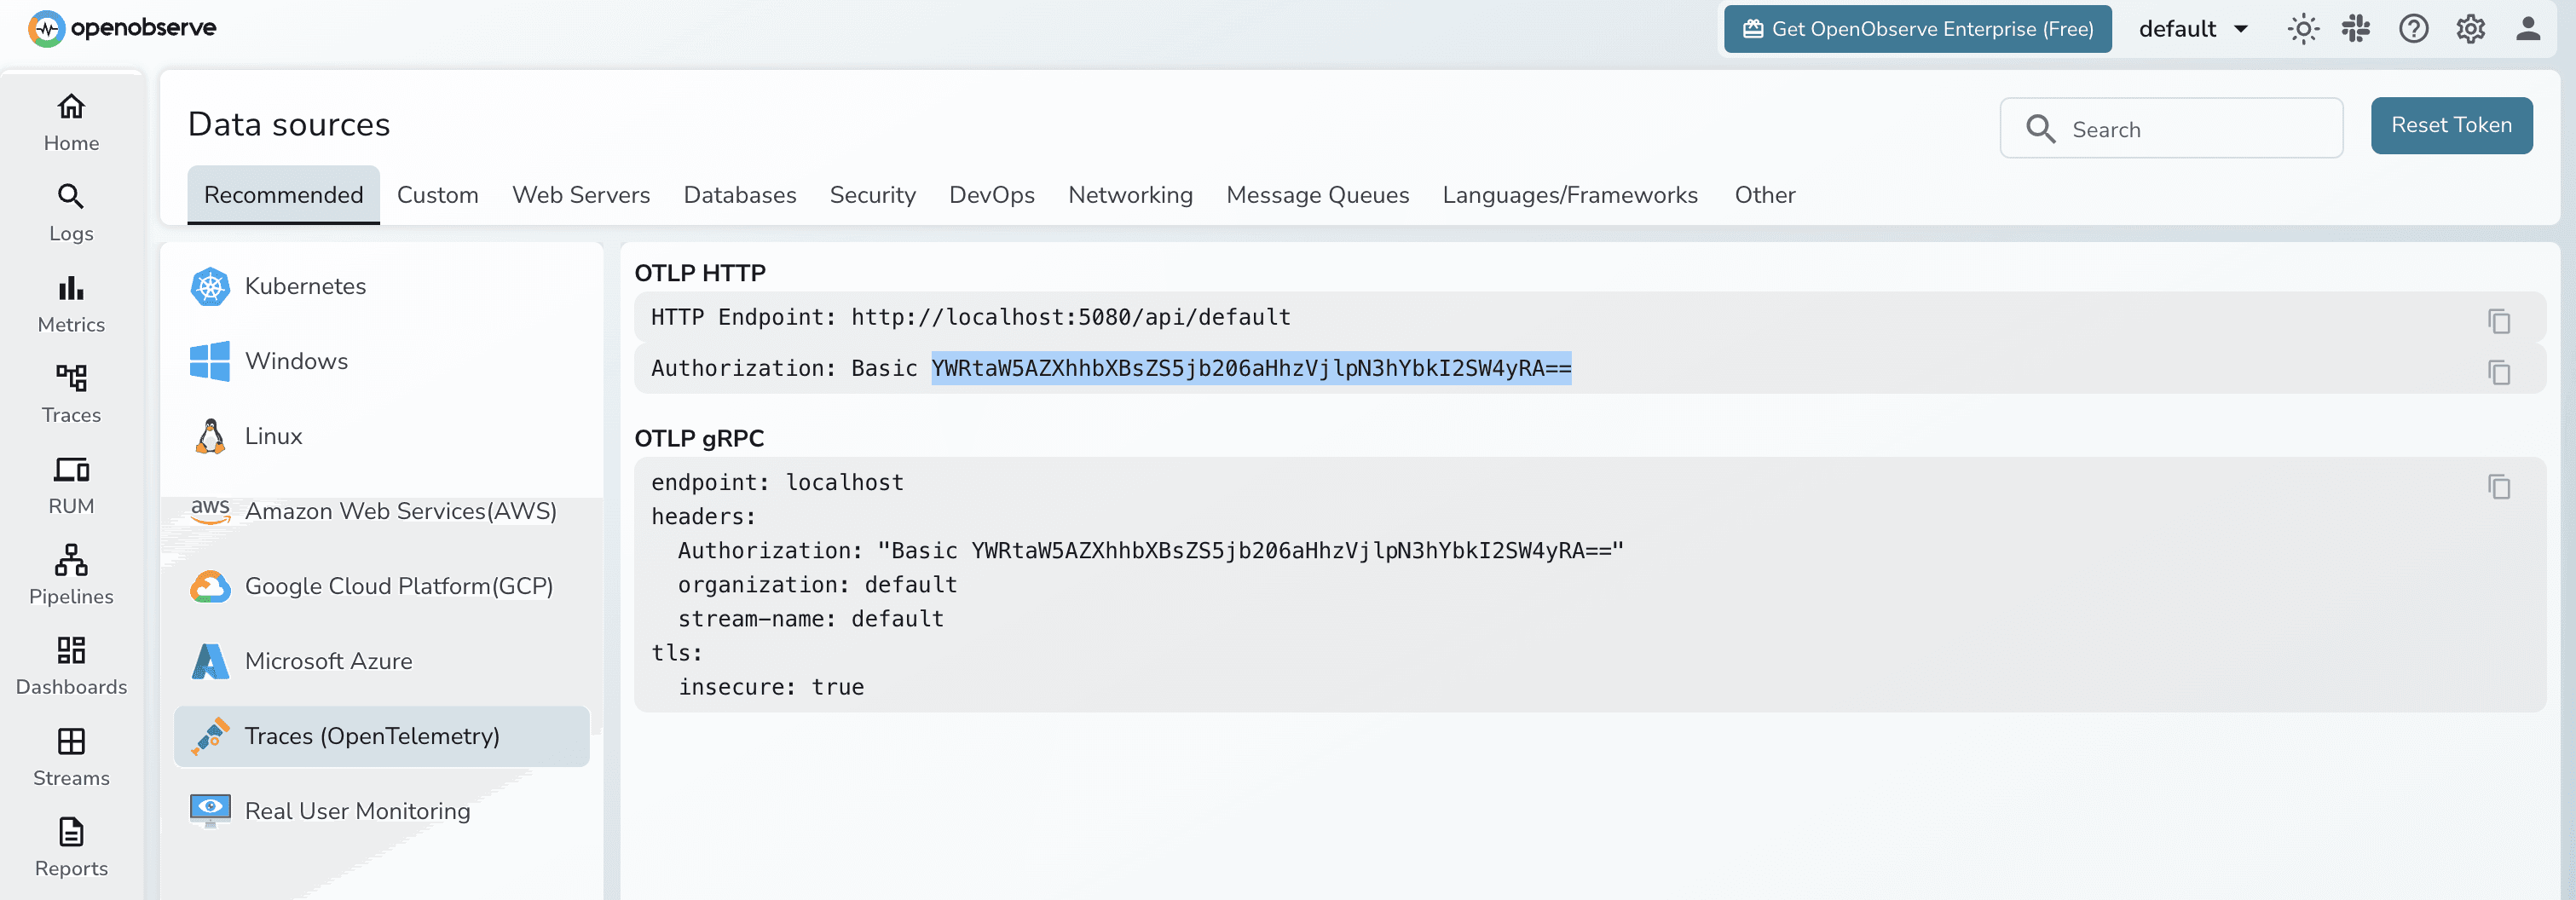
export OTEL_EXPORTER_OTLP_TRACES_HEADERS="Authorization=Basic {token}"
java \
-Xms256m \
-Xmx512m \
-javaagent:../agents/opentelemetry-javaagent.jar \
-jar target/user-service-0.0.1-SNAPSHOT.jar
Key variables explained:
| Variable | Value | What it does |
|---|---|---|
| OTEL_SERVICE_NAME | user-service | Labels this service's spans and metrics in OpenObserve |
| OTEL_TRACES_EXPORTER | otlp | Enable trace export via OTLP |
| OTEL_EXPORTER_OTLP_TRACES_ENDPOINT | .../traces | OpenObserve OTLP traces endpoint |
| OTEL_EXPORTER_OTLP_TRACES_HEADERS | Authorization=Basic ... | Basic auth token fetched from OpenObserve |
You can fetch the Header token from OpenObserve UI:
The discovery service is a Eureka server. The other three services register with it on startup.
cd discovery-service
mvn clean install -Dmaven.test.skip
sh scripts/start.sh
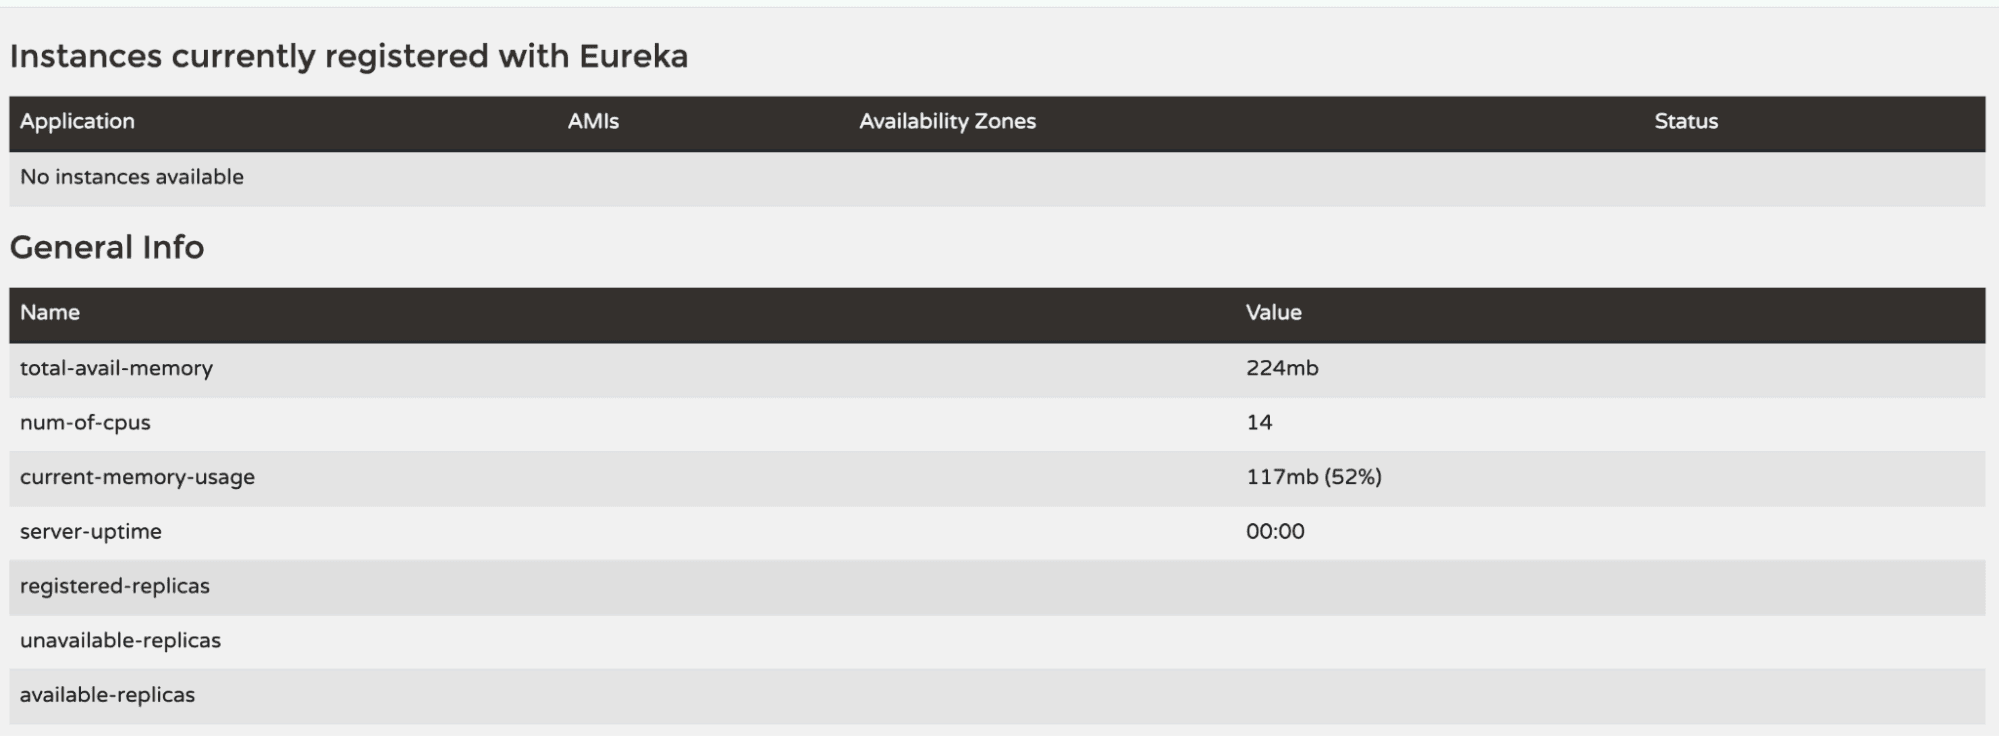
Open http://localhost:8761 to confirm the Eureka dashboard is live. You won't see any registered instances yet.
Open three separate terminal windows and start each service:
Terminal 1 user-service:
cd user-service
mvn clean install -Dmaven.test.skip
sh scripts/start.sh
Terminal 2 order-service:
cd order-service
mvn clean install -Dmaven.test.skip
sh scripts/start.sh
Terminal 3 payment-service:
cd payment-service
mvn clean install -Dmaven.test.skip
sh scripts/start.sh
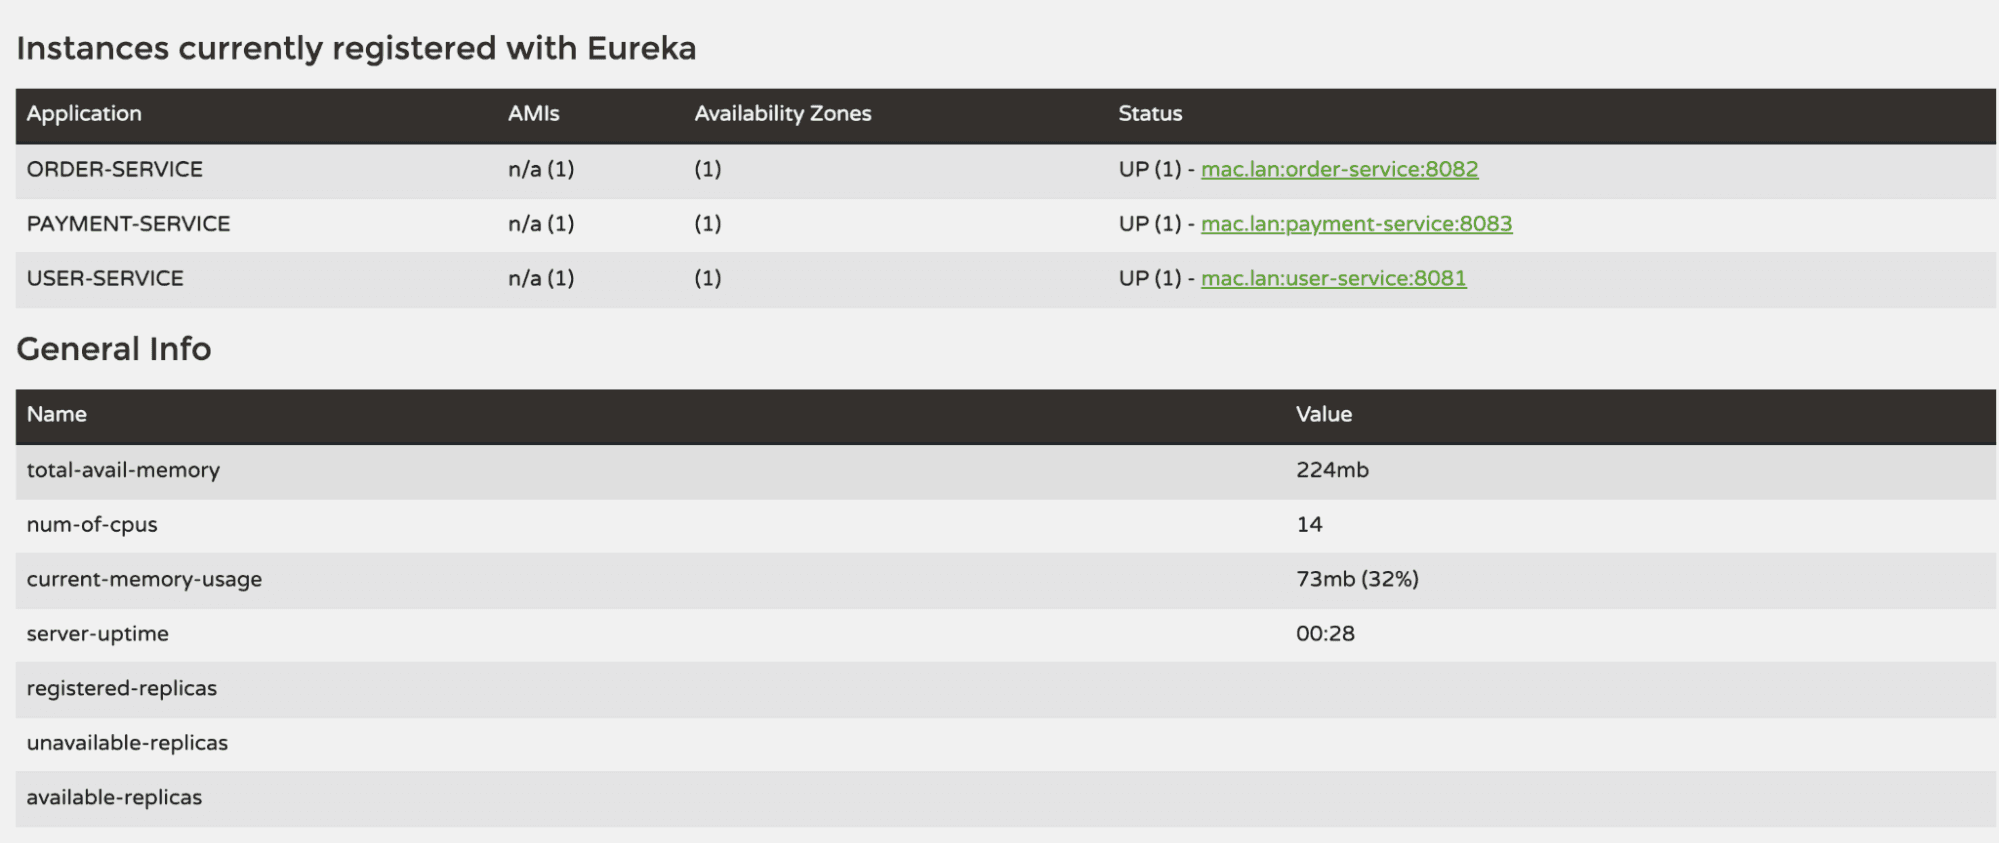
Once all three are running, revisit the Eureka dashboard at http://localhost:8761 you should see all three services listed under "Instances currently registered with Eureka".
Now let's create some user requests that will flow across services and produce traces. You can use curl or any API client like Postman.
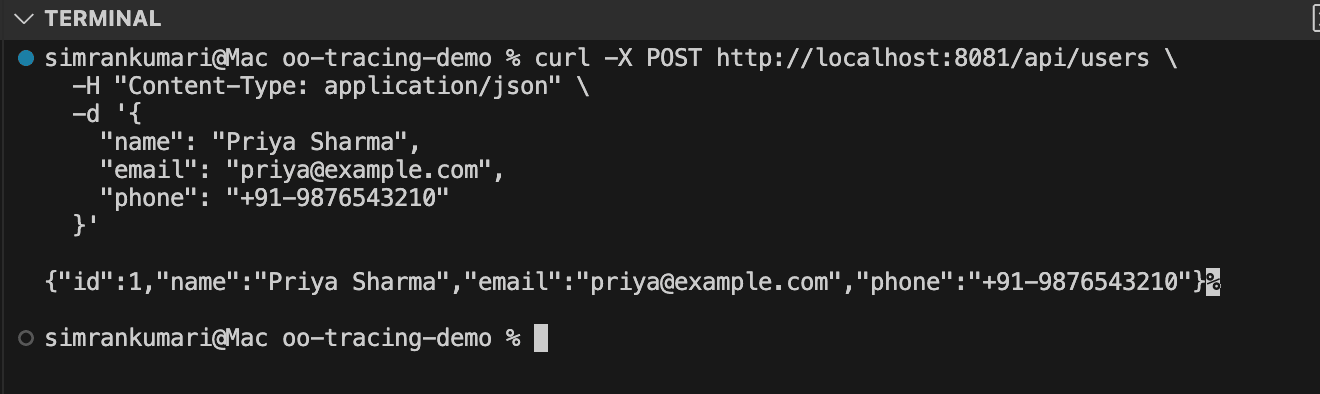
1. Create a user:
curl -X POST http://localhost:8081/api/users \
  -H "Content-Type: application/json" \
  -d '{
    "name": "Priya Sharma",
    "email": "priya@example.com",
    "phone": "+91-9876543210"
  }'
Expected response:
{
  "id": 1,
  "name": "Priya Sharma",
  "email": "priya@example.com",
  "phone": "+91-9876543210"
}
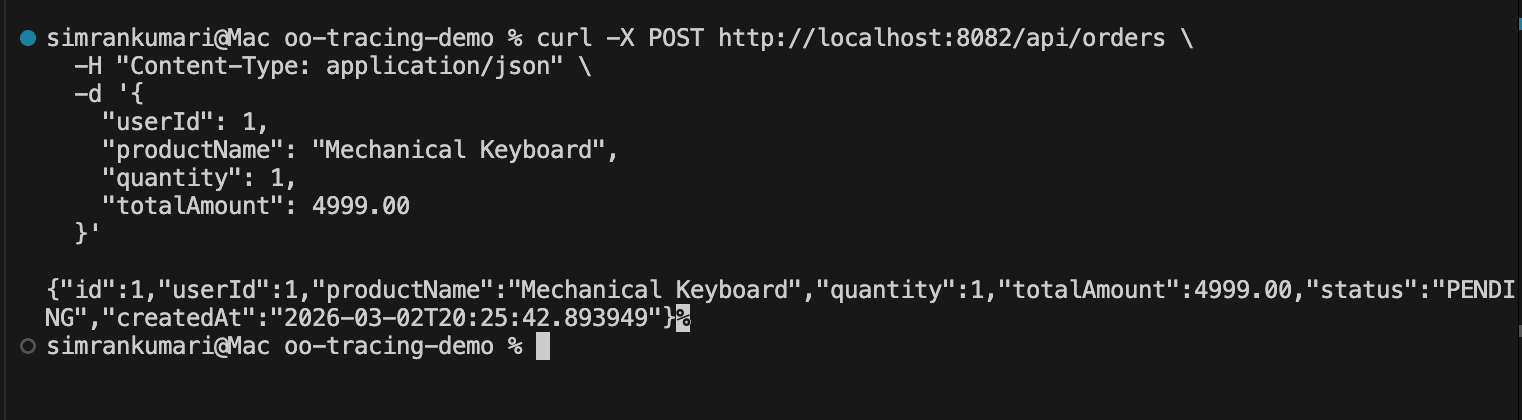
2. Create an order for that user:
curl -X POST http://localhost:8082/api/orders \
  -H "Content-Type: application/json" \
  -d '{
    "userId": 1,
    "productName": "Mechanical Keyboard",
    "quantity": 1,
    "totalAmount": 4999.00
  }'
This triggers a cross-service call: order-service calls user-service to verify the user exists before creating the order. Two services, one trace.
Expected response:
{
  "id": 1,
  "userId": 1,
  "productName": "Mechanical Keyboard",
  "quantity": 1,
  "totalAmount": 4999.00,
  "status": "PENDING",
  "createdAt": "2026-02-15T10:30:00"
}
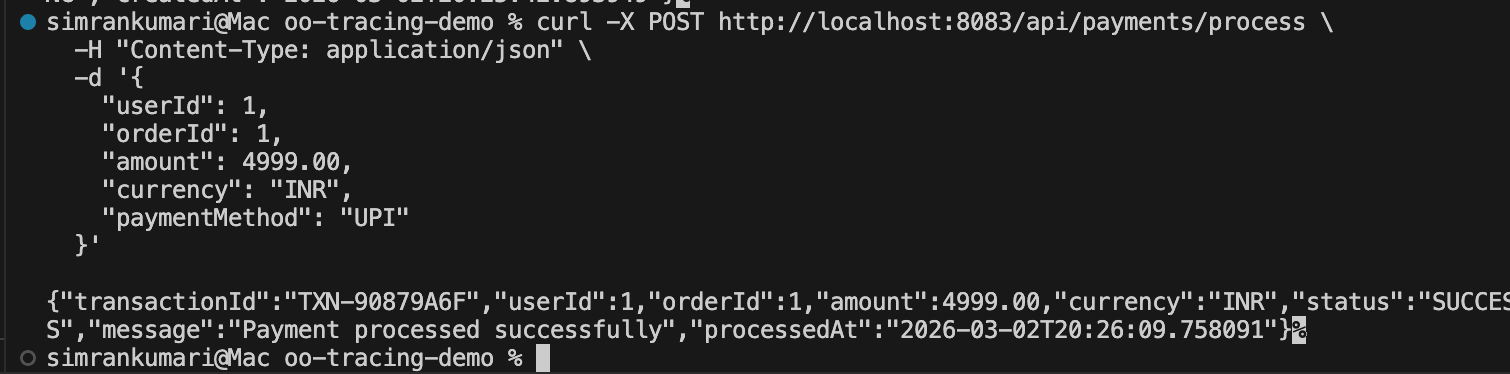
3. Process a payment (the richest trace):
curl -X POST http://localhost:8083/api/payments/process \
  -H "Content-Type: application/json" \
  -d '{
    "userId": 1,
    "orderId": 1,
    "amount": 4999.00,
    "currency": "INR",
    "paymentMethod": "UPI"
  }'
This triggers the full call chain: payment-service → order-service → user-service → MySQL
Expected response:
{
  "transactionId": "TXN-A1B2C3D4",
  "userId": 1,
  "orderId": 1,
  "amount": 4999.00,
  "currency": "INR",
  "status": "SUCCESS",
  "message": "Payment processed successfully",
  "processedAt": "2026-02-15T10:31:00"
}
4. Test an error case order for a non-existent user:
curl -X POST http://localhost:8082/api/orders \
  -H "Content-Type: application/json" \
  -d '{
    "userId": 9999,
    "productName": "Test Product",
    "quantity": 1,
    "totalAmount": 100.00
  }'
This will return a 400 Bad Request. The failed cross-service lookup will appear in OpenObserve as an errored span useful for testing error visibility.
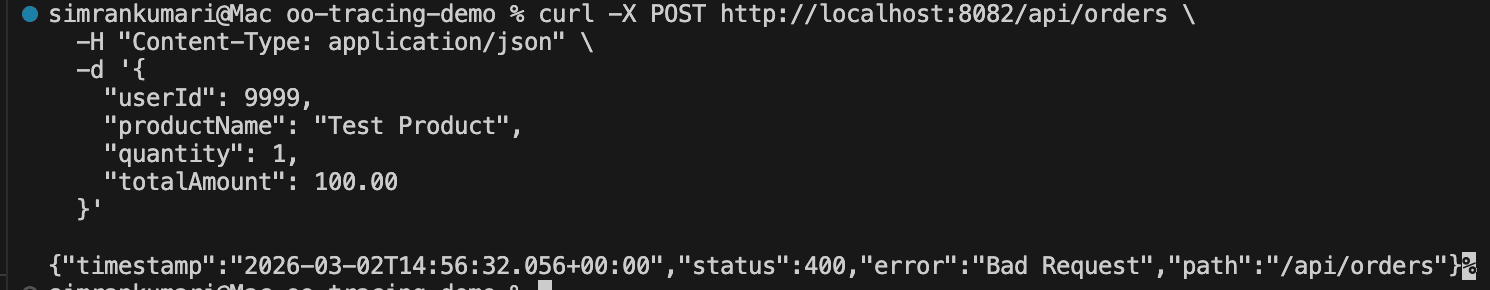
Make several of these requests in different combinations to generate a rich set of trace data.
Head to the OpenObserve UI at http://localhost:5080 and click Traces in the left sidebar.
The Trace Explorer shows all incoming traces with filters at the top. You should immediately see traces from the three services listed in the service dropdown. The trace list shows:
POST /api/payments/process)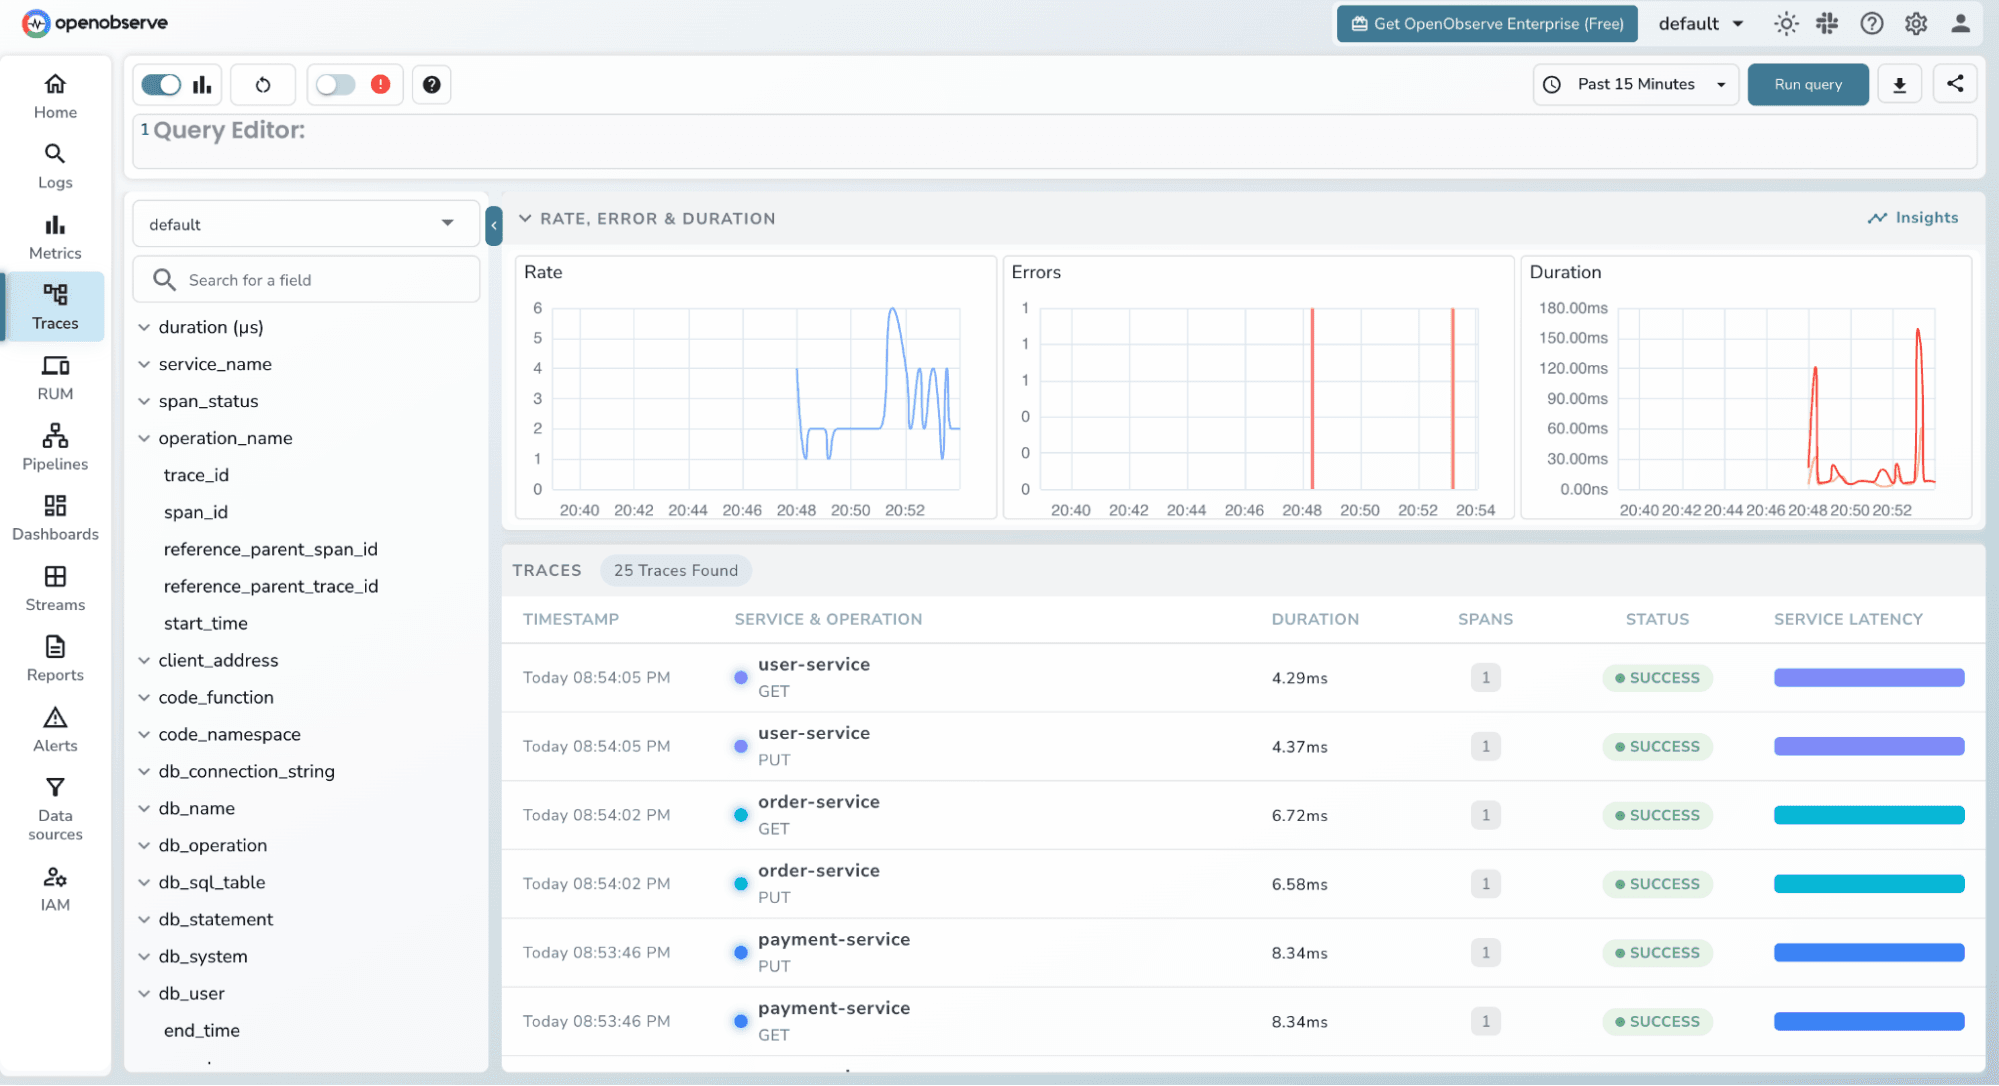
Use the filters to narrow down what you're looking at:
Filter by service_name = payment-service to see only payment requests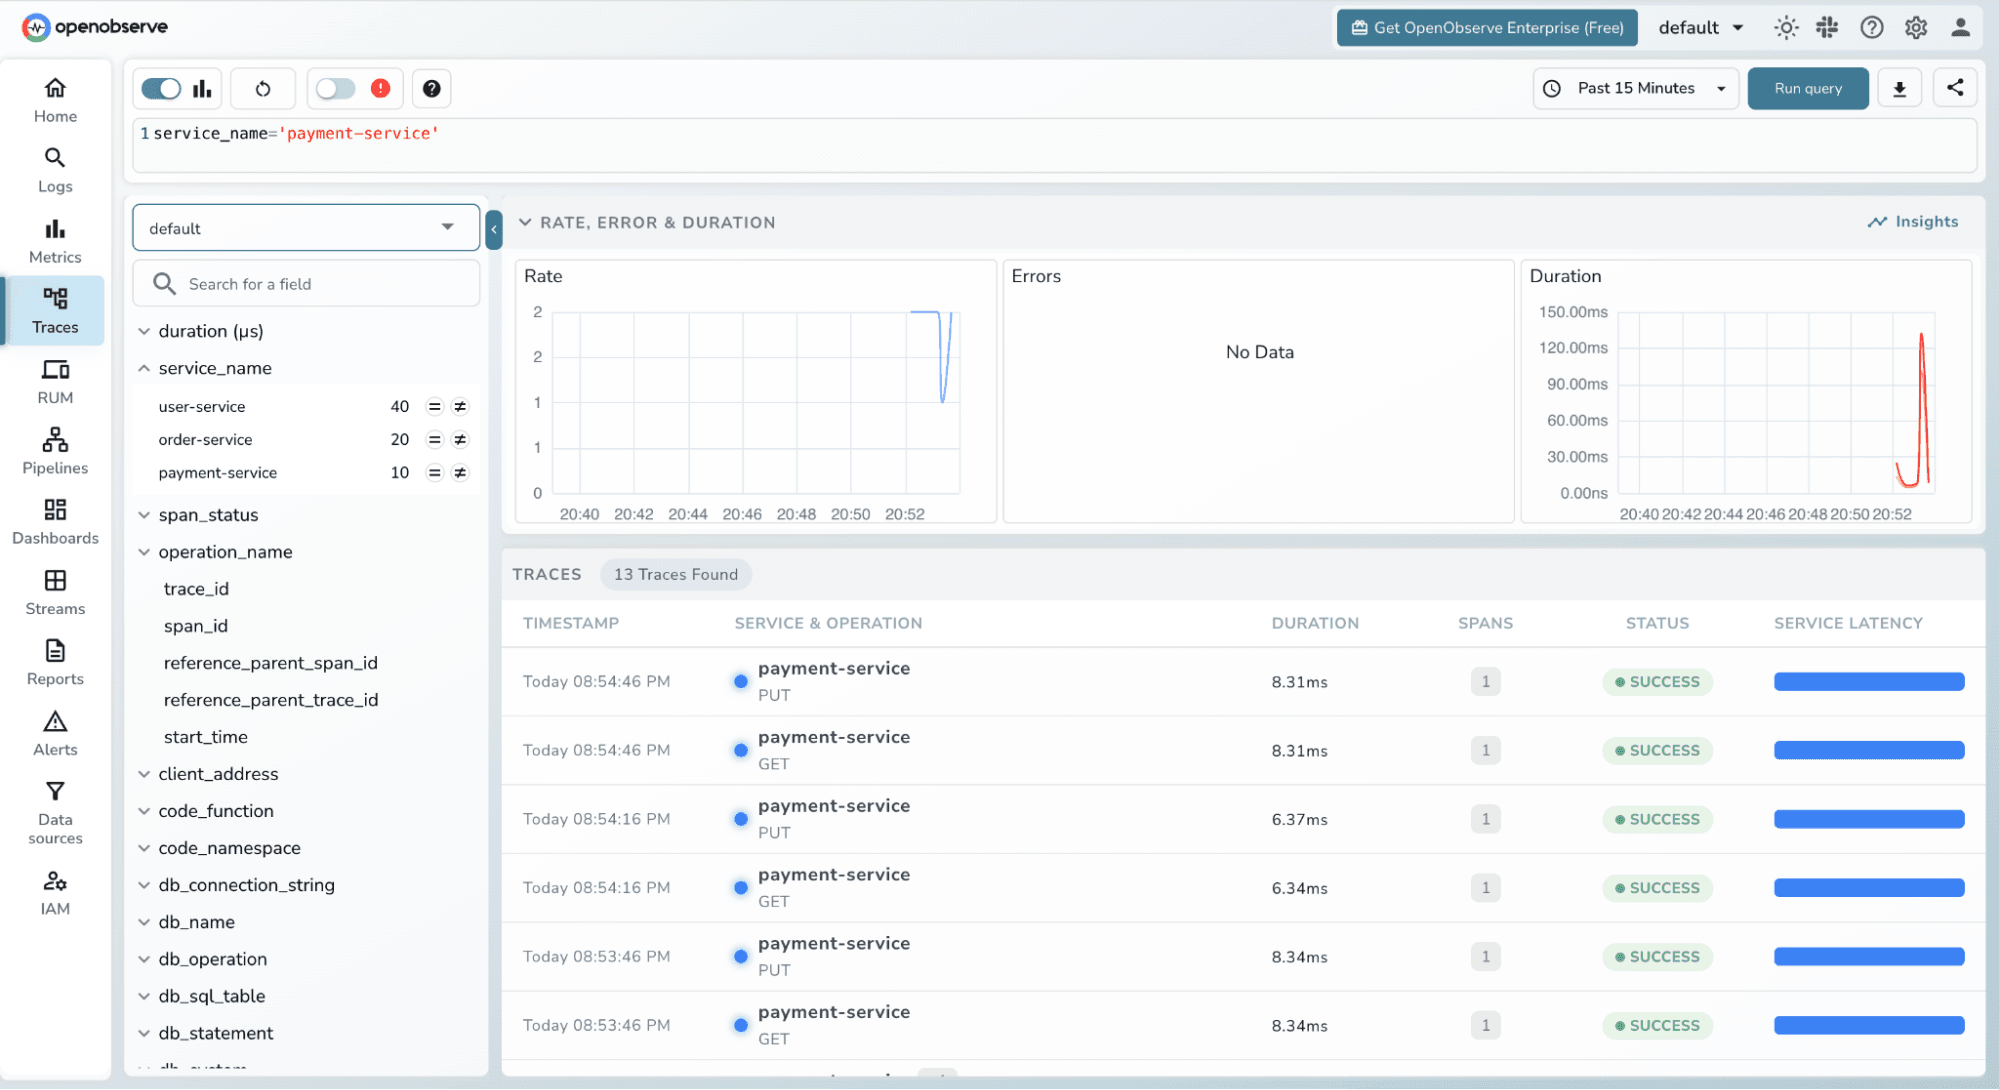
Filter by status = ERROR to find failed requests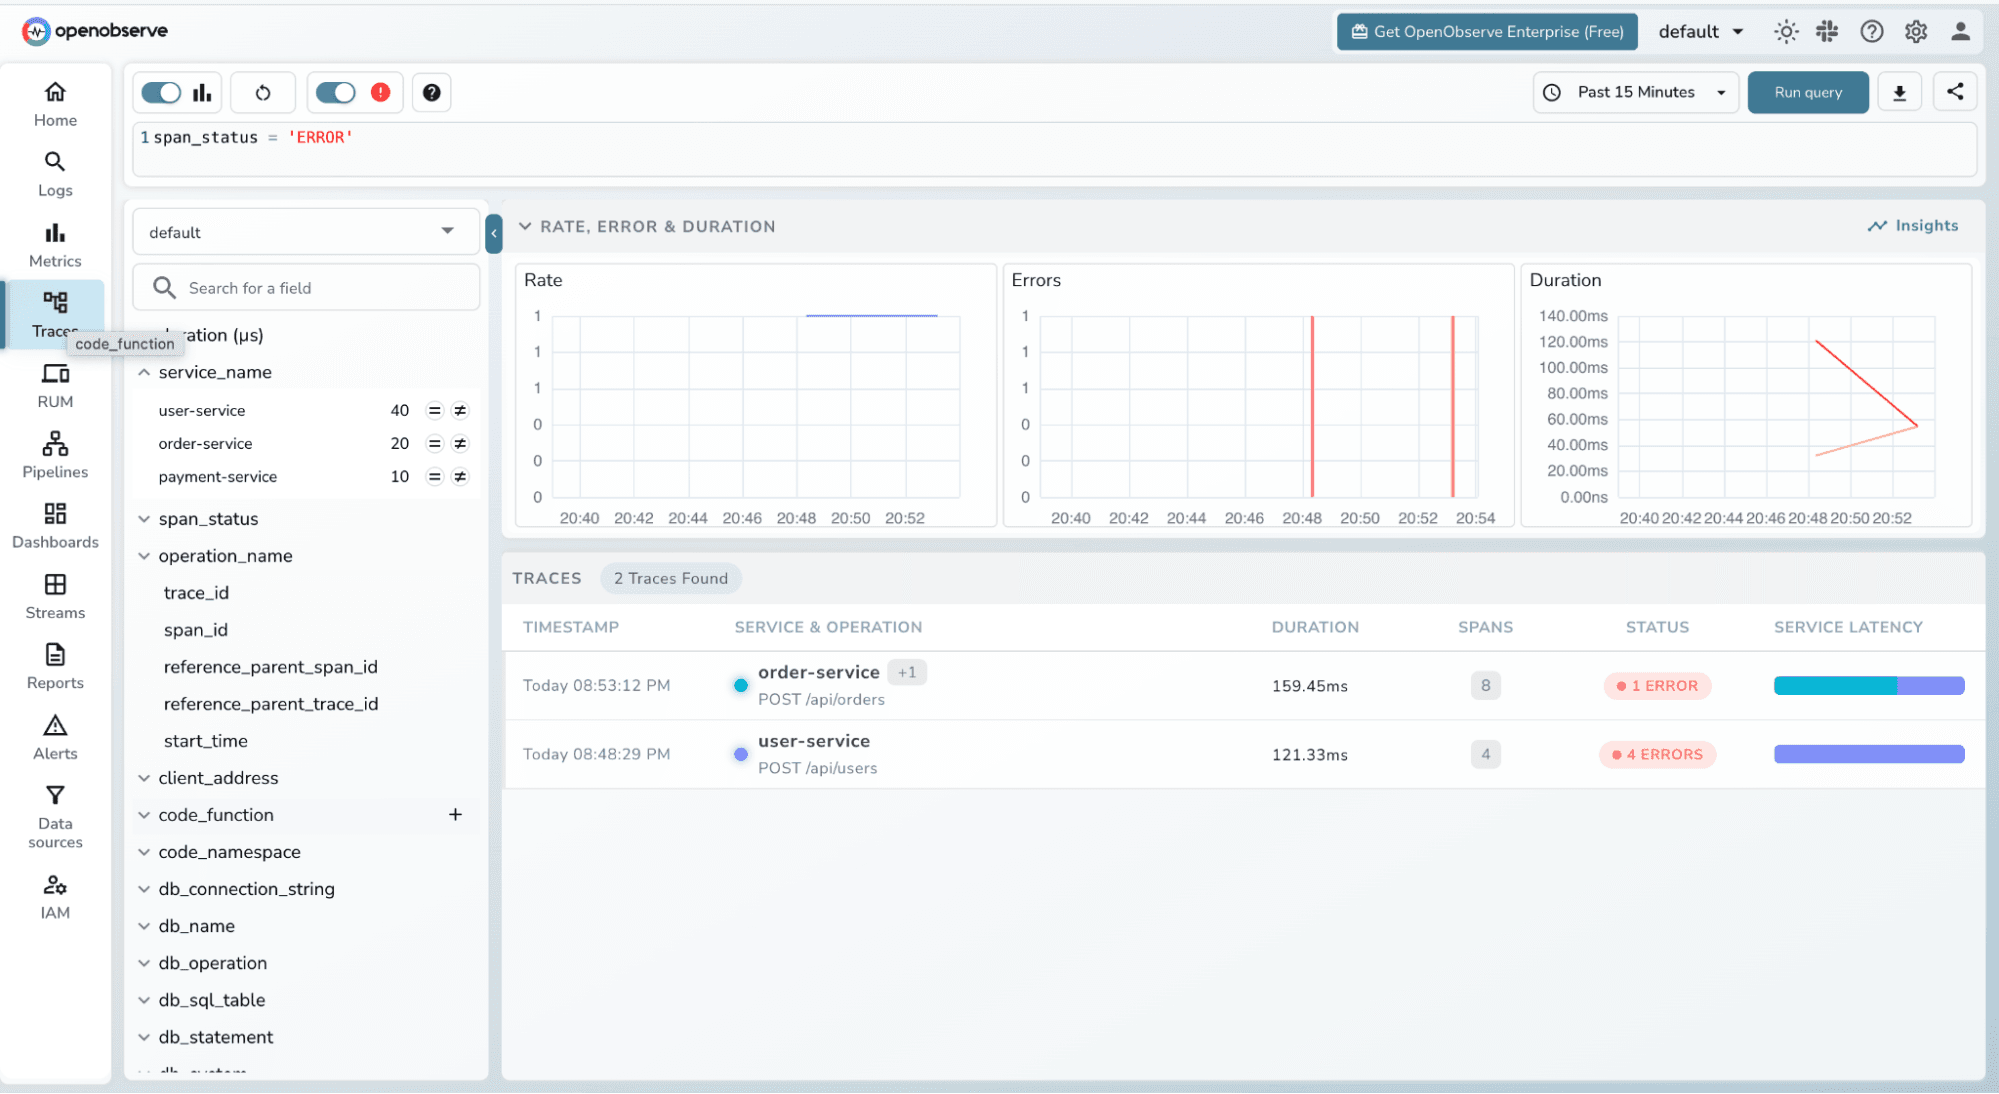
Use the duration slider to find slow outliers
Filter by operation_name to focus on a specific endpoint
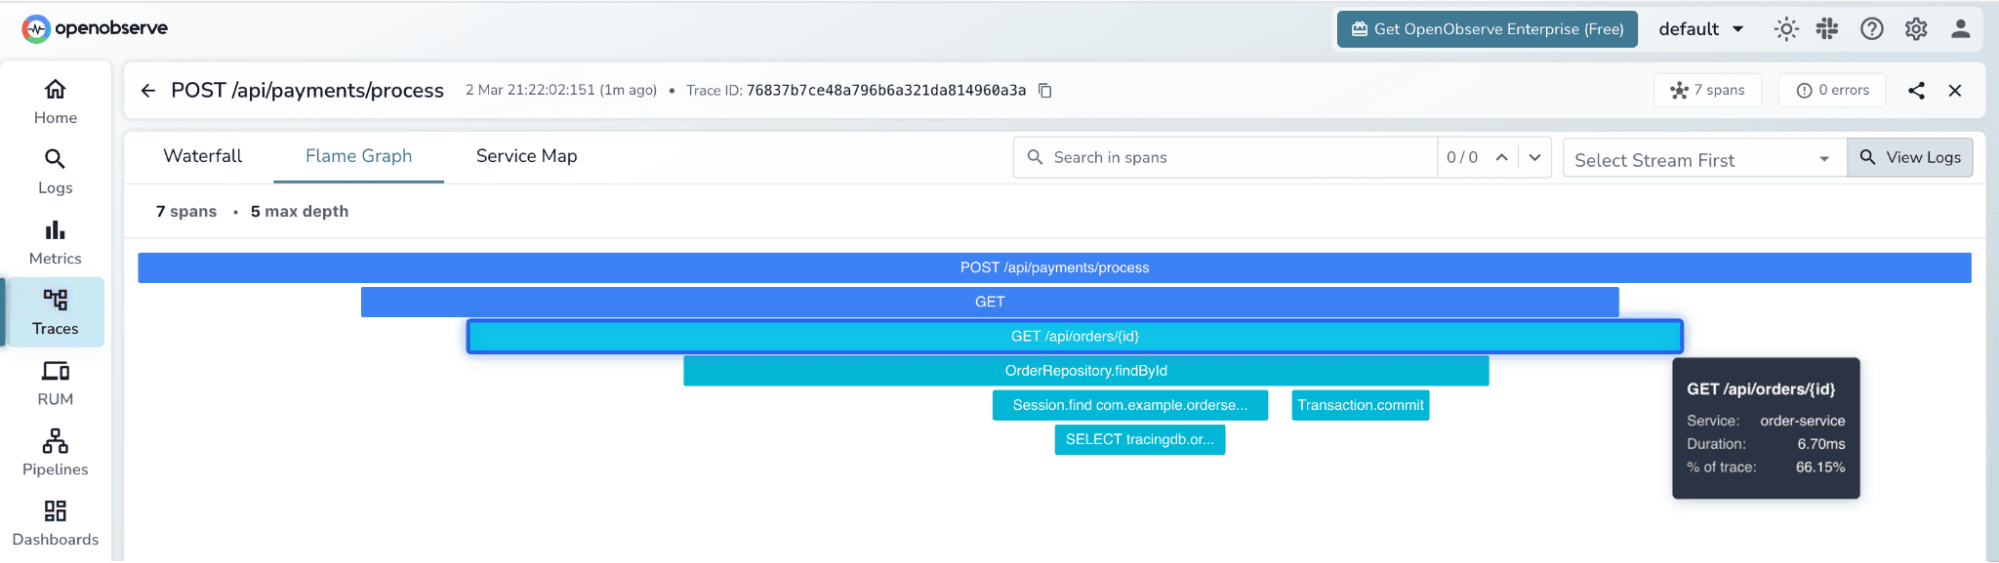
Click on any trace from the POST /api/payments/process request. OpenObserve opens the trace detail view, which shows two visualizations:
Flamegraph - each span is rendered as a proportionally-sized horizontal block nested under its parent. The payment service span is the root; underneath it you can see the order-service span and within that the user-service span and its MySQL JDBC span. The width of each block represents time wider means slower. You immediately see which service contributed most to the total latency.
Gantt Chart the same spans laid out on a timeline. Each row is one span, with start time and duration shown as a bar. Clicking a span opens its detail panel, which shows:
trace_id and span_id 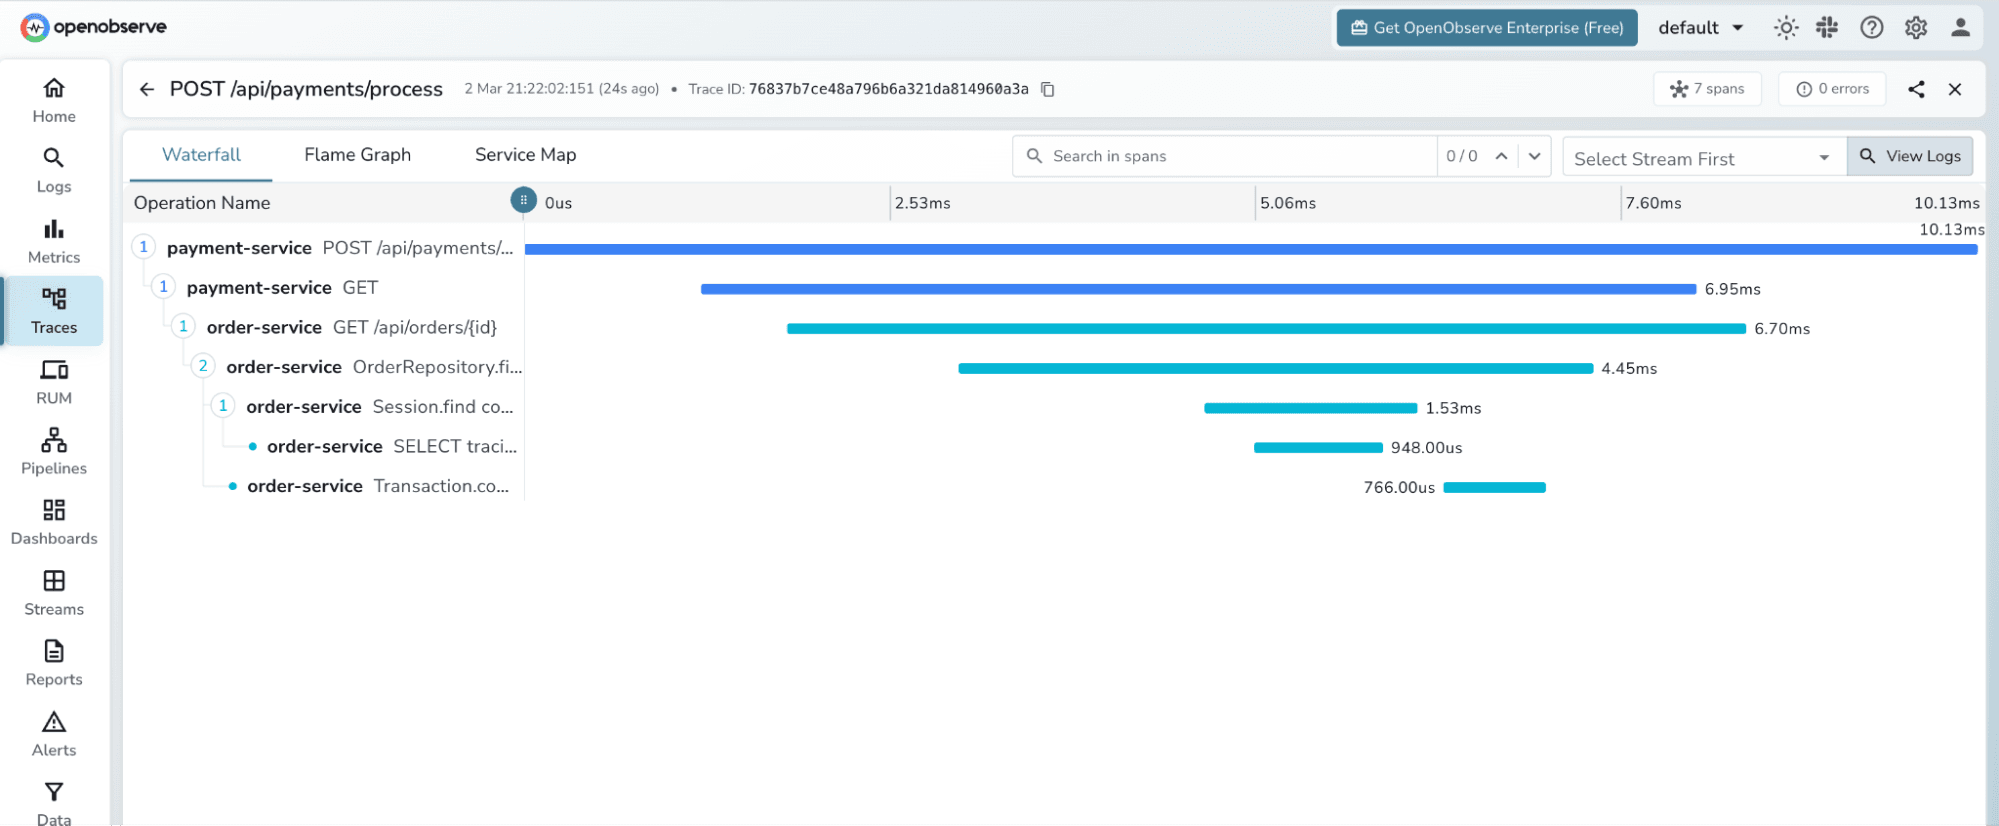
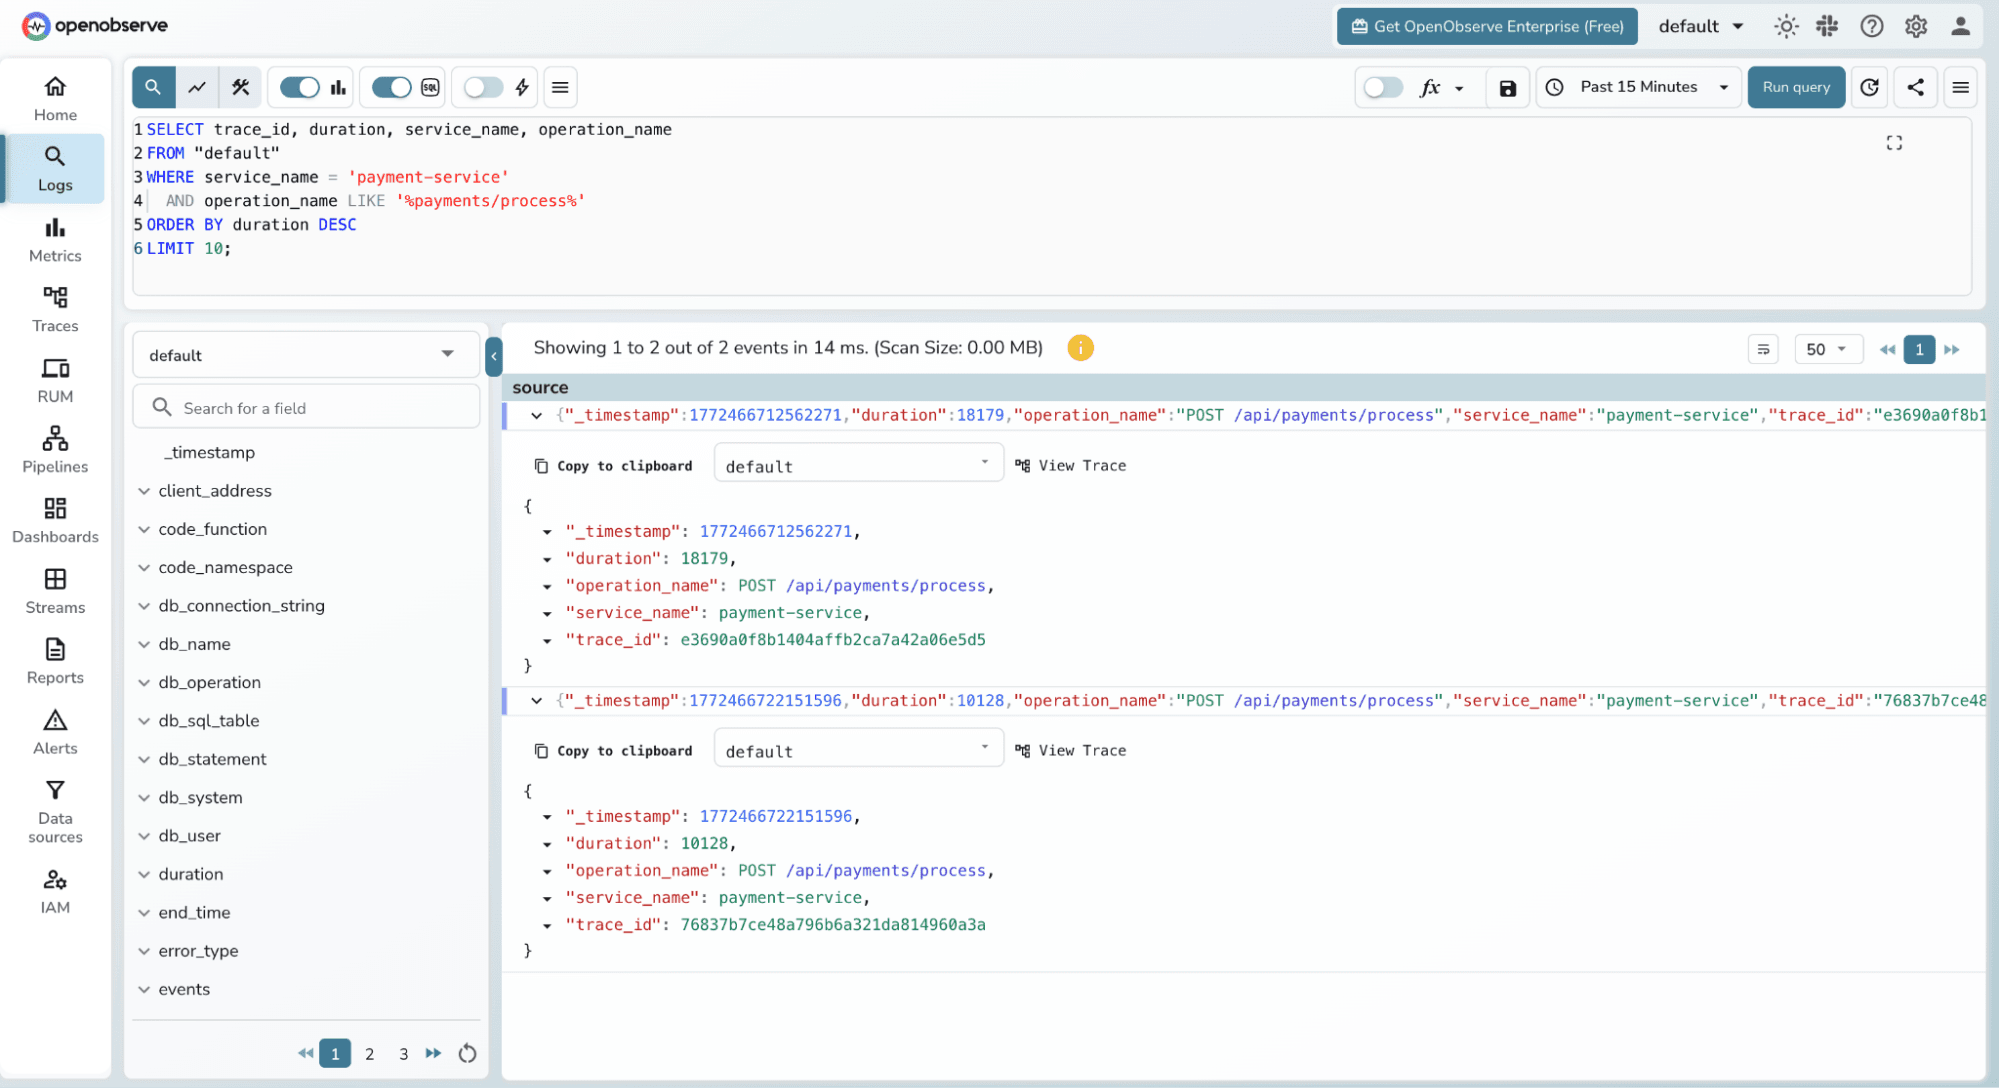
One of OpenObserve's standout features is the ability to query your trace data directly using SQL. Click Logs (traces are queryable through the same SQL interface) and select the default stream.
Find the slowest payment traces in the last hour:
SELECT trace_id, duration, service_name, operation_name
FROM "default"
WHERE service_name = 'payment-service'
  AND operation_name LIKE '%payments/process%'
ORDER BY duration DESC
LIMIT 10;
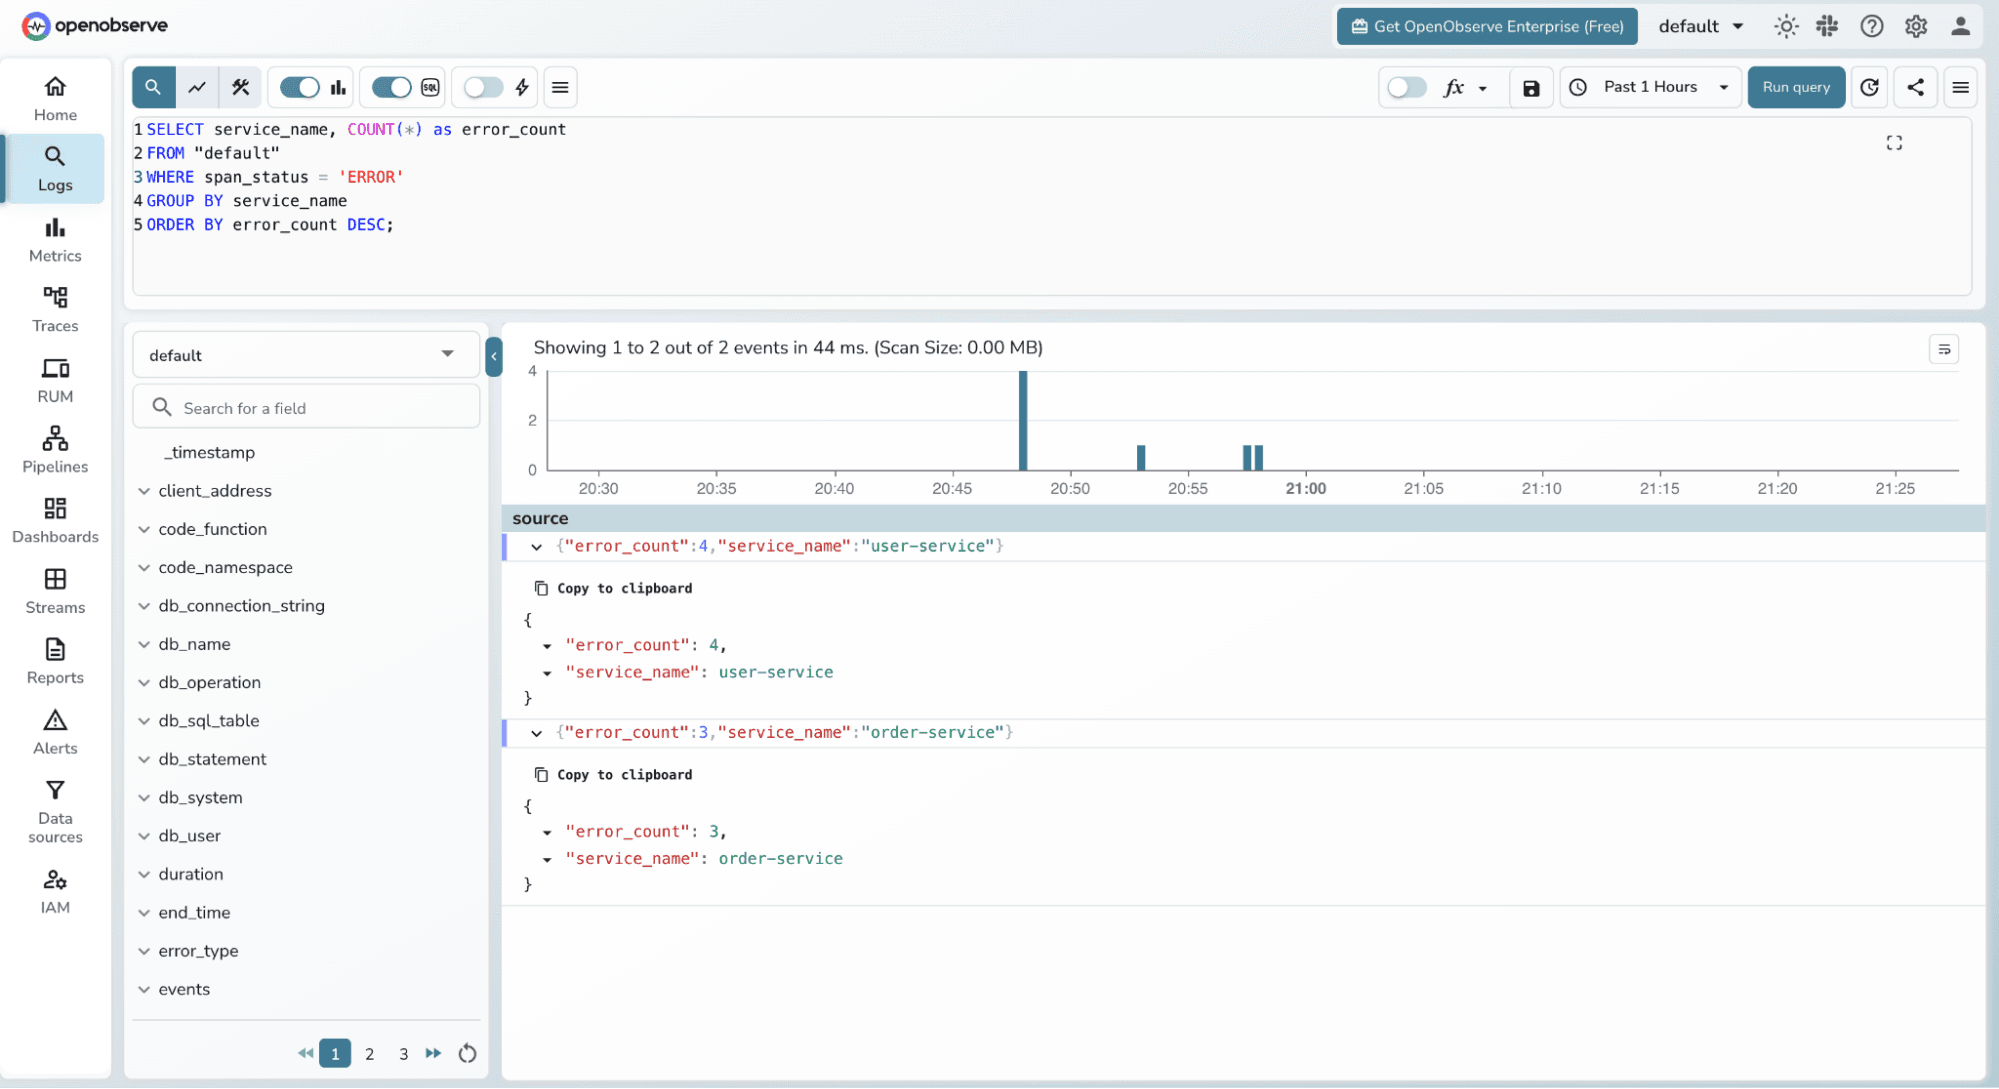
Count errors by service:
SELECT service_name, COUNT(*) as error_count
FROM "default"
WHERE span_status = 'ERROR'
GROUP BY service_name
ORDER BY error_count DESC;
Average latency per service:
SELECT service_name,
       AVG(duration) as avg_duration_us,
       MAX(duration) as max_duration_us,
       COUNT(*) as request_count
FROM "default"
GROUP BY service_name;
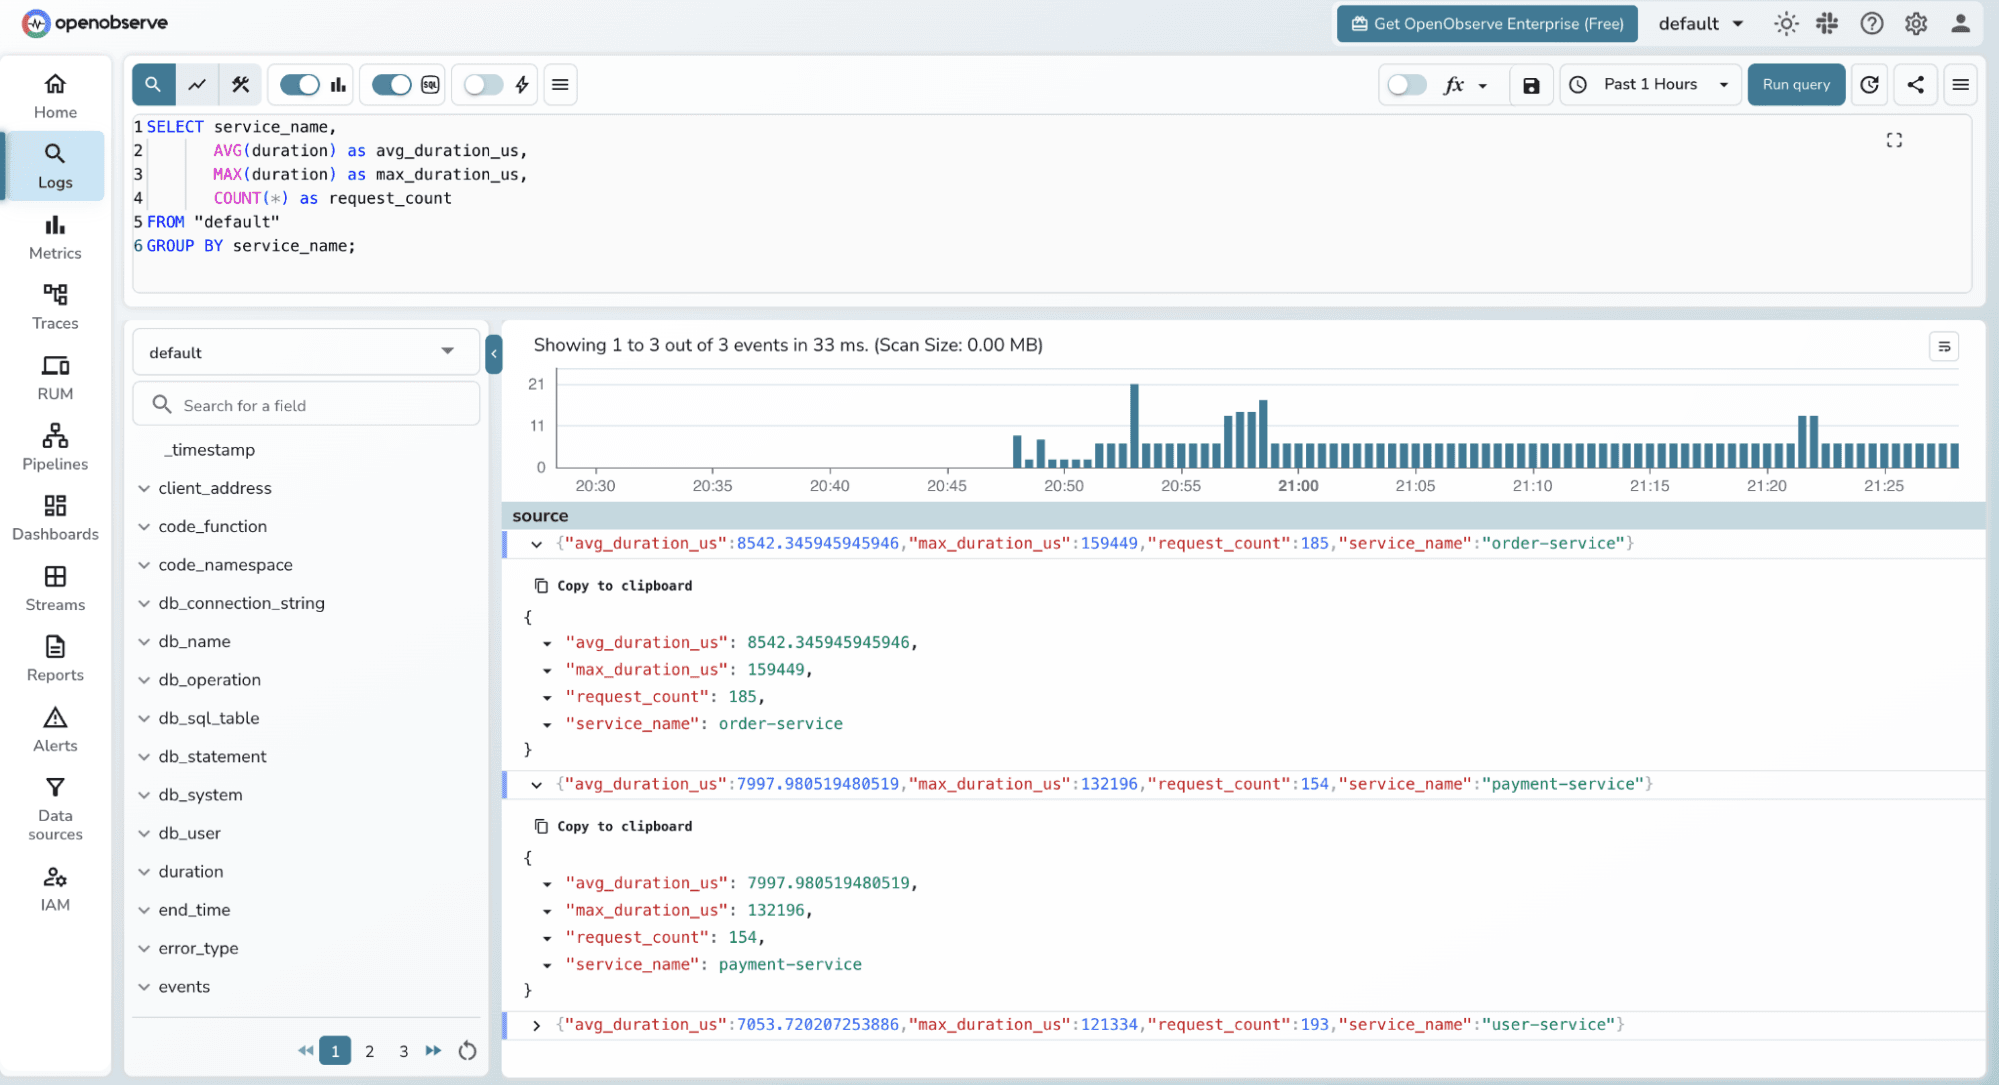
This SQL interface means you can build custom dashboards and alerts on top of your trace data using the same query language you already know.
One thing worth emphasizing: we wrote zero tracing code in any of the Spring Boot services. The OpenTelemetry Java Agent detected and instrumented:
RestTemplate creates a client span and injects traceparent headerstrace_id flows from payment-service to order-service to user-service automatically via the W3C traceparent headerThe agent supports 100+ libraries and frameworks out of the box, including Kafka, gRPC, Redis, Spring Batch, and more.
In this tutorial, we built a complete Java microservices application from scratch and implemented distributed tracing with zero instrumentation code. The combination of the OpenTelemetry Java Agent and OpenObserve gives you:
traceparent headersThe architecture shown here scales directly to production. Swap the single-container OpenObserve setup for a Helm deployment with S3 storage, and you have an enterprise-grade observability stack with no vendor lock-in.
Passionate about observability, AI systems, and cloud-native tools. All in on DevOps and improving the developer experience.