Efficient Kubernetes Log Streaming: Real-time Insights for DevOps

Chaitanya Sistla
October 31, 2024
5 min read
Don’t forget to share!
Getting Started with OpenObserve
Try OpenObserve Cloud today for more efficient and performant observability.
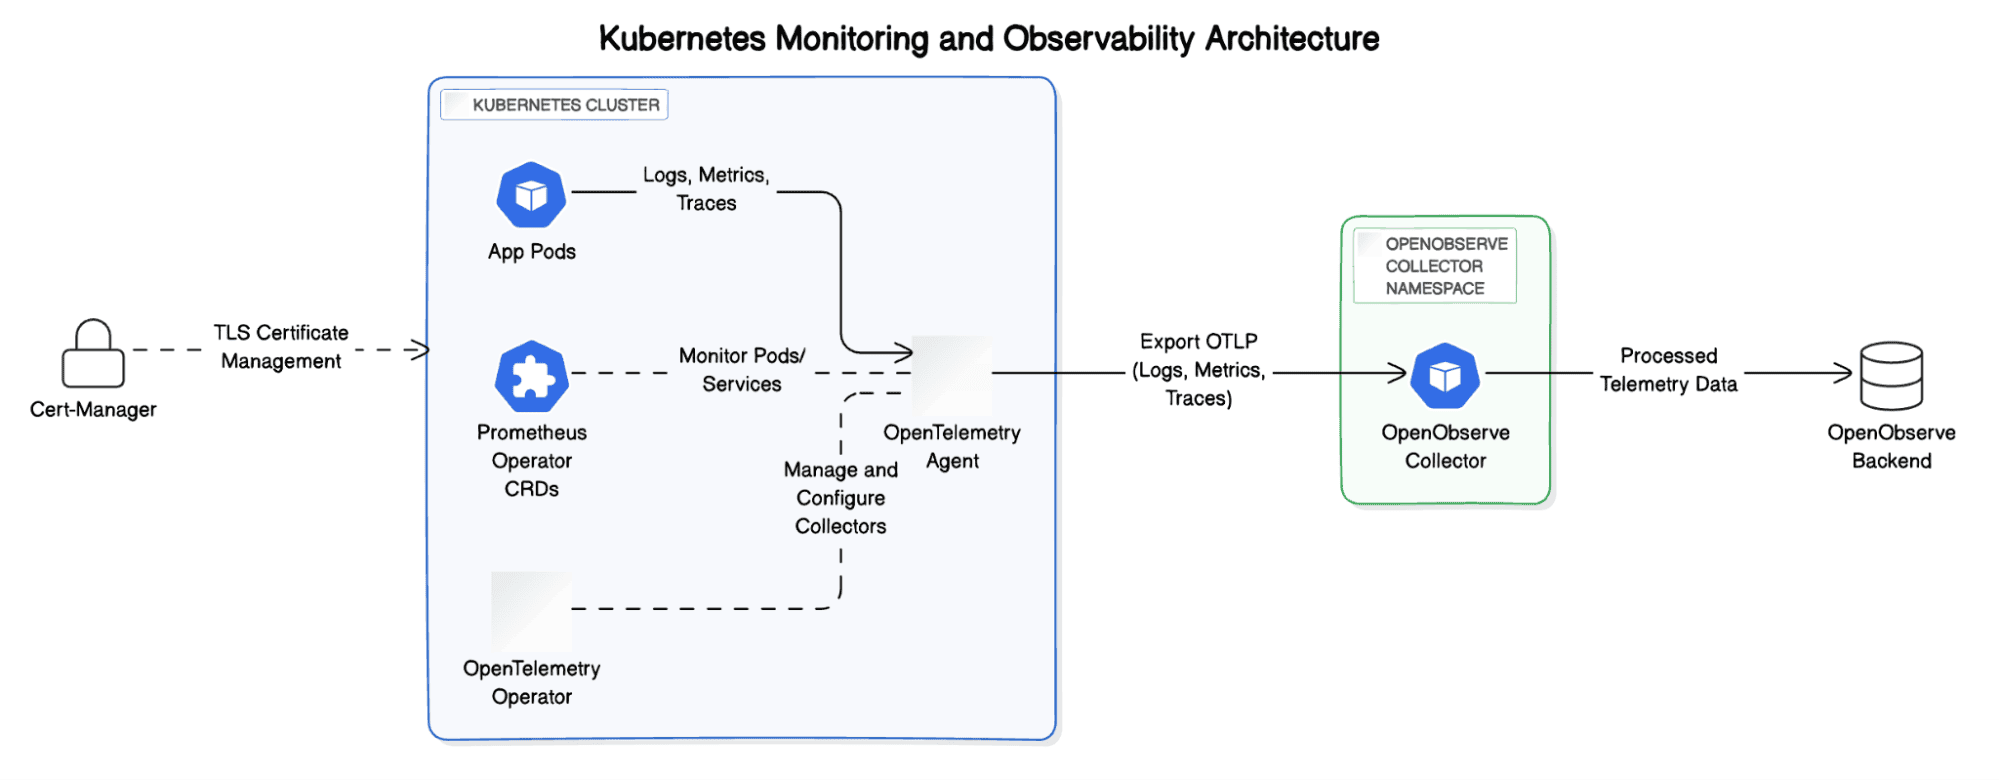
Kubernetes is a powerful container orchestration platform that helps manage complex applications in a scalable way. However, gaining real-time visibility into the logs of these applications can be challenging. Integrating Kubernetes with OpenObserve, a flexible, high-performance log and metrics analysis tool, allows DevOps teams to streamline log collection and analysis. This integration provides real-time insights, crucial for identifying issues quickly and ensuring system reliability.
In this guide, we will walk through the process of setting up real-time Kubernetes log streaming to OpenObserve using Helm and OpenTelemetry.
Ensure you have the following prerequisites before proceeding:
Cert-Manager is a tool to automate the management of TLS certificates within Kubernetes. We need it for securing communication between components:
kubectl apply -f https://github.com/cert-manager/cert-manager/releases/download/v1.13.1/cert-manager.yaml
Cert-Manager will handle the certificates and ensure secure connections between services.
Add the OpenObserve Helm repository to make the OpenObserve components available for installation
helm repo add openobserve https://charts.openobserve.ai
Helm makes it easy to deploy and manage OpenObserve components in your Kubernetes cluster.
The Prometheus Operator manages Kubernetes monitoring components like ServiceMonitors and PodMonitors. Apply these CustomResourceDefinitions (CRDs) to enable Kubernetes-native metrics collection:
kubectl apply -f https://raw.githubusercontent.com/prometheus-operator/prometheus-operator/main/example/prometheus-operator-crd/monitoring.coreos.com_servicemonitors.yaml

kubectl apply -f https://raw.githubusercontent.com/prometheus-operator/prometheus-operator/main/example/prometheus-operator-crd/monitoring.coreos.com_podmonitors.yaml
This step is essential for monitoring pods and services and pushing their metrics to OpenObserve.
OpenTelemetry Operator is an open-source observability tool designed to collect, process, and export metrics and logs from Kubernetes:
kubectl apply -f https://github.com/open-telemetry/opentelemetry-operator/releases/latest/download/opentelemetry-operator.yaml
The OpenTelemetry Operator will be responsible for collecting telemetry data (logs, metrics, and traces) from your Kubernetes cluster.
To isolate the OpenObserve collector deployment, create a separate namespace
kubectl create ns openobserve-collector
This step helps organize resources and manage permissions more effectively.
Now, we will install the OpenObserve collector using Helm:
helm --namespace openobserve-collector \
  install o2c openobserve/openobserve-collector \
  --set exporters."otlphttp/openobserve".endpoint=http://localhost:5080/api/default  \
  --set exporters."otlphttp/openobserve".headers.Authorization="Basic <auth_token>"  \
  --set exporters."otlphttp/openobserve_k8s_events".endpoint=http://localhost:5080/api/default  \
  --set exporters."otlphttp/openobserve_k8s_events".headers.Authorization="Basic <auth_token>"
This command configures the OpenObserve collector to use the OTLP HTTP exporter to send logs and Kubernetes events directly to the specified OpenObserve endpoint. Ensure the provided authorization token is secure and base64-encoded.
Once the installation is complete, check if the pods are running successfully:
kubectl get pods -n openobserve-collector
You should see OpenObserve Collector pods in the Running state. If not, inspect the logs to diagnose issues
kubectl logs -f <pod-name> -n openobserve-collector
With the logs and metrics now streaming to OpenObserve, open the OpenObserve dashboard to start analyzing Kubernetes logs in real time. Use filters and search queries to troubleshoot issues, monitor system health, and identify performance bottlenecks.
| Feature | OpenTelemetry Operator | OpenTelemetry Collector |
|---|---|---|
| Kubernetes-native controller | Built specifically to work seamlessly within Kubernetes. | Can run as a standalone service, not limited to Kubernetes. |
| Simplifies deployment & management | Handles the installation and lifecycle of OpenTelemetry components. | Suitable for both Kubernetes and non-Kubernetes environments, making it effective for hybrid setups. |
| Automated updates & scaling | Uses Kubernetes' reconciliation loop to automatically update and scale based on resource usage. | Offers powerful data transformation, filtering, and aggregation capabilities. |
| Declarative setup | Uses Infrastructure as Code (IaC) principles, making observability configuration easier to manage and track. | Gathers data from various sources for centralized processing. |
| Dynamic adaptation | Adapts to workload changes automatically, ensuring smooth operations. | Can be deployed independently of Kubernetes, making it better for managing data in hybrid or multi-cloud environments. |
| Ideal for Kubernetes environments | Best suited for teams looking for a streamlined, Kubernetes-integrated observability solution. | Excels at handling cross-environment data processing. |
Integrating Kubernetes with OpenObserve using the OpenTelemetry Operator enables seamless log streaming and real-time observability, empowering DevOps teams to efficiently manage containerized workloads. This Kubernetes-native approach offers flexibility and scalability, making it ideal for dynamic cloud environments.
By following this guide, you can set up efficient log streaming and gain real-time insights to improve system reliability and performance. With OpenObserve, you can:
Don't let the complexity of Kubernetes hold you back. Sign up for OpenObserve today and experience the power of real-time observability in your Kubernetes environment. Take your monitoring to the next level and ensure the smooth operation of your containerized applications.
Get started now and unlock the full potential of your Kubernetes cluster with OpenObserve! 🚀
Chaitanya Sistla is a Principal Solutions Architect with 17X certifications across Cloud, Data, DevOps, and Cybersecurity. Leveraging extensive startup experience and a focus on MLOps, Chaitanya excels at designing scalable, innovative solutions that drive operational excellence and business transformation.