What Nobody Tells You About Running AI in Production
Twelve config-level tactics for observability cost optimization, sampling, pipeline filtering, retention tiers, and cardinality control, with before/after numbers and real config examples for logs, metrics, and traces.
Compare the best log visualization tools in 2026: OpenObserve, Kibana, Grafana Loki, Datadog, and Splunk. Covers AI-assisted analysis, dashboard quality, and cost.
Discover the best Elasticsearch alternatives in 2026. Compare OpenObserve, OpenSearch, ClickHouse, Grafana Loki, and Solr on cost, search performance, and deployment options.
A practical comparison of the top log management tools in 2026: OpenObserve, Splunk, Datadog, Grafana Loki, and Elastic. Covers collection, indexing, retention, and cost for modern DevOps and SRE teams.
Discover the best Splunk alternatives in 2026. Compare open-source and enterprise tools for log management, SIEM, and observability. Find cost-effective solutions with our comprehensive guide.
Explore the top observability tools and platforms in 2026. Compare features, use cases, and alternatives to Datadog for logs, metrics, and traces in this complete guide.
Compare the top 10 open source observability tools in 2026: OpenObserve, Prometheus, Grafana, Jaeger, and Loki. Covers logs, metrics, traces, deployment options, and cost trade-offs.
Compare the best Datadog alternatives in 2026 with real cost data, technical analysis, and migration guides. OpenObserve delivers 60-90% cost savings with unified observability for logs, metrics, and traces.
Discover the top open-source Grafana alternatives in 2026. Compare features like dashboards, alerting, metrics, logs, traces, scalability, and ease of use for modern DevOps teams.
A comprehensive comparison of the top 10 log monitoring tools in 2026 highlighting their strengths, trade-offs, and use-cases.
A comprehensive comparison of the best log analysis tools in 2026, covering search, pattern detection, anomaly detection, and pipeline capabilities for engineering and SRE teams.
Stop tab-switching at 3AM. Wire trace_id into logs and exemplars into metrics so you can pivot from alert to root cause in seconds, not hours.
A working pipeline for monitoring Kubernetes logs at scale: the openobserve-collector Helm chart for the fast path, or Fluent Bit + OpenTelemetry Collector for full control. Helm configs, multi-cluster routing, retention math.
Elasticsearch was built for search, not logs. Learn how to migrate your ELK log pipeline to OpenObserve using OTel Collector or Fluent Bit.
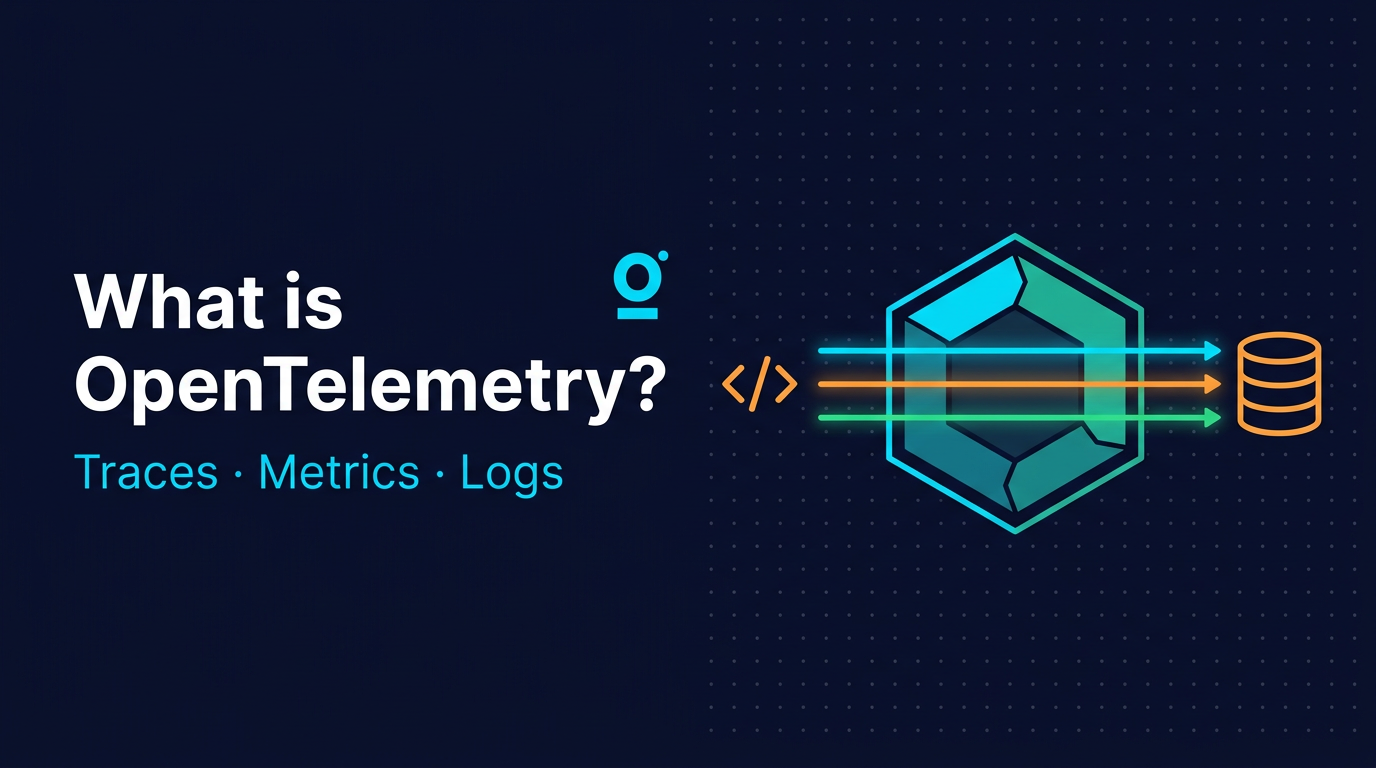
A complete guide to OpenTelemetry: what it is, how the Collector and OTLP work, and how to instrument your first service.
Learn how to implement structured logging in production. Improve debugging, searchability, and observability with best practices and real-world examples.
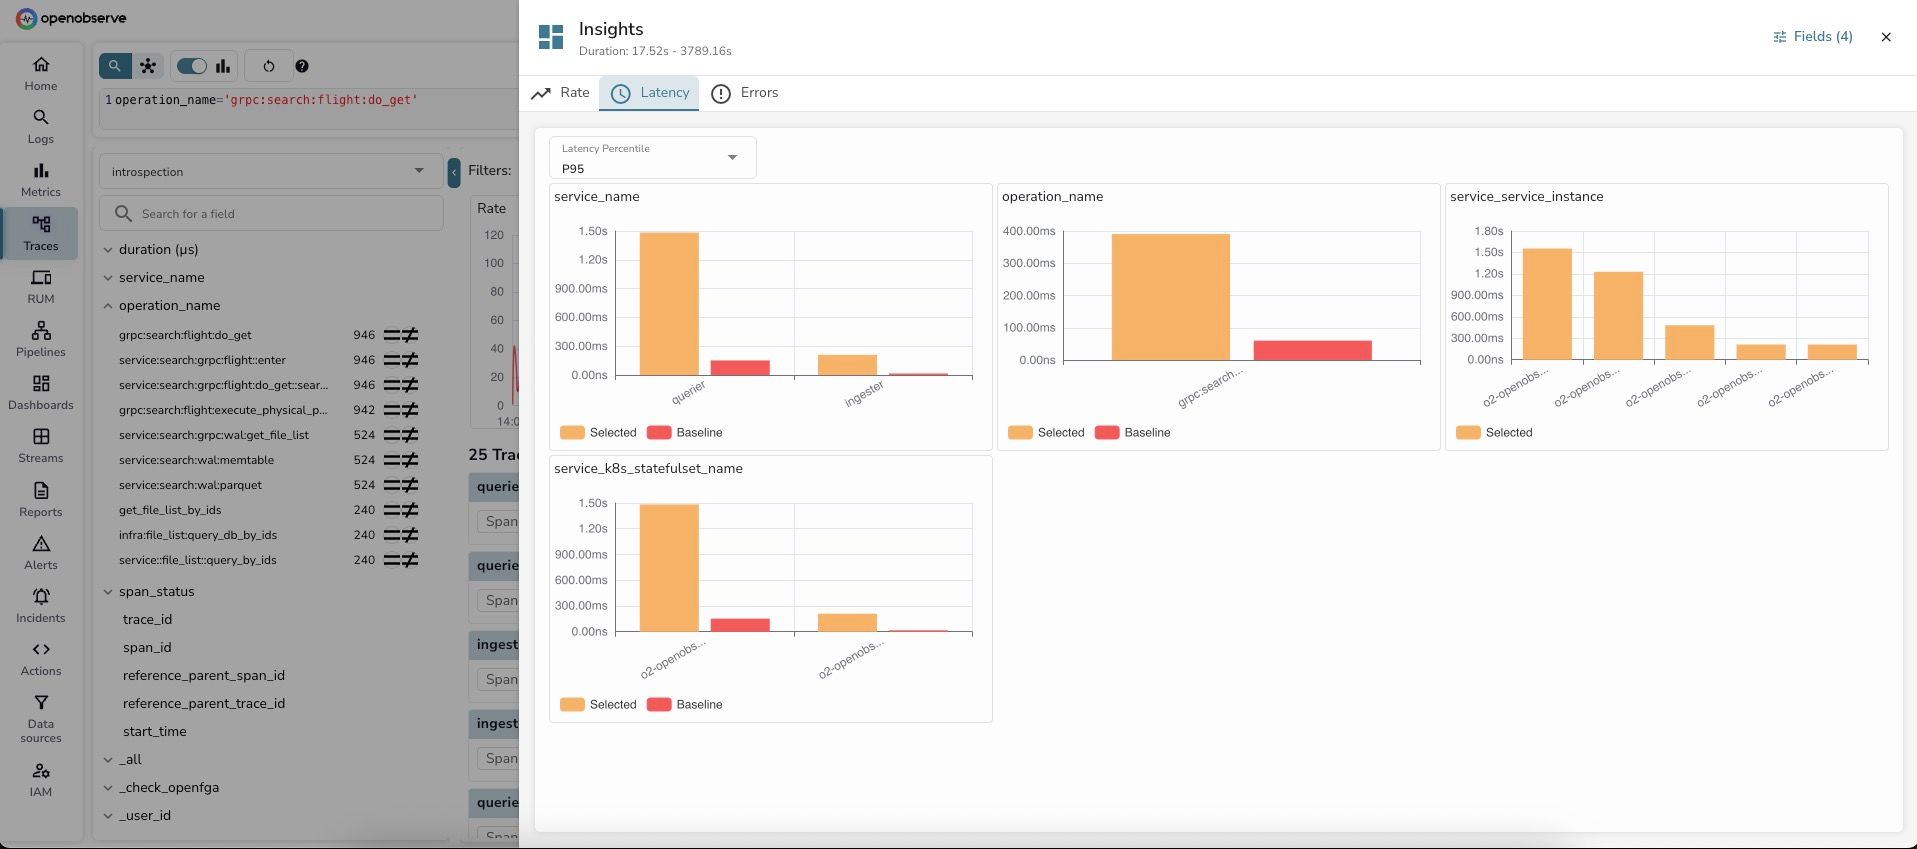
Learn how to use OpenObserve Insights for interactive log and trace analysis. Identify root causes in 60 seconds with dimension analysis. Real examples, step-by-step guides, and troubleshooting tips.
Automatically extract patterns from millions of logs in seconds. Learn how OpenObserve's log pattern analysis helps SREs reduce incident investigation time from 30 minutes to under 5 minutes.
Real-world comparison of DataDog and OpenObserve for log management. SQL queries, automatic field discovery, and 90% cost savings. Tested with OpenTelemetry.
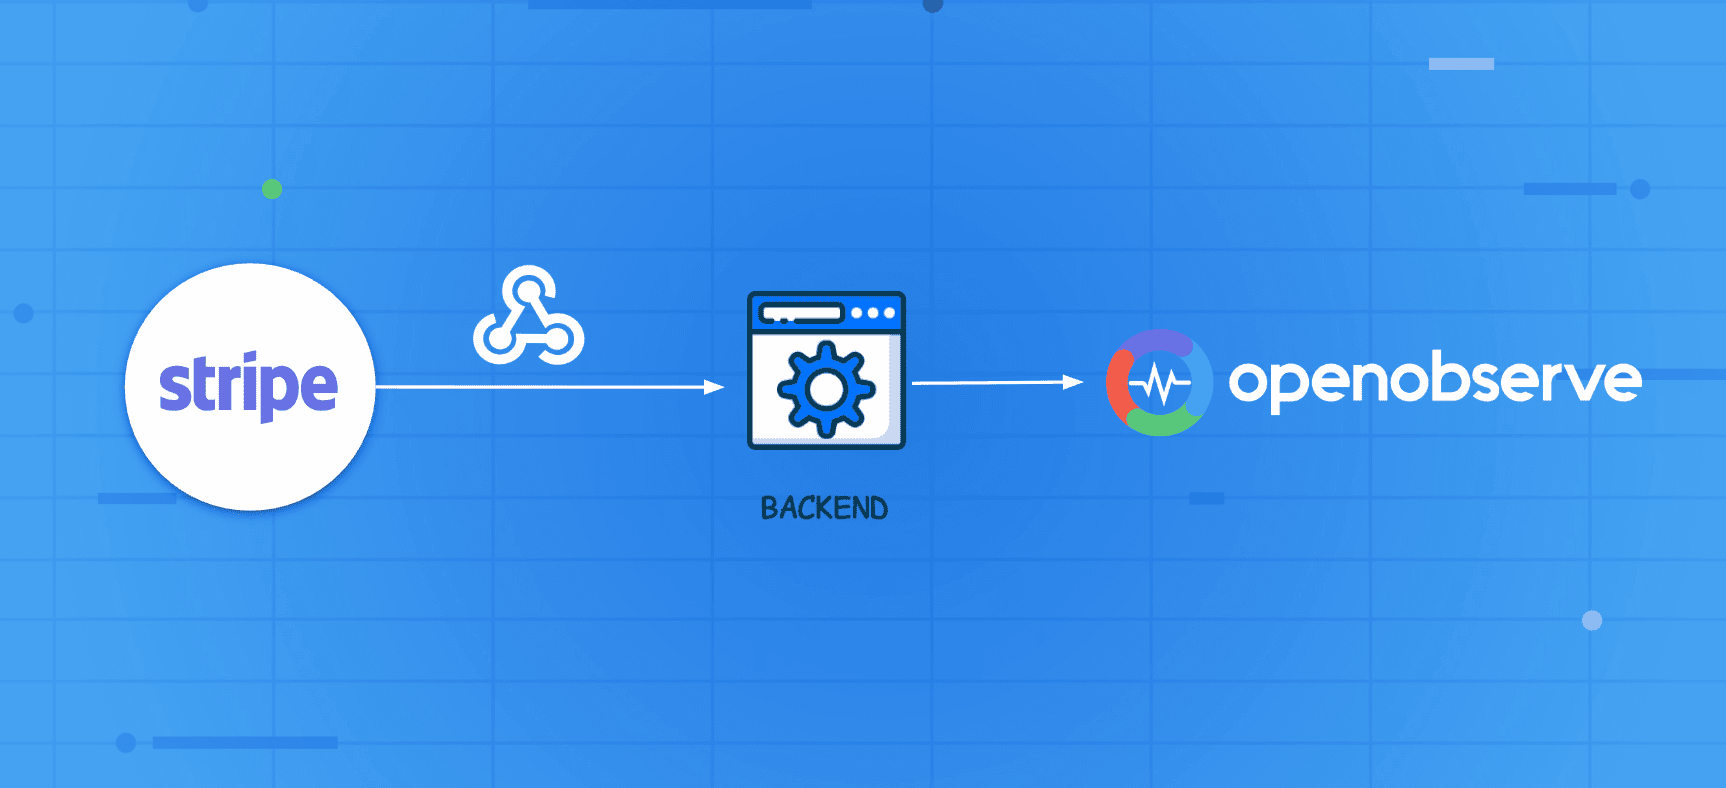
Enable end-to-end payment monitoring by sending Stripe events to OpenObserve and analyzing success/failure rates using dashboards, SQL queries, and alerts.
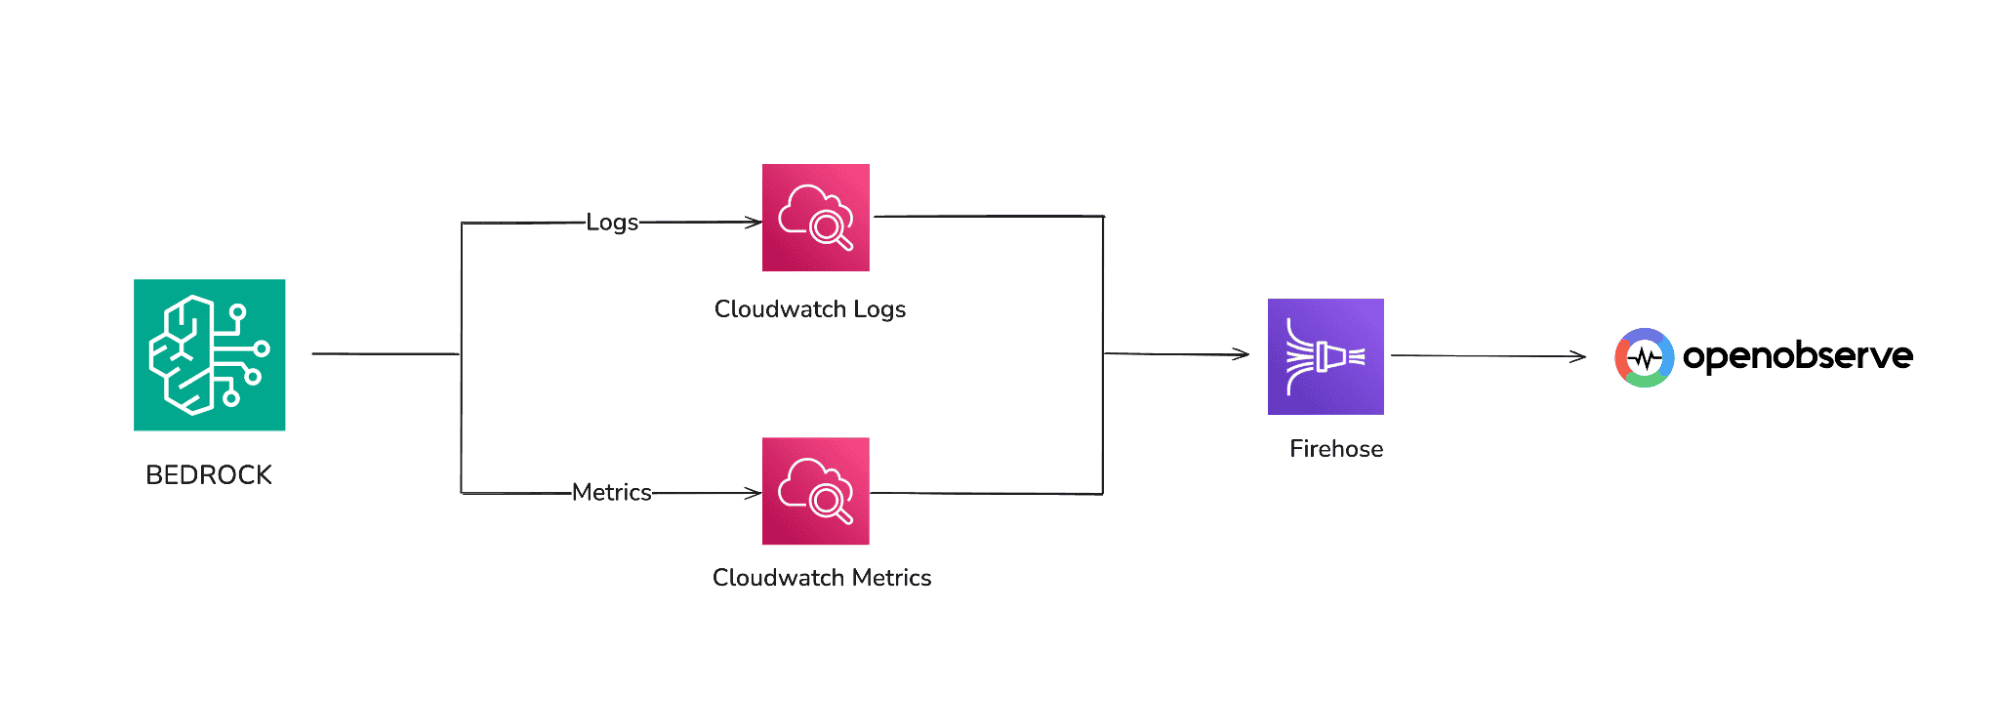
Learn how to monitor AWS Bedrock with CloudWatch, Kinesis Firehose, and OpenObserve. Track latency, errors, token usage, and model performance in real-time.