Monitoring Apache Cassandra with OpenTelemetry: Metrics, Logs, and Dashboards


Try OpenObserve Cloud today for more efficient and performant observability.

Apache Cassandra is a highly scalable, distributed NoSQL database designed to handle vast amounts of data across multiple nodes with high availability and fault tolerance. It is widely used for real-time applications requiring low-latency read and write operations.
Cassandra’s architecture follows a peer-to-peer distributed model, eliminating single points of failure. It is ideal for applications that demand high throughput and scalability, such as IoT, AI, and large-scale web applications.
Monitoring Cassandra is crucial for ensuring optimal performance, identifying bottlenecks, and troubleshooting issues before they impact users. Key reasons for monitoring Cassandra include:
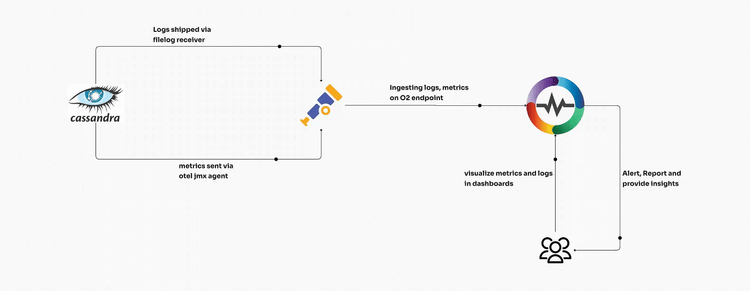
To effectively monitor Cassandra, we will set up OpenTelemetry (OTel) to collect both metrics and logs. OpenTelemetry’s JMX receiver helps gather JVM and Cassandra-specific metrics, while file-based log collection ensures log visibility.
To collect Cassandra metrics via JMX, download the OpenTelemetry JMX Metrics JAR:
wget https://github.com/open-telemetry/opentelemetry-java-contrib/releases/download/v1.32.0/opentelemetry-jmx-metrics.jar -O /opt/opentelemetry-java-contrib-jmx-metrics.jar
Create or update the OpenTelemetry configuration file (/etc/otel-collector-config.yaml) with the following settings:
You can visit this blog to install otel.
receivers:
  jmx:
    jar_path: /opt/opentelemetry-java-contrib-jmx-metrics.jar
    endpoint: localhost:9000
    target_system: cassandra,jvm
    collection_interval: 60s
  filelog/std:
    include:
      - /var/log/cassandra/*.log
    start_at: beginning
  otlp:
    protocols:
      grpc:
      http:
processors:
  resourcedetection:
    detectors: ["system"]
    system:
      hostname_sources: ["os"]
  batch:
extensions:
  zpages: {}
exporters:
  otlphttp/openobserve:
    endpoint: https://example.com/api/default/  # add these configurations from O2 data source section
    headers:
      Authorization: "Basic gregrgregrtgrg=="  # add these configurations from O2 data source section
      stream-name: blog_cassandra
service:
  pipelines:
    metrics:
      receivers: [jmx]
      processors: [resourcedetection, batch]
      exporters: [otlphttp/openobserve]
    logs:
      receivers: [filelog/std, otlp]
      processors: [batch]
      exporters: [otlphttp/openobserve]
This configuration does the following:
/var/log/cassandra. otlp receiver. blog_cassandra).Modify the Cassandra environment file (/etc/cassandra/cassandra-env.sh) to enable JMX monitoring:
JVM_OPTS="$JVM_OPTS -Dcom.sun.management.jmxremote.port=9000"
JVM_OPTS="$JVM_OPTS -Dcom.sun.management.jmxremote.rmi.port=9000"
JVM_OPTS="$JVM_OPTS -Dcom.sun.management.jmxremote.authenticate=false"
JVM_OPTS="$JVM_OPTS -Dcom.sun.management.jmxremote.ssl=false"
After making these changes, restart Cassandra and the OpenTelemetry Collector to apply the configurations:
systemctl restart cassandra
systemctl restart otel-collector
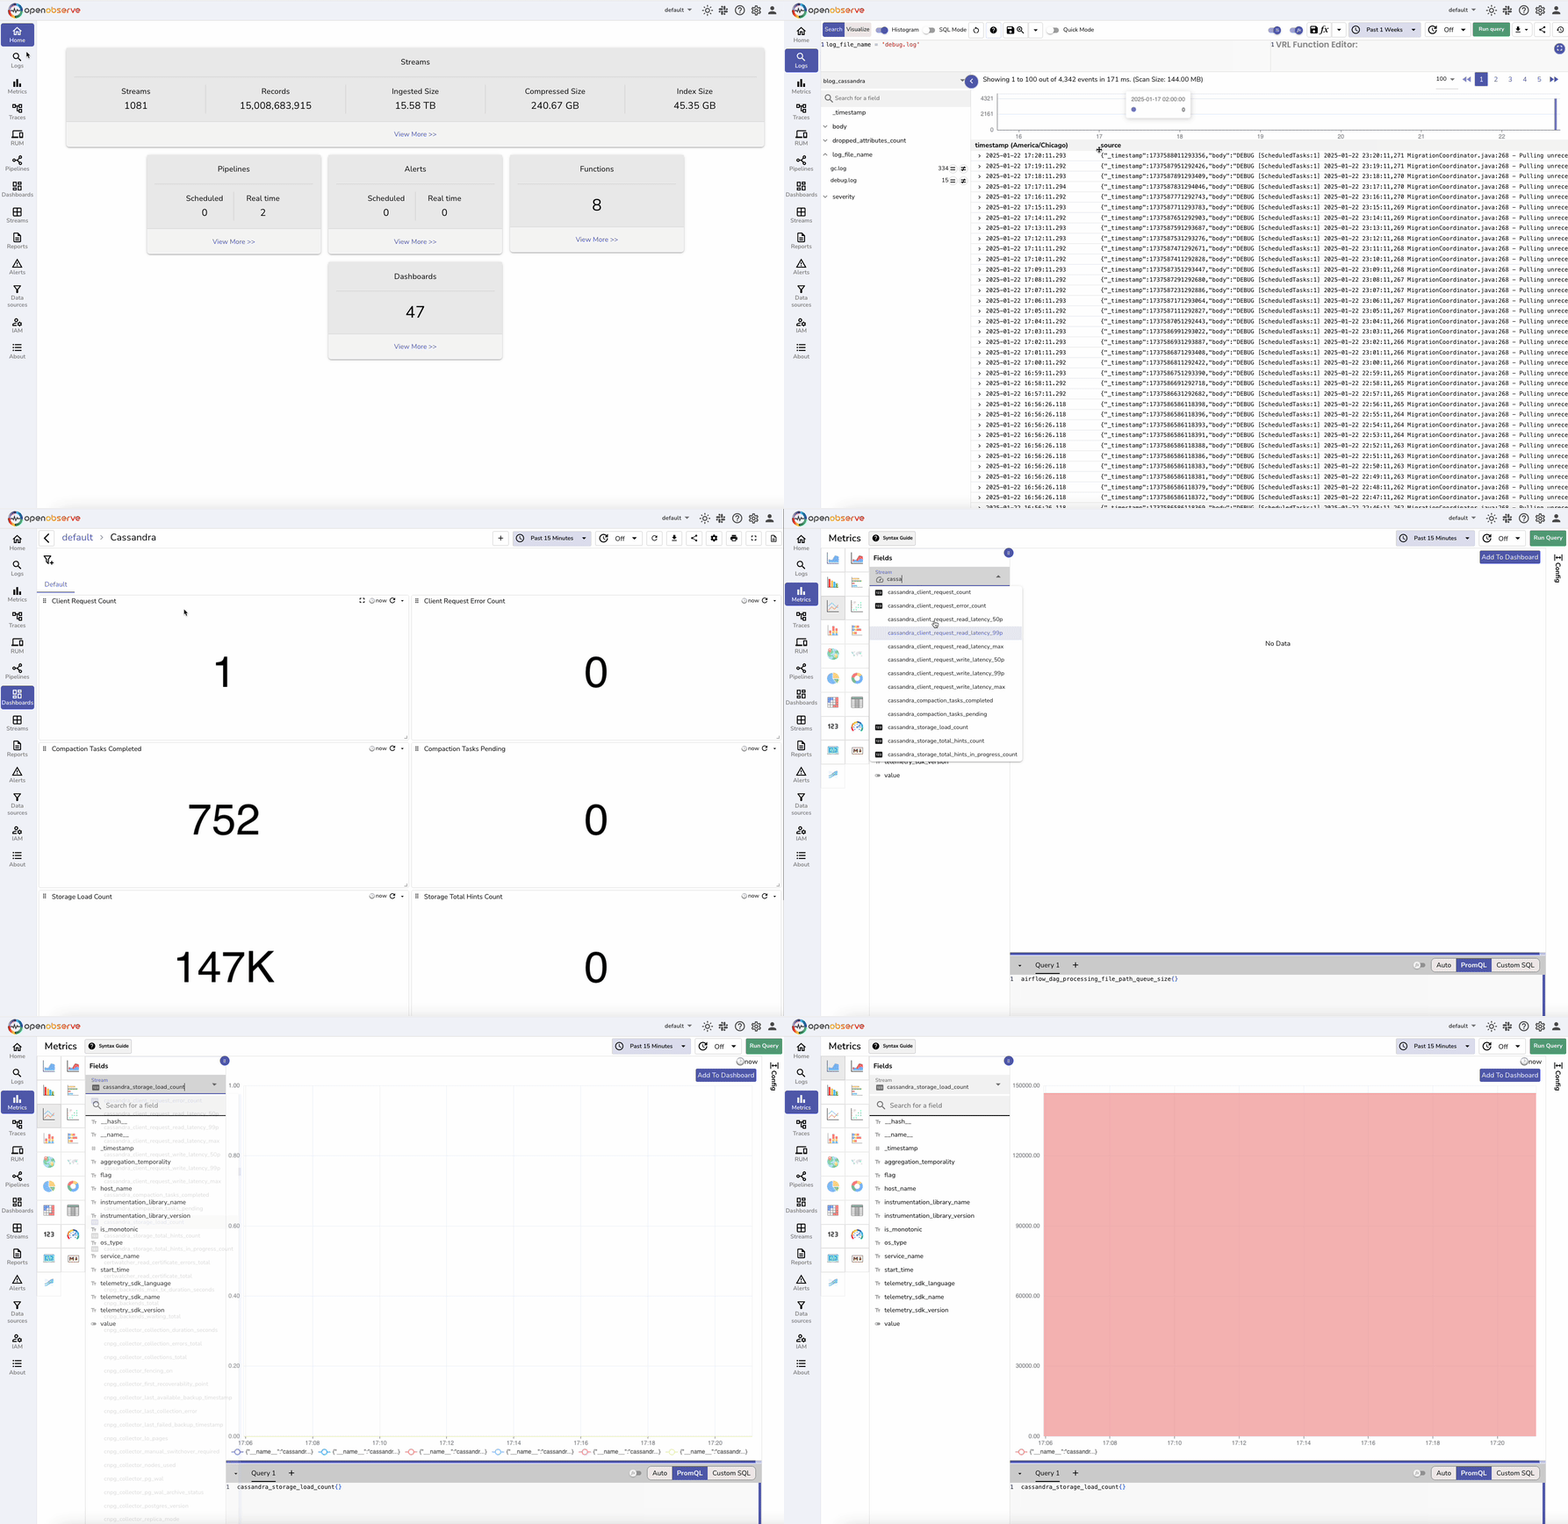
Now that you have configured everything, you can visualize collected logs and metrics, we can build these dashboards for the below:

By integrating OpenTelemetry with Cassandra, you gain deep insights into system health, performance, and security. This guide covers everything from setting up JMX monitoring to log collection, ensuring your Cassandra clusters remain optimized and reliable. With the right monitoring strategy, you can proactively detect and resolve issues before they impact business operations.
Start monitoring your Cassandra clusters today and unlock the full potential of observability with OpenTelemetry and OpenObserve!

Chaitanya Sistla is a Principal Solutions Architect with 17X certifications across Cloud, Data, DevOps, and Cybersecurity. Leveraging extensive startup experience and a focus on MLOps, Chaitanya excels at designing scalable, innovative solutions that drive operational excellence and business transformation.