Top Infrastructure and IT Monitoring Tools for 2024

Introduction
The importance of comprehensive monitoring solutions cannot be overstated in today’s rapidly evolving technological environment. For developers, engineering managers, and tech-savvy professionals, these tools are not just conveniences; they are necessities.
Monitoring tools provide the eyes and ears needed to ensure that your infrastructure and IT systems are performing optimally, are healthy, and are free from anomalies that could disrupt operations.
Importance and Benefits of Advanced Monitoring Solutions
The benefits of implementing advanced monitoring solutions are manifold. They offer real-time insights into the performance of your systems, allowing you to detect and address issues before they escalate.
This proactive approach not only reduces downtime but also enhances the overall efficiency of your operations.
Furthermore, these solutions can help optimize resource usage, saving costs and improving system longevity.
Continuous Performance, Health, and Anomaly Checks for Optimal Performance and Swift Issue Resolution
One of the key features of top-tier monitoring tools is their ability to conduct continuous checks on system performance, health, and anomalies.
This constant vigilance ensures that any deviations from the norm are quickly identified and rectified.
For instance, OpenObserve, a sophisticated log search, infrastructure monitoring, and APM solution, exemplifies this capability. It's designed to reduce storage costs significantly while providing a comprehensive observability platform that operates at a petabyte scale.
In essence, the right monitoring tools are indispensable for modern data teams. They not only keep your systems running smoothly but also contribute to a more streamlined, cost-effective, and resilient IT infrastructure. As we delve deeper into the top infrastructure and IT monitoring tools for 2024, keep in mind that the goal is to find a solution that aligns with your specific needs, offering the right blend of simplicity, sophistication, and scalability.
Transform your monitoring strategy with OpenObserve, the tool that brings clarity and control to your infrastructure. Get started now and unlock a new level of performance and reliability.
Core Benefits of Infrastructure and IT Monitoring
In the realm of infrastructure and IT monitoring, the advantages extend far beyond simple oversight.
These tools are pivotal in optimizing project performance, enhancing user experiences, and ensuring that your systems are both robust and resilient.
Let's explore some of the core benefits that make these monitoring tools indispensable in today's tech-driven world.
- Project Performance Optimization and Enhancement of the User Experience
At the heart of any successful project lies optimized performance and a seamless user experience.
Monitoring tools play a crucial role in achieving this by providing real-time insights into system behavior and resource utilization. This allows you to fine-tune your infrastructure, ensuring that it delivers the desired outcomes efficiently.
Moreover, by identifying potential bottlenecks or issues early on, you can prevent them from impacting the user experience, thereby maintaining high levels of satisfaction and engagement.
- Capacity to Ingest Data from a Wide Array of Sources
One of the standout features of modern monitoring solutions is their ability to ingest data from a diverse range of sources.
This flexibility is crucial in today's complex IT environments, where data can originate from various systems, applications, and devices.
OpenObserve, for example, is designed to work seamlessly with logs, metrics, traces, and analytics, making it a versatile tool for comprehensive monitoring. By aggregating and analyzing data from multiple sources, these tools provide a holistic view of your infrastructure's performance.
Elevate your monitoring strategy with OpenObserve. Experience the ease of a cloud-native platform that simplifies your IT infrastructure oversight. Sign up for our cloud service and start optimizing your operations today.
- Monitoring of Detecting and Reporting Outages
Downtime can be costly, both in terms of financial losses and reputational damage. Monitoring tools are essential for detecting and reporting outages promptly, minimizing their impact on your operations.
They can alert you to potential issues before they escalate into full-blown outages, allowing you to take corrective action swiftly. This proactive approach to outage management is vital for maintaining high availability and ensuring business continuity.
- Proactive Monitoring and Using Collected Data to Determine the Root Cause
Beyond mere detection, proactive monitoring involves using the collected data to analyze trends, predict potential problems, and determine the root cause of issues.
This depth of analysis enables you to address the underlying factors that contribute to system instability or inefficiency.
Tools like OpenObserve, with their advanced analytics capabilities, empower you to make informed decisions based on comprehensive data insights, ultimately leading to more effective problem resolution and system optimization.
As we delve deeper into the top monitoring tools for 2024, it's important to consider these benefits in the context of your specific needs and objectives, ensuring that you choose a solution that aligns with your goals and enhances your overall IT strategy.
Top Infrastructure and IT Monitoring Tools for 2024
As we step into 2024, the landscape of infrastructure and IT monitoring tools continues to evolve, offering more advanced solutions to meet the growing demands of modern tech environments.
Here's a rundown of the top tools to keep an eye on, each bringing unique capabilities to the table.
- OpenObserve
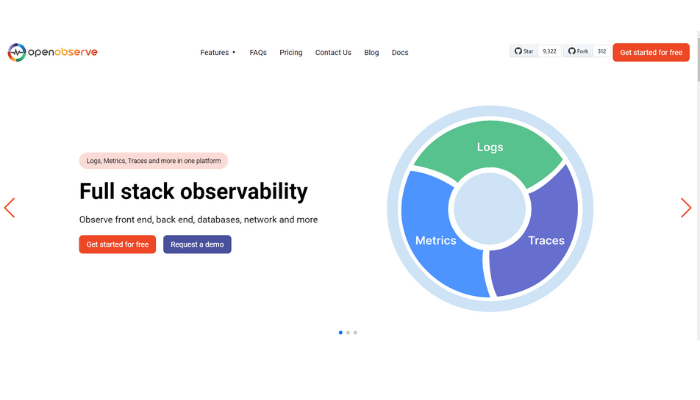
Kicking off the list is OpenObserve, a cloud-native observability platform that's gaining traction for its simplicity and sophistication. Designed for logs, metrics, traces, and analytics, OpenObserve operates at petabyte scale, making it a powerhouse for handling vast amounts of data.
Its ease of operation sets it apart from competitors like Elasticsearch, with a setup time of under two minutes.
OpenObserve's storage cost reduction is remarkable, boasting a ~140x decrease compared to Elasticsearch, thanks to its compatibility with storage services such as S3, GCS, Minio, and Azure Blob. Its stateless nodes architecture ensures smooth scaling, while its advanced GUI facilitates efficient management of diverse observability data.
The platform supports SQL as its primary query language, eliminating the learning curve for new query languages. It also offers PromQL for querying metrics data, adding to its versatility. With built-in alerting mechanisms, users can dispatch alerts to platforms like Slack and Teams, ensuring timely responses to critical issues.
OpenObserve's features include:
- SQL-Based Query Language: Leverage familiar SQL for queries.
- Alerts: Real-time and scheduled alerts improve monitoring capabilities.
- Dashboards: Visualize real-time data from logs, metrics, and traces.
- Data Storage in Object Store: Significantly lower storage costs with support for various storage services.
- Dynamic Schema Evolution: Easily ingest logs without worrying about schema changes.
- Security: Fine-grained RBAC for enhanced security.
- Advanced GUI: User-friendly interface for seamless navigation.
- User-Defined Ingest & Query Functions: Customize data parsing and normalization.
- Localization: Supports multiple languages for global accessibility.
Explore OpenObserve's open-source platform on GitHub or sign up for services on the website to experience cost-effective and efficient monitoring.
Ready to see OpenObserve in action? Book a demo and witness firsthand how our platform can transform your monitoring approach, ensuring efficiency, scalability, and cost-effectiveness.
- Datadog
Datadog is a versatile monitoring solution for servers, applications, databases, tools, and services, with advanced alerting triggers to keep you informed about your infrastructure's health.
Datadog’s features include:
- Real-time monitoring of infrastructure and applications
- Advanced alerting with complex triggers
- Integration with a wide range of services and tools
- Customizable dashboards for data visualization
- Log management and analysis
- Performance and availability testing
- Dynatrace
Dynatrace provides advanced monitoring, analytics, and management capabilities for cloud-native and hybrid environments, offering a holistic view of your infrastructure's performance.
Dynatrace’s features include:
- Full-stack monitoring from applications to infrastructure
- AI-powered root cause analysis
- Cloud and hybrid environment support
- Real user monitoring for web applications
- Automation and orchestration capabilities
- Integration with popular DevOps tools
- SolarWinds

SolarWinds offers real-time tracking of performance metrics and supports multi-vendor devices, making it a versatile choice for monitoring diverse IT environments.
SolarWinds’ features include:
- Real-time network performance monitoring
- Multi-vendor device support
- Network configuration management
- NetFlow traffic analysis
- Server and application monitoring
- Customizable dashboards and alerts
- New Relic
New Relic specializes in application monitoring, error tracking, and synthetic testing, providing insights to optimize application performance and user experience.
New Relic’s features include:
- Application performance monitoring (APM)
- Real user monitoring (RUM)
- Synthetic monitoring for proactive testing
- Error tracking and diagnostics
- Infrastructure monitoring
- Customizable dashboards and alerts
- Prometheus
Prometheus is known for its time-series database and powerful querying language (PromQL), offering a robust framework for monitoring and alerting.
Prometheus’ features include:
- Time-series database for metrics storage
- Powerful querying language (PromQL)
- Built-in alerting rules and notifications
- Multidimensional data model
- Integration with Grafana for visualization
- Scalable and highly available architecture
- Zabbix
Zabbix provides customizable thresholds and alerts, along with visualization features, making it easier to interpret data and identify trends in your monitoring data.
Zabbix’s features include:
- Customizable thresholds for alerts
- Real-time monitoring of network, server, and application performance
- Visualization features for data analysis
- Auto-discovery of network devices and services
- Distributed monitoring architecture
- Integration with third-party tools and services
- PRTG Network Monitor
PRTG Network Monitor offers comprehensive network monitoring and management capabilities, with customizable sensors to tailor monitoring to specific needs.
It’s features include:
- Comprehensive network monitoring
- Customizable sensors for specific monitoring needs
- Bandwidth and traffic analysis
- Server and application monitoring
- Alerts and notifications system
- Easy-to-use web interface and dashboards
- AppDynamics
AppDynamics focuses on application performance monitoring and infrastructure visibility, ensuring smooth and efficient operation of your applications.
Some of its features are:
- Application performance monitoring (APM)
- End-to-end visibility across infrastructure
- Business transaction monitoring
- Real user monitoring (RUM)
- Database and server monitoring
- Automated root cause analysis
- ManageEngine OpManager
ManageEngine OpManager provides comprehensive monitoring for network devices, servers, and applications, offering a unified view of your IT infrastructure.
Its features include:
- Network device and server monitoring
- Application performance monitoring
- Customizable dashboards and reports
- Fault management and alerting
- Bandwidth and traffic analysis
- Virtualization monitoring
- Sentry
Sentry is a dedicated tool for error monitoring and crash reporting, helping developers quickly identify and resolve issues to maintain application stability.
Sentry’s features include:
- Real-time error tracking and monitoring
- Crash reporting and diagnostics
- Customizable alerts and notifications
- Integration with popular development tools
- Performance monitoring
- Issue tracking and resolution workflow
- Grafana
Grafana is renowned for its data visualization and monitoring capabilities, compatible with a wide range of data sources for flexible analytics.
Some of Grafana’s features include:
- Advanced data visualization
- Compatibility with diverse data sources
- Customizable dashboards
- Alerting and notifications
- Annotation and collaboration features
- Support for multiple authentication methods
Each of these monitoring tools brings unique strengths to the table, catering to different needs and preferences. As you explore these options, consider how they align with your infrastructure and IT monitoring requirements to ensure optimal performance and reliability in 2024.
With that in mind, it’s important to keep some things in mind before going ahead with your chosen solution.
Best Practices in Infrastructure and IT Monitoring
As you delve into the world of infrastructure and IT monitoring tools, it's crucial to adopt best practices that ensure you're getting the most out of your chosen solutions.
Here are some key guidelines to follow:
- Organize Your Notifications and Alerts
An effective monitoring system is only as good as its alerting mechanism.
It's essential to organize your notifications and alerts in a way that ensures you're promptly informed about critical issues without being overwhelmed by false alarms or minor glitches.
Prioritize alerts based on severity and set up escalation protocols to ensure that the right people are notified at the right time.
- Monitor Baseline Metrics and KPIs
To truly understand the health and performance of your infrastructure, you need to establish and monitor baseline metrics and key performance indicators (KPIs).
This includes tracking resource utilization, response times, error rates, and other vital metrics.
By comparing current performance against these baselines, you can quickly identify anomalies and take corrective action.
- Pick Your Partner Wisely
When selecting a monitoring tool, it's important to choose a partner that aligns with your organization's needs and goals.
Consider factors such as scalability, ease of integration, support for diverse data sources, and cost-effectiveness.
Tools like OpenObserve stand out for their simplicity, scalability, and cost savings, making them a wise choice for organizations looking to optimize their monitoring strategies.
Join the OpenObserve revolution and take the first step towards smarter, more effective monitoring. Visit our website to learn more about how we can help you stay ahead in the ever-evolving world of technology.
- Make Sure Your Teams Get the Right Data
Effective monitoring is not just about collecting data; it's about ensuring that the right data is accessible to the right teams at the right time.
This means setting up dashboards and reports that provide actionable insights and enable quick decision-making.
Encourage collaboration between teams to share insights and best practices, and ensure that everyone has the training and resources needed to make the most of the monitoring tools at their disposal.
By adhering to these best practices, you can create a robust infrastructure and IT monitoring strategy that not only keeps your systems running smoothly but also drives continuous improvement and innovation within your organization.
Conclusion
In conclusion, it's clear that infrastructure and IT monitoring play a pivotal role in ensuring the health, performance, and security of your systems.
As you move forward in this tech-driven era, remember that the effectiveness of your monitoring strategy hinges on the tools you choose and how well you utilize them.
The significance of selecting the right monitoring tool cannot be overstated. It's a decision that impacts not just your day-to-day operations but also your organization's ability to innovate, respond to challenges, and maintain a competitive edge. Tools like OpenObserve offer a blend of simplicity, scalability, and cost-efficiency, making them a smart choice for those looking to streamline their monitoring practices.
As you refine your infrastructure and IT monitoring approach, keep in mind that it's not just about keeping an eye on your systems; it's about empowering your teams, driving efficiency, and ensuring that your technology infrastructure supports your business goals. So, choose wisely, use your tools effectively, and stay ahead in the ever-evolving world of technology.
Author:

The OpenObserve Team comprises dedicated professionals committed to revolutionizing system observability through their innovative platform, OpenObserve. Dedicated to streamlining data observation and system monitoring, offering high performance and cost-effective solutions for diverse use cases.