Learn how to implement structured logging in production. Improve debugging, searchability, and observability with best practices and real-world examples.
Why AI-assisted analysis is changing how engineering teams investigate incidents, and why OpenObserve leads the category.
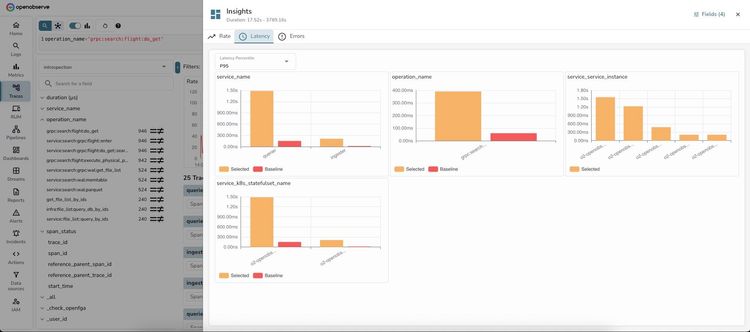
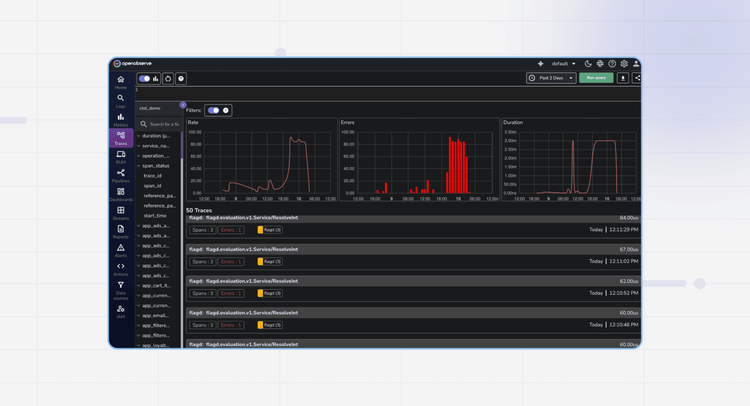
Learn how to use OpenObserve Insights for interactive log and trace analysis. Identify root causes in 60 seconds with dimension analysis. Real examples, step-by-step guides, and troubleshooting tips.
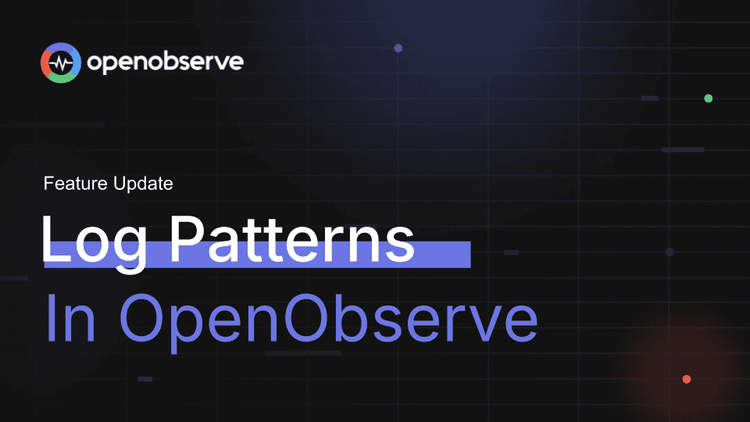
Automatically extract patterns from millions of logs in seconds. Learn how OpenObserve's log pattern analysis helps SREs reduce incident investigation time from 30 minutes to under 5 minutes.
A comprehensive comparison of the top 10 log monitoring tools in 2025 highlighting their strengths, trade-offs, and use-cases.
Real-world comparison of DataDog and OpenObserve for log management. SQL queries, automatic field discovery, and 90% cost savings. Tested with OpenTelemetry.
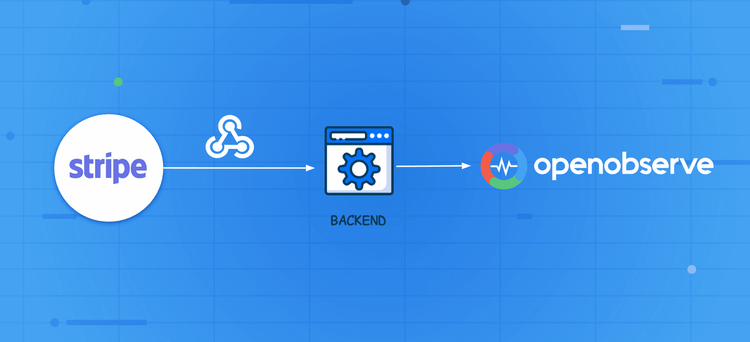
Enable end-to-end payment monitoring by sending Stripe events to OpenObserve and analyzing success/failure rates using dashboards, SQL queries, and alerts.
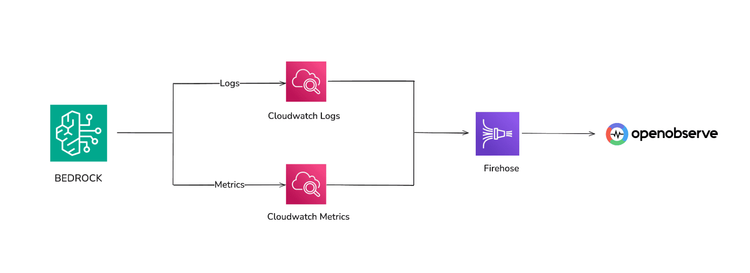
Learn how to monitor AWS Bedrock with CloudWatch, Kinesis Firehose, and OpenObserve. Track latency, errors, token usage, and model performance in real-time.
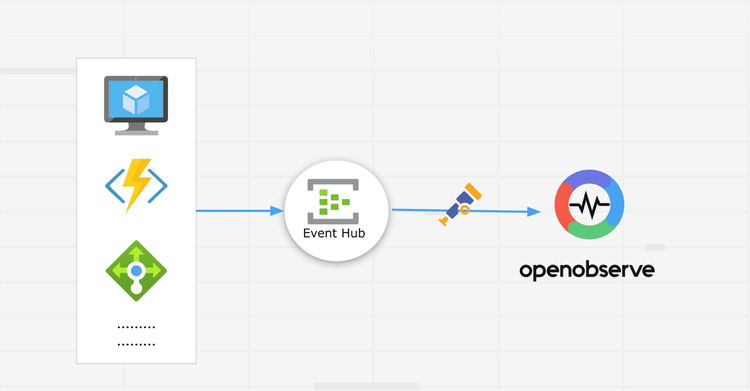
Monitor Azure VMs, databases, storage, and networking with a single pipeline using Event Hub → OTel Collector → OpenObserve. Simplify logging & metrics.
Discover how full-stack observability helps teams correlate telemetry across systems to cut MTTR, reduce data costs, and improve performance.
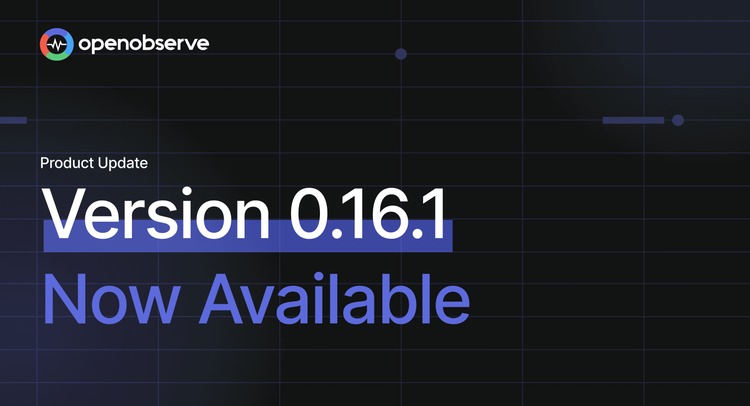
OpenObserve v0.16.1 delivers meaningful new features including Alert History for debugging monitoring reliability, Pipeline History for execution tracking, and automatic Log Pattern extraction that groups millions of logs into actionable insights. This release brings significant performance improvements with optimized indexing and query execution, alongside UI/UX refinements that enhance readability and usability across the platform. Teams can now better understand their system behavior, reduce alert fatigue through deduplication, and troubleshoot issues faster with comprehensive execution history and diagnostics.
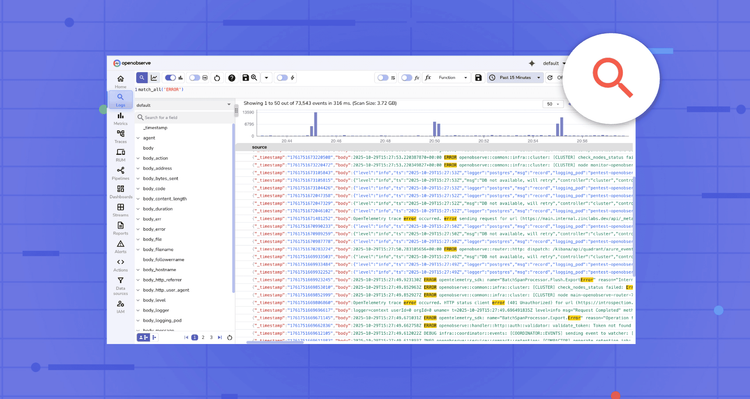
Search, filter, and analyze logs efficiently to uncover insights faster. Explore advanced log search techniques, query filters, and best practices for managing large-scale log data
Discover how to effectively handle multi-line log events, such as application stack traces, using OpenObserve Collector. This comprehensive guide covers configuring the filelog receiver, deploying changes with Helm, and verifying proper ingestion in OpenObserve. Improve log readability and troubleshooting with practical examples and solutions.
Deploy the OpenTelemetry Astronomy Shop demo and stream traces, metrics, and logs to OpenObserve with Helm. Easily configure OTLP and visualize everything in dashboards.
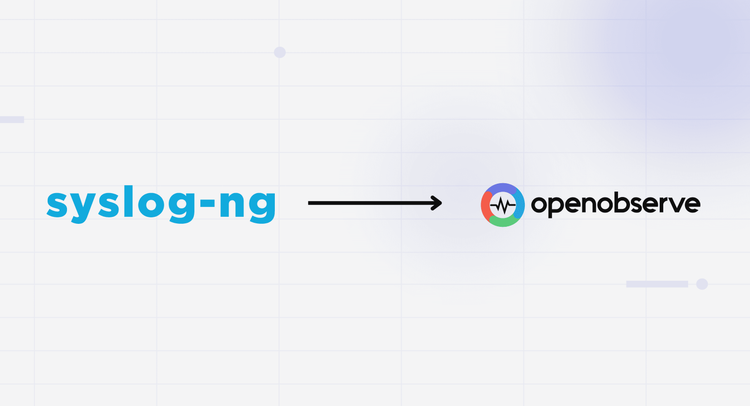
Learn how to forward syslog-ng logs to OpenObserve using the openobserve-log() HTTP destination, test your pipeline, and tune batching, workers, and ports for production.
Stream AWS Lambda logs to OpenObserve without CloudWatch. See setup, env vars, ARNs for x86/arm64, SQL queries, and troubleshooting for real-time observability.
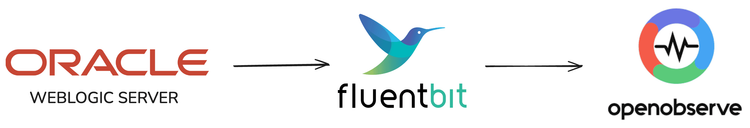
Send logs from Oracle WebLogic to OpenObserve for fast search, longer retention, and cost efficiency with minimal setup using Fluent Bit.
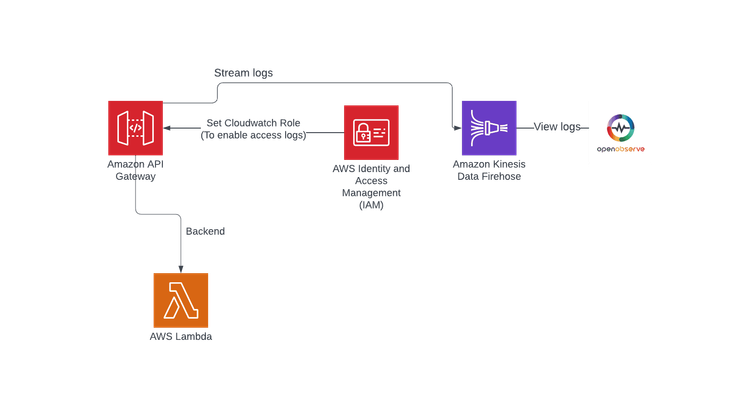
Discover the importance of log monitoring for API performance, step-by-step instructions on setting up a Lambda function, creating a REST API, and configuring Kinesis Firehose for seamless log streaming.
Send logs from Google Cloud Run to OpenObserve for fast search, longer retention, and lower costs, and using just a few lines of code.
Efficient log parsing with OpenObserve unlocks real-time analytics, troubleshooting, and alerting through VRL, flexible pipelines, and seamless ingestion.
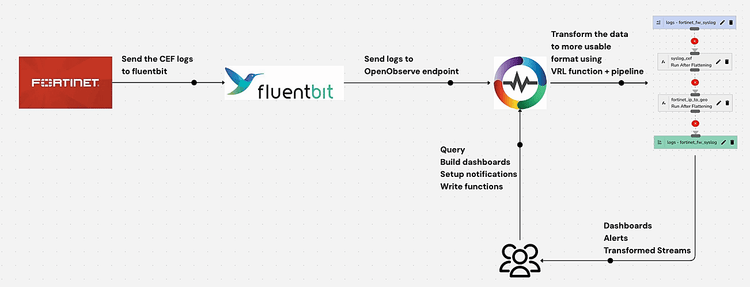
Learn how to monitor Fortinet firewalls using OpenObserve. Step-by-step guide for syslog setup, log transformation, and creating dashboards for real-time security monitoring.