Post by the tag: Logging
Learn how to monitor Fortinet firewalls using OpenObserve. Step-by-step guide for syslog setup, log transformation, and creating dashboards for real-time security monitoring.
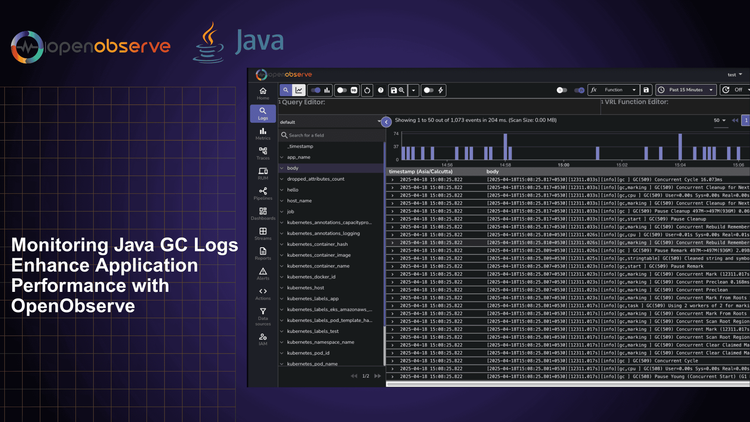
Learn how to leverage Java GC logs to diagnose memory issues, optimize application performance, and prevent production outages. This guide explains how to interpret GC log patterns and use OpenObserve for practical monitoring and analysis.
Learn how to capture and analyze Amazon EKS Fargate logs using AWS's built-in Fluent Bit log router, Kinesis Firehose, and OpenObserve for comprehensive container monitoring.
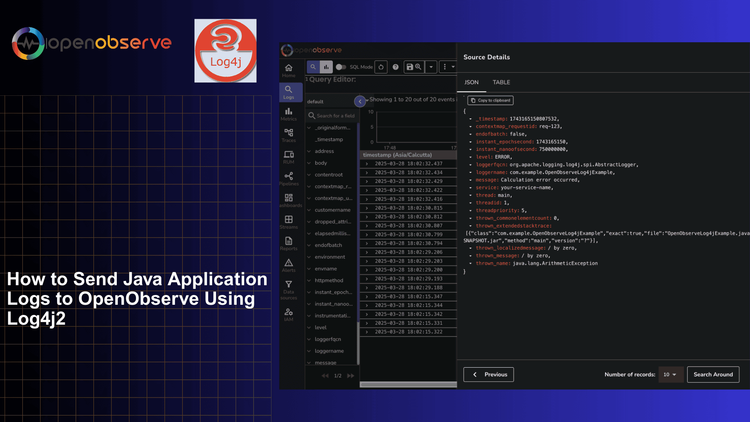
A comprehensive guide to configuring Log4j2 to send structured logs to OpenObserve for centralized logging and analysis of Java applications.
Learn how to boost PHP application observability by integrating Monolog with OpenObserve for powerful log management. This step-by-step guide shows developers how to implement real-time error tracking, performance monitoring, and troubleshooting capabilities using structured logging techniques that scale with your application. Perfect for PHP developers looking to enhance application reliability and gain actionable insights from their logs.
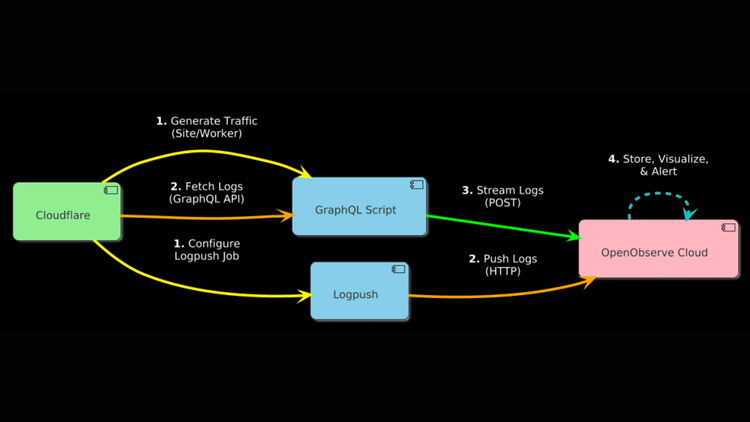
This guide demonstrates how to stream Cloudflare HTTP request logs to OpenObserve using GraphQL API polling or Logpush HTTP push.
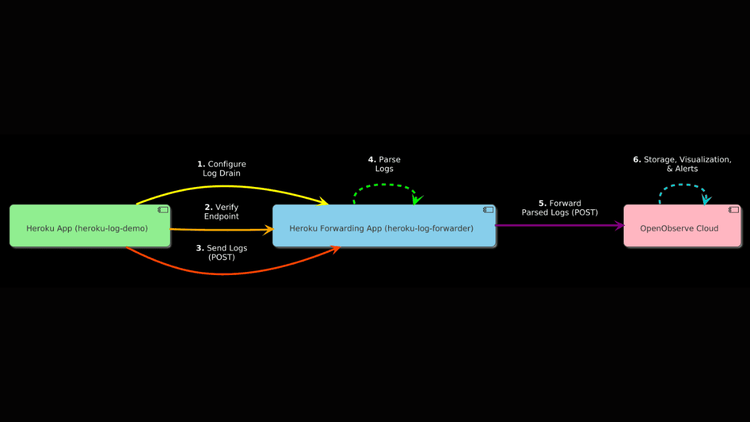
Learn how to set up Heroku Log Drains to seamlessly send logs to OpenObserve using a forwarding app.
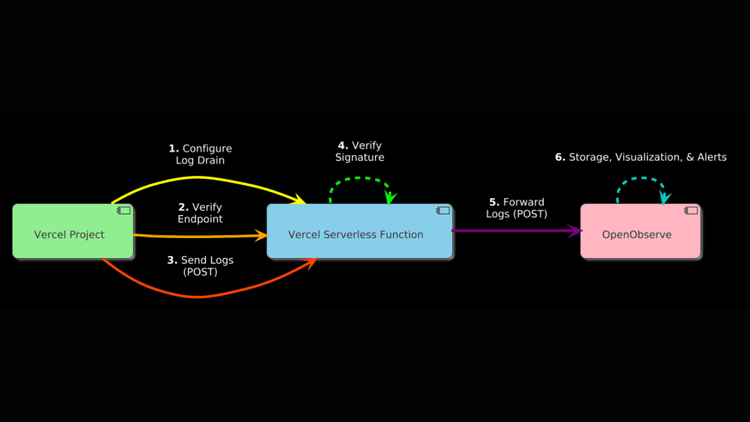
Learn how to set up Vercel Log Drains to seamlessly send logs to OpenObserve using a serverless function.
Learn how to implement distributed tracing in Go applications using OpenTelemetry. This comprehensive guide covers auto and manual instrumentation, correlating traces, metrics, and logs, and visualizing data in OpenObserve for complete observability.
Learn how to integrate Cribl, a powerful data engine, with OpenObserve for efficient log and trace ingestion. Step-by-step setup, webhook configuration, and monitoring included.
Learn how to monitor AWS ALB logs efficiently with OpenObserve. Step-by-step guide on setup, ingestion, parsing, and visualization for better security, performance, and compliance.
Learn how to set up AWS RDS log ingestion for detailed monitoring and observability. Compare centralized log analysis with OpenObserve vs. traditional methods for optimizing performance, enhancing security, and scaling database insights effectively.
There are times when you would like to filter logs at source. This blog post shows how to do that when capturing logs using otel-collector.
Discover how to effectively monitor Microsoft 365 logs, including AuditLogs, SignInLogs, Non-Interactive User SignInLogs, RiskyUsers, UserRiskEvents, ProvisioningLogs, NetworkAccessTrafficLogs, and RiskyServicePrincipals. This guide explores setting up robust log monitoring to enhance security, track critical events, ensure compliance, and gain actionable insights into your Microsoft 365 environment.
Learn how to set up real-time monitoring for CloudFront access logs using AWS Kinesis Streams and Firehose. This guide walks you through configuring CloudFront logging, creating Lambda transformations, and visualizing data in OpenObserve for performance optimization, security monitoring, and actionable insights.
Learn how to set up and monitor AWS WAF logs for enhanced security. This comprehensive guide covers AWS WAF configuration, waf logs, automated ingestion, dashboards, and best practices for visualization and insights.
Learn how to use osquery daemon and shell on Linux for logging and observability. Discover how osquery works, its configuration, and how to analyze logs for enhanced system monitoring and security.
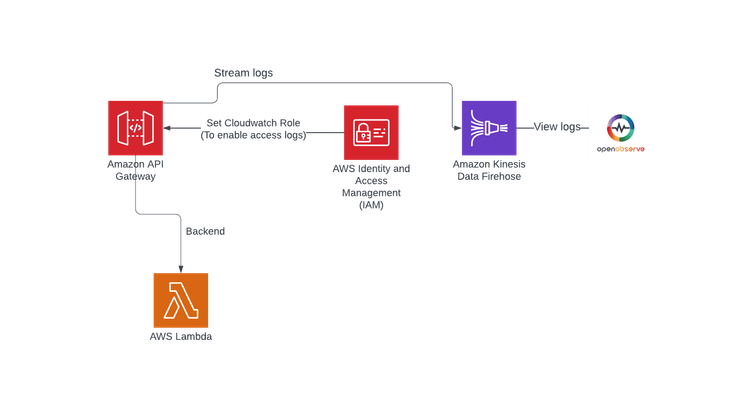
Discover the importance of log monitoring for API performance, step-by-step instructions on setting up a Lambda function, creating a REST API, and configuring Kinesis Firehose for seamless log streaming.
Learn how to send AWS CloudWatch Logs to Amazon Kinesis Firehose with this step-by-step guide. Discover real-time log streaming, analysis techniques, and integration best practices to optimize cloud monitoring and performance.
Learn how to send AWS CloudWatch logs to S3 using Kinesis Firehose in this beginner-friendly guide. Step-by-step instructions for seamless log streaming and storage
Learn how to monitor AWS Lambda logs using CloudWatch, Kinesis Firehose, and OpenObserve for performance tracking and error detection.