Learn what the Prometheus cardinality bomb is, why high-cardinality metrics break your monitoring, and how to detect, prevent, and fix it effectively.
Struggling with alert fatigue? Learn how to reduce noisy alerts, improve signal quality, and build effective alerting strategies that actually help teams respond faster.
Top 10 open source monitoring tools explained. Learn what they are, why they matter, and how to choose to get the most from your observability strategy.
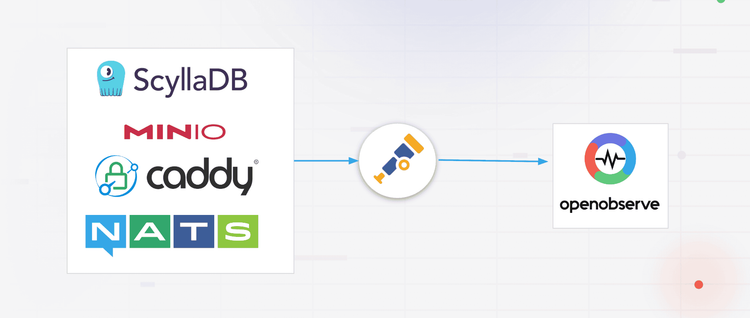
A walkthrough of dashboard JSON structure, query patterns, and integration architecture for Caddy, MinIO, NATS, and ScyllaDB.
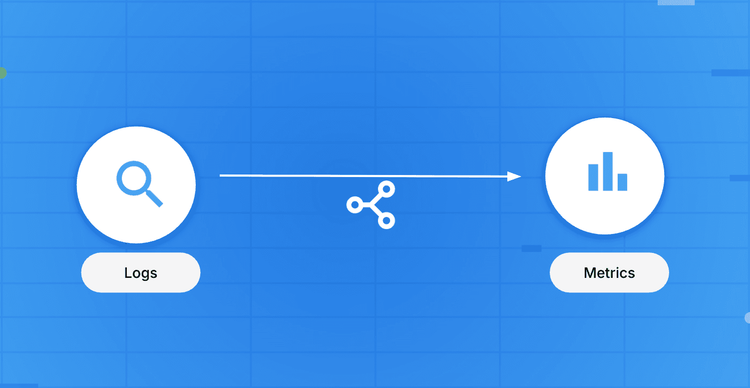
Learn how to convert raw logs into metrics using OpenObserve pipelines. Step-by-step guide to extract time-series metrics for faster dashboards and reliable alerts.
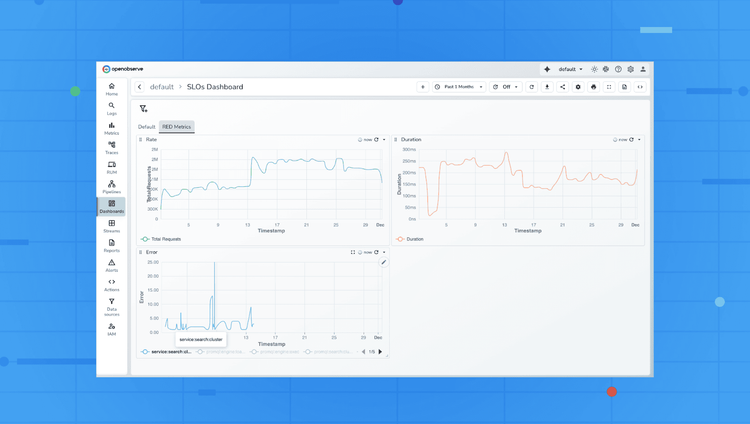
Learn how to use RED Metrics: Requests, Errors, Duration to monitor microservices effectively. Explore dashboards, SLOs, alerts, and OpenObserve examples for real-time observability.
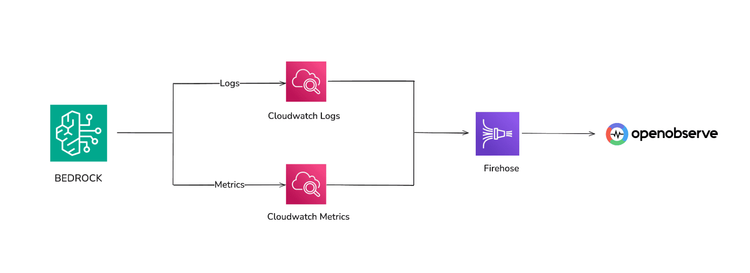
Learn how to monitor AWS Bedrock with CloudWatch, Kinesis Firehose, and OpenObserve. Track latency, errors, token usage, and model performance in real-time.
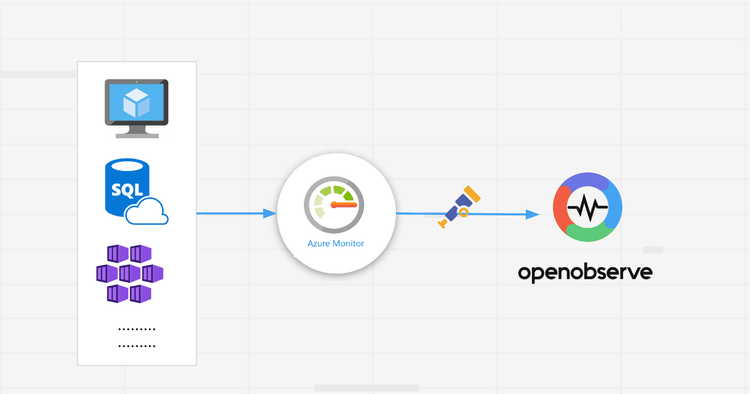
Collect and export Azure Monitor metrics to OpenObserve using the OpenTelemetry Collector. Build real-time dashboards, query metrics, and set up SQL-based alerts for Azure VMs, AKS, and other resources.
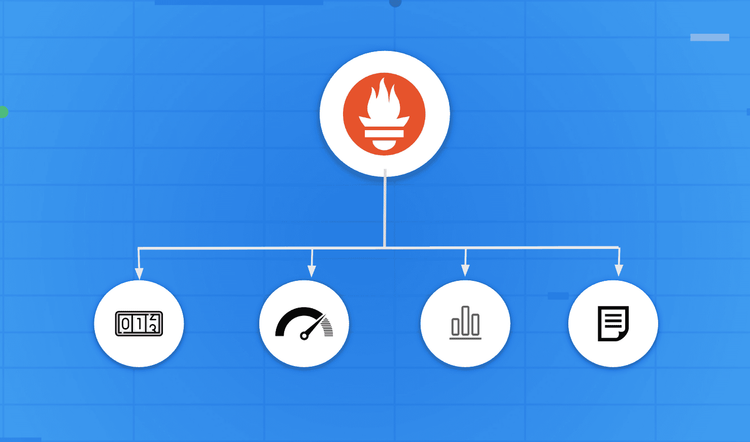
A clear, developer-focused guide to Prometheus metric types, when to use each one, and how OpenObserve enhances Prometheus by solving retention, scalability, and correlation limitations.
Discover how full-stack observability helps teams correlate telemetry across systems to cut MTTR, reduce data costs, and improve performance.
OpenObserve v0.16.1 delivers meaningful new features including Alert History for debugging monitoring reliability, Pipeline History for execution tracking, and automatic Log Pattern extraction that groups millions of logs into actionable insights. This release brings significant performance improvements with optimized indexing and query execution, alongside UI/UX refinements that enhance readability and usability across the platform. Teams can now better understand their system behavior, reduce alert fatigue through deduplication, and troubleshoot issues faster with comprehensive execution history and diagnostics.
Learn how to collect HTTP metrics with Telegraf and send them to OpenObserve: copy‑paste configs, verification steps, and production best practices.
Monitor Oracle Database performance with OpenTelemetry and OpenObserve. Collect metrics, logs, and build dashboards for real-time insights.
Learn how to monitor Docker container metrics using OpenTelemetry and OpenObserve. Collect CPU, memory, network, and disk metrics without modifying your applications.
Learn how to effectively monitor RabbitMQ performance metrics using OpenTelemetry Collector. Master message queue monitoring, track broker health, and optimize your messaging infrastructure with our comprehensive guide.
Learn how to monitor Apache Airflow logs, metrics, and traces using OpenTelemetry and OpenObserve. Set up Airflow logging, configure OpenTelemetry, and visualize insights with pre-built dashboards.
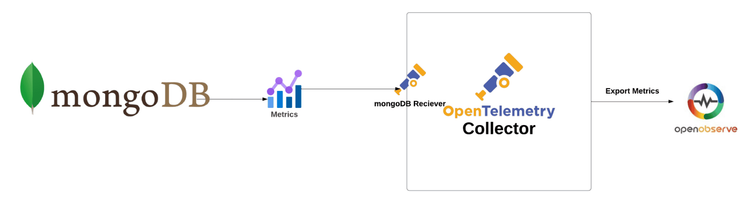
Discover how to effectively monitor MongoDB Metrics using the OpenTelemetry Collector. Enhance performance and reliability with our comprehensive guide.
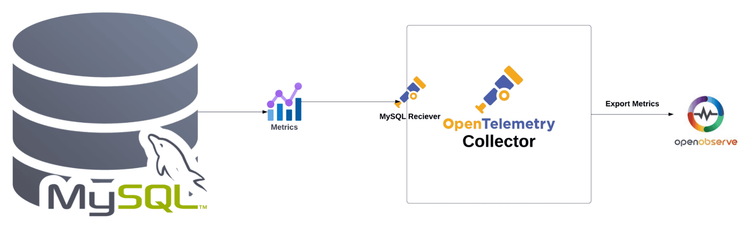
Discover how to effectively monitor MySQL Metrics using the OpenTelemetry Collector. Enhance performance and reliability with our comprehensive guide.
Learn how to effortlessly bring together and visualize all your AWS metrics in one place. Step-by-step guide to creating unified dashboards for AWS monitoring.
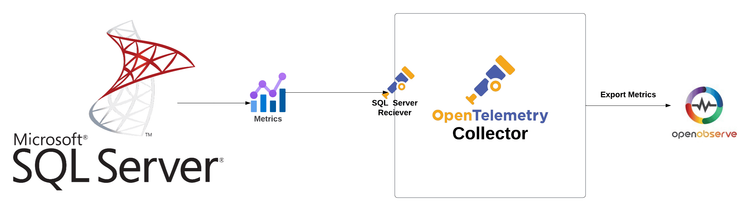
Boost SQL Server performance with OpenTelemetry! Discover top monitoring techniques for seamless database management and enhanced efficiency today
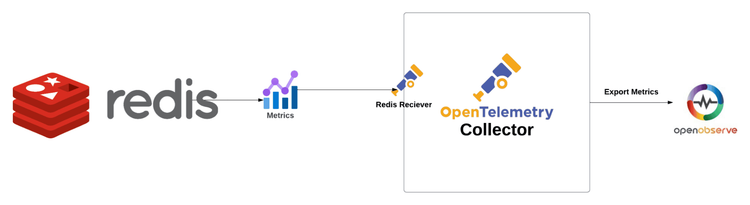
Discover how to effectively monitor Redis Metrics using the OpenTelemetry Collector. Enhance performance and reliability with our comprehensive guide.