Enhancing Kubernetes Metrics Collection With Opentelemetry and Prometheus


Try OpenObserve Cloud today for more efficient and performant observability.

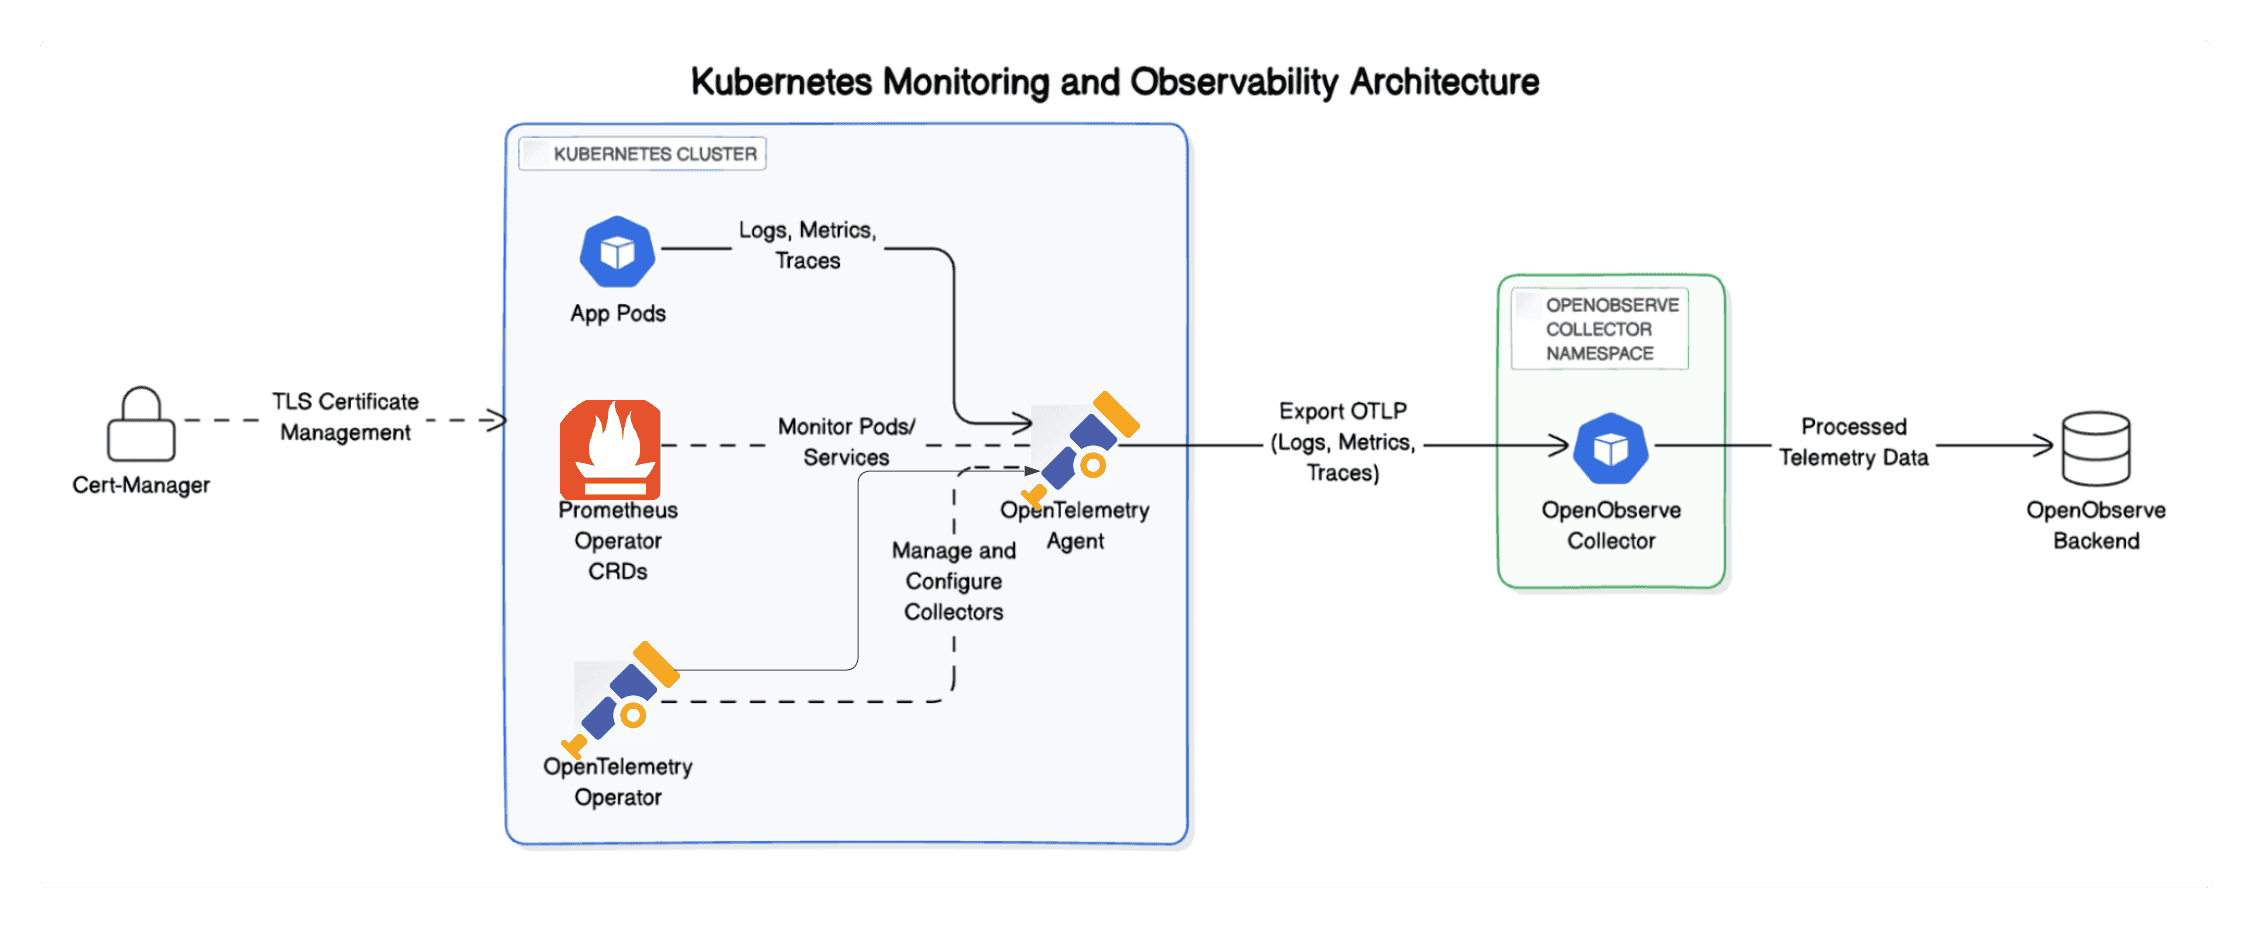
Kubernetes has revolutionized how we deploy and manage applications, but effective monitoring in these dynamic environments can be challenging. Kubernetes observability is crucial for scaling these applications, and tools like OpenTelemetry and Prometheus have become the preferred choices for developers looking to efficiently generate and collect telemetry data. However, as applications scale and become more complex, configuring Prometheus receivers to capture all dynamic scrape endpoints can become a significant hurdle.
While Prometheus jobs can be defined in the OpenTelemetry receiver using service discovery (SD) configurations, setups often depend on predefined regex patterns and filters. This limitation means that adding new endpoints requires manual configuration changes and a restart of the collector, which can be cumbersome and inefficient in dynamic environments.
TargetAllocator enhances Prometheus discovery using Kubernetes-based ServiceMonitor resources, then the Target Allocator detects available OpenTelemetry Collectors and distributes the targets among known collectors. As a result, the collectors routinely query the Target Allocator for their assigned metric targets to add to the scrape configuration.
kubectlCert-Manager is a tool to automate the management of TLS certificates within Kubernetes. We need it for securing communication between components:
kubectl apply -f https://github.com/cert-manager/cert-manager/releases/download/v1.13.1/cert-manager.yaml
A ServiceMonitor is a custom resource definition (CRD) provided by the Prometheus Operator. ServiceMonitor provides rich insights by collecting metrics directly from the service and each of its endpoints.This means each pod implementing the service will be discovered and scraped.
kubectl apply -f https://raw.githubusercontent.com/prometheus-operator/prometheus-operator/main/example/prometheus-operator-crd/monitoring.coreos.com_servicemonitors.yaml
See the ServiceMonitor specification for configuration details and best practices.
You can validate that the ServiceMonitor resource exists in your cluster using the following command:
kubectl get crd | grep monitoring
The OpenTelemetry Operator comes with an optional component, the Target Allocator (TA). In a nutshell, the TA is a mechanism for decoupling the service discovery and metric collection functions of Prometheus such that they can be scaled independently. The Collector manages Prometheus metrics without needing to install Prometheus.
One of the key benefits of using the Target Allocator is its ability to provide load balancing capabilities for Prometheus scrapers. In large Kubernetes clusters, a single OpenTelemetry Collector instance may struggle to scrape all metrics efficiently due to resource limitations. The Target Allocator addresses this challenge by distributing scrape targets evenly across multiple Collector instances. This ensures that no single collector is overwhelmed, leading to improved performance and reliability in metric collection.
To enable TargetAllocator to read ServiceMonitor resources, update the OpenTelemetry Operator's Helm chart values.yaml file like this:
opentelemetry-agent:
    targetAllocator:
        enabled: true ##set to true
        replicas: 1
        allocationStrategy: "per-node"
        prometheusCR:
            enabled: true
To avoid the effort of configuring the Target Allocator manually, you can directly use our OpenObserve Collector—it already has TA configured along with many other added configurations for easy flow of telemetry data from your cluster. For detailed instructions on setting up the OpenObserve Collector in your cluster , refer to this guide.
To install the OpenTelemetry Operator using Helm, follow these commands:
 helm repo add open-telemetry https://open-telemetry.github.io/opentelemetry-helm-charts
 helm repo update
helm install my-opentelemetry-operator open-telemetry/opentelemetry-operator \
--set "manager.collectorImage.repository=otel/opentelemetry-collector-k8s" \
--set admissionWebhooks.certManager.enabled=false \
--set admissionWebhooks.autoGenerateCert.enabled=true
For further details on configuration options, refer to OpenTelemetry Operator Helm Chart Documentation
Once the opentelemetry-operator deployment is ready, create an OpenTelemetry Collector (otelcol) instance, like:
$ kubectl apply -f - <<EOF
apiVersion: opentelemetry.io/v1alpha1
kind: OpenTelemetryCollector
metadata:
  name: otel-collector
  namespace: opentelemetry
spec:
  mode: statefulset
  targetAllocator:
    enabled: true
    serviceAccount: opentelemetry-targetallocator-sa
  prometheusCR:
    enabled: true
  config: |
    receivers:
      prometheus:
        config:
          scrape_configs:
            - job_name: 'otel-collector'
              scrape_interval: 30s
              http_sd_configs:
                - url: http://otelcol-targetallocator:80/jobs/otel-collector/targets?collector_id=${POD_NAME}
    exporters:
      openobserve:
        endpoint: "http://openobserve:5080/api/default/"  # Replace with your actual OpenObserve endpoint
        headers:
          Authorization: ""  #  Add your actual auth header:
      pipelines:
        metrics:
          receivers: [prometheus]
          processors: []
          exporters: [openobserve]
EOF
This setup ensures that your collector instances can dynamically adjust as new services are added or removed. The OpenTelemetry Collector can be deployed in various modes (Deployment, DaemonSet, StatefulSet, Sidecar). In this example we have used StatefulSet for better management of stateful applications.
The openobserve exporter sends processed metrics to the OpenObserve instance.
With the TargetAllocator configured, the OpenTelemetry Collector can dynamically discover and scrape metrics from services defined by the ServiceMonitor. This ensures that as services are added or removed, metrics collection remains seamless and efficient.
To verify that your setup is functioning correctly, you can check the logs of both the TargetAllocator and the OpenTelemetry Collector. Additionally, you can port-forward to access their endpoints and inspect registered jobs
kubectl logs -l app=target-allocator -n opentelemetry
kubectl logs -l app=otel-collector -n opentelemetry
-Port forward to the target allocator pod with the following kubectl command:
kubectl port-forward svc/otelcol-targetallocator -n opentelemetry 8080:80
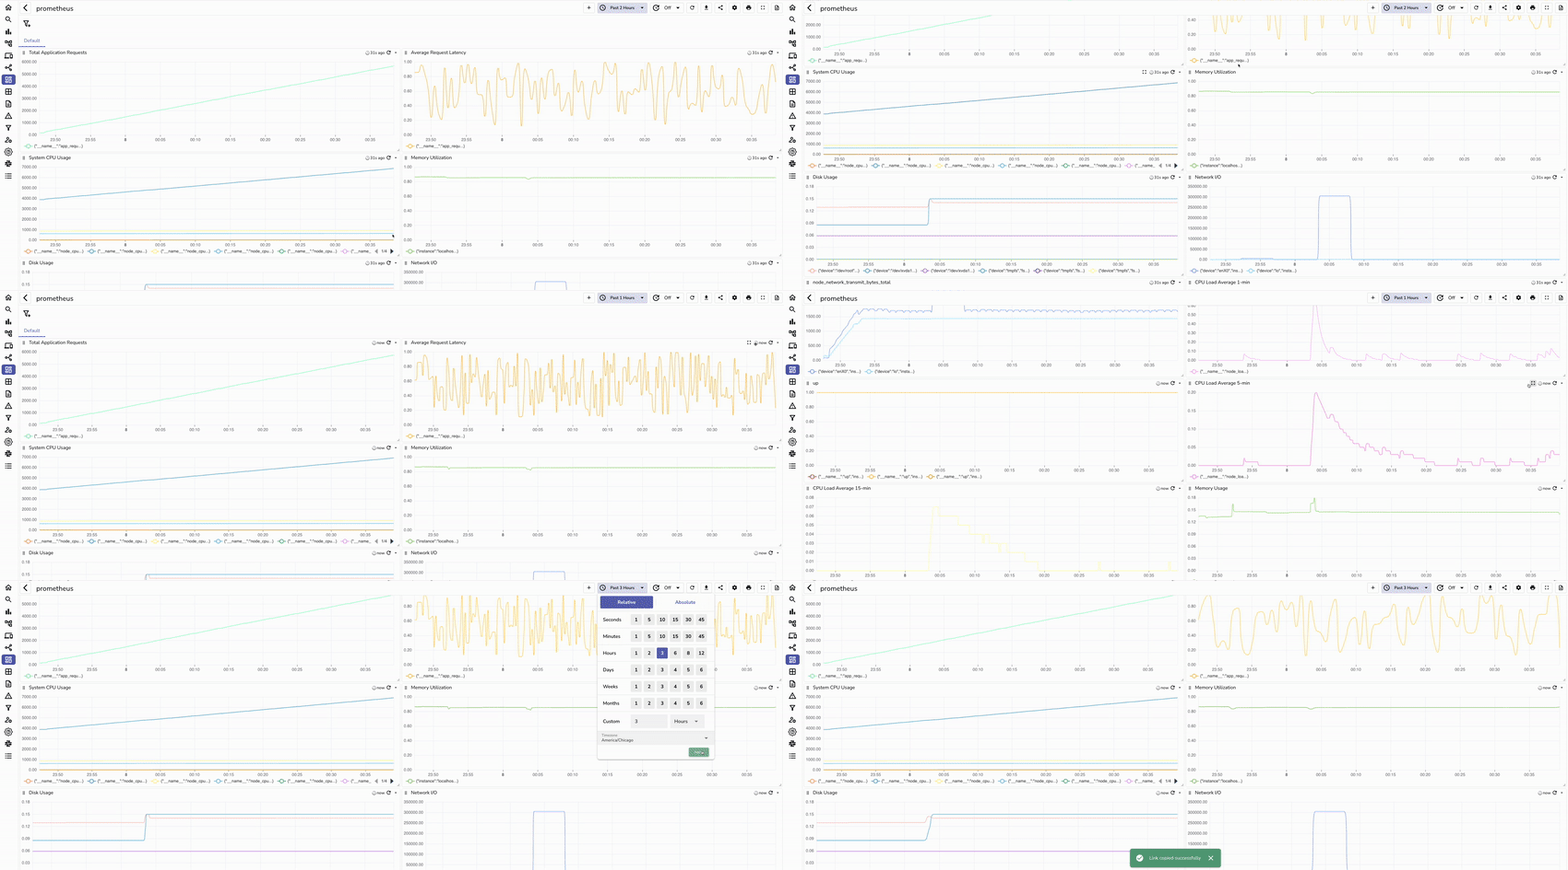
With metrics ingested into OpenObserve, you can now use its visualization tools to create insightful dashboards and analyze data. Here are a few examples of commonly used panels to visualize k8's metrics.

Integrating OpenTelemetry with Prometheus and utilizing OpenObserve as a backend provides a robust solution for dynamically collecting and visualizing metrics in Kubernetes environments. By leveraging TargetAllocator for service discovery and metric collection, developers can make their Prometheus monitoring both effective and future-ready.
Discover pre-built dashboards in OpenObserve's Dashboards repository for intuitive metrics visualization.
Happy Monitoring! 🚀