Microservices Observability: Leveraging Logs, Metrics, and Traces for Enhanced System Performance

Nitya Timalsina
October 29, 2024
13 min read
Don’t forget to share!
Try OpenObserve Cloud today for more efficient and performant observability.
This comprehensive guide explores the implementation of effective microservices observability using logs, metrics, and traces. Learn practical solutions for common challenges, real-world implementation patterns, and future trends in observability. Ideal for DevOps engineers and SREs working with distributed systems.
Picture this: It's Black Friday, and you're the lead developer at an e-commerce powerhouse. Suddenly, orders start failing, and customer complaints flood in faster than bargain hunters at a flash sale. Your team scrambles to identify the issue, but with dozens of microservices working together, pinpointing the problem feels like finding a needle in a haystack of needles.
This scenario is all too familiar for teams managing complex microservices architectures. The solution? Microservices observability. In this comprehensive guide, we'll explore how observability can transform your ability to understand, troubleshoot, and optimize your microservices-based applications.
Microservices observability refers to the ability to understand the internal state of a distributed system by examining its outputs. It goes beyond traditional monitoring by providing a holistic view of your system's health and performance in real-time.
Observability in microservices architecture involves three fundamental pillars:
Each pillar plays a crucial role in providing a comprehensive understanding of your microservices ecosystem.
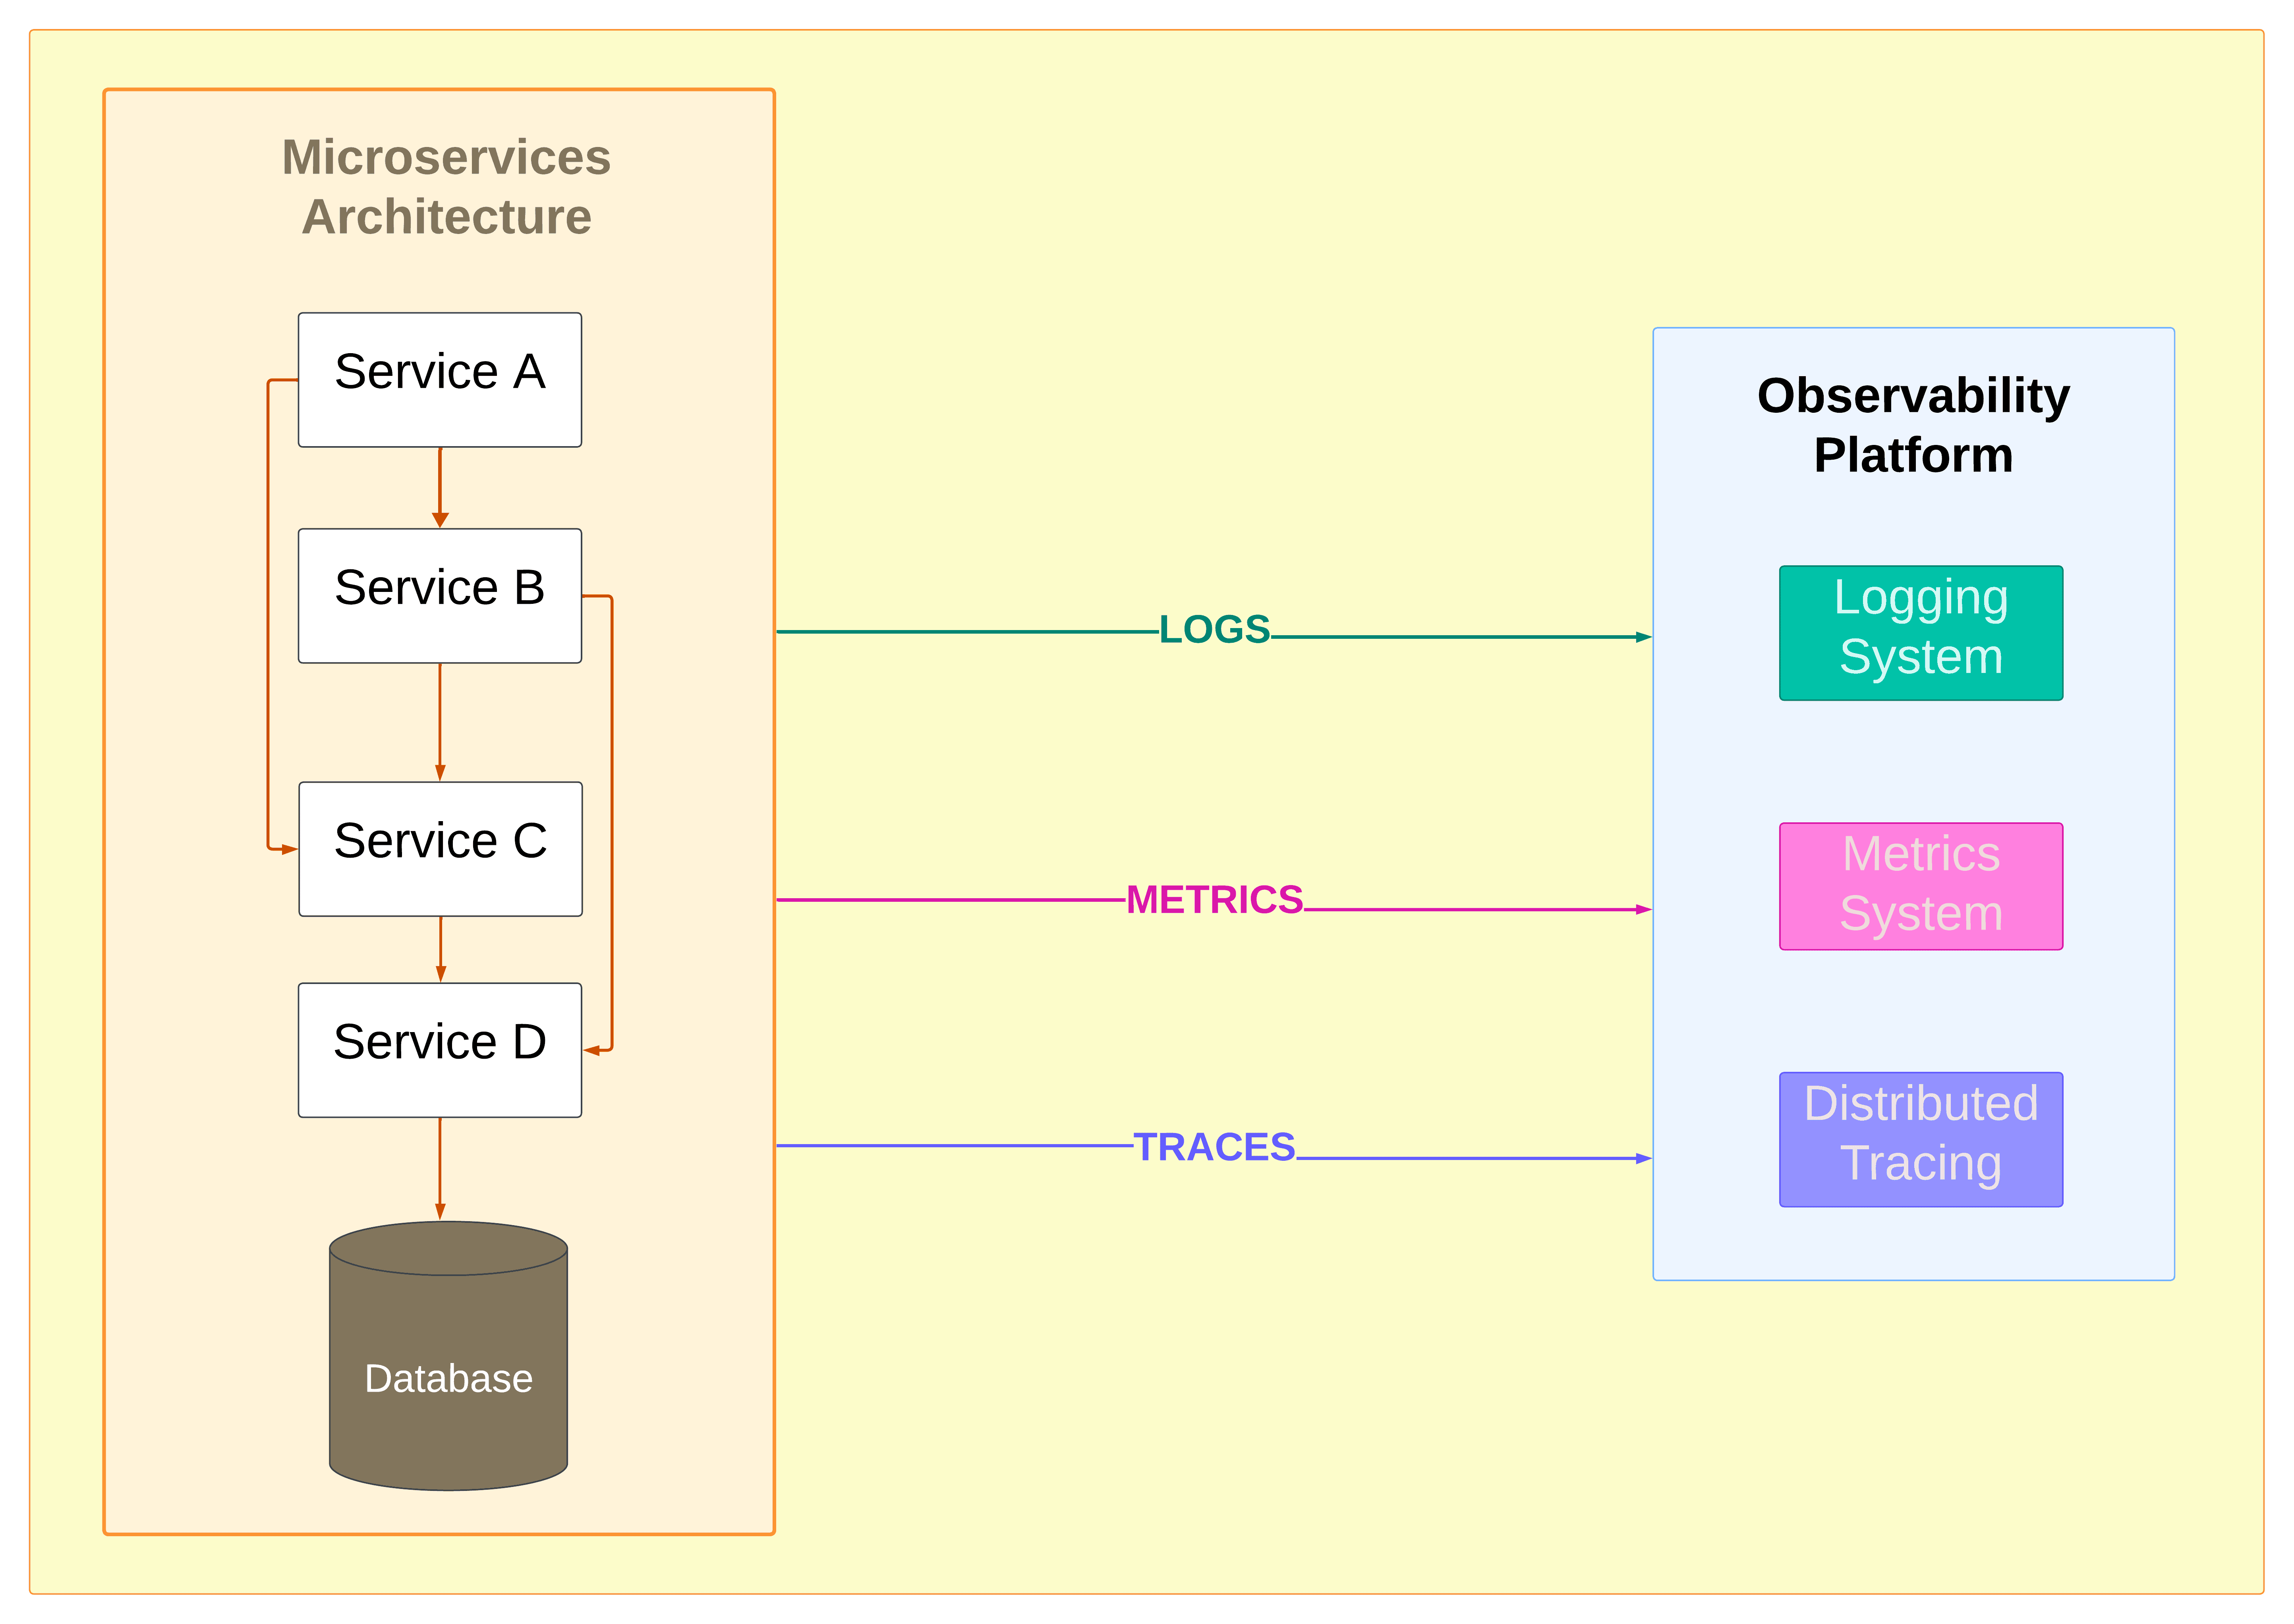
This component diagram illustrates a typical microservices architecture with multiple services interacting with each other and a database. The observability platform collects logs, metrics, and traces from all services, providing a comprehensive view of the system's behavior.
Implementing robust observability practices in your microservices architecture offers numerous advantages:
Let's consider a hypothetical e-commerce platform that experiences a sudden spike in order failures during a flash sale. With proper observability in place:
| Log Entry |
|---|
| 2024-10-22 14:30:05 ERROR [payment-service] Payment gateway timeout for order 12345 |
| 2024-10-22 14:30:07 ERROR [payment-service] Payment gateway timeout for order 12346 |
| Metric |
|---|
| payment_service_latency_milliseconds{quantile="0.99"} 5000 |
| Span Details |
|---|
| Span: process_payment |
| ├─ Span: validate_order (10ms) |
| ├─ Span: check_inventory (15ms) |
| └─ Span: charge_customer |
| └─ Span: database_query (4500ms) // Bottleneck identified here |
By correlating these insights, the team would be able to quickly identify that the payment service's database connection pool is undersized for the increased load. They would then be able to implement a fix by scaling the connection pool dynamically based on traffic patterns.
To resolve this issue, the team might:
📌 Pro Tip: Always correlate data from all three observability pillars to get a complete picture of system behavior and identify root causes more effectively.
Effective logging is the foundation of microservices observability. Here are some best practices to implement:
Adopt structured logging to make your logs easily parsable and queryable. Use a consistent format, such as JSON, to include key information like timestamps, service names, and error codes.
Example of a structured log entry:
| Log Entry |
|---|
| { "timestamp": "2024-10-22T14:30:00Z", "service": "order-processing", "level": "ERROR", "message": "Failed to process order", "order_id": "12345", "error_code": "ERR_PAYMENT_DECLINED", "customer_id": "CUS789", "payment_provider": "stripe", "trace_id": "80f198ee56343ba864fe8b2a57d3eff7", "span_id": "e457b5a2e4d86bd1" } |
⚠️ Common Pitfall: Avoid using vague log messages like ERROR: Order processing failed for order 12345, as they are difficult to understand at scale.
Implement appropriate log levels to categorize the severity and importance of log entries:
📌 Pro Tip: Configure different log levels for different environments - use TRACE/DEBUG in development for detailed troubleshooting, but limit to INFO and above in production to manage log volume.
Implement a centralized logging system to aggregate logs from all your microservices. This approach simplifies log analysis and correlation across services.
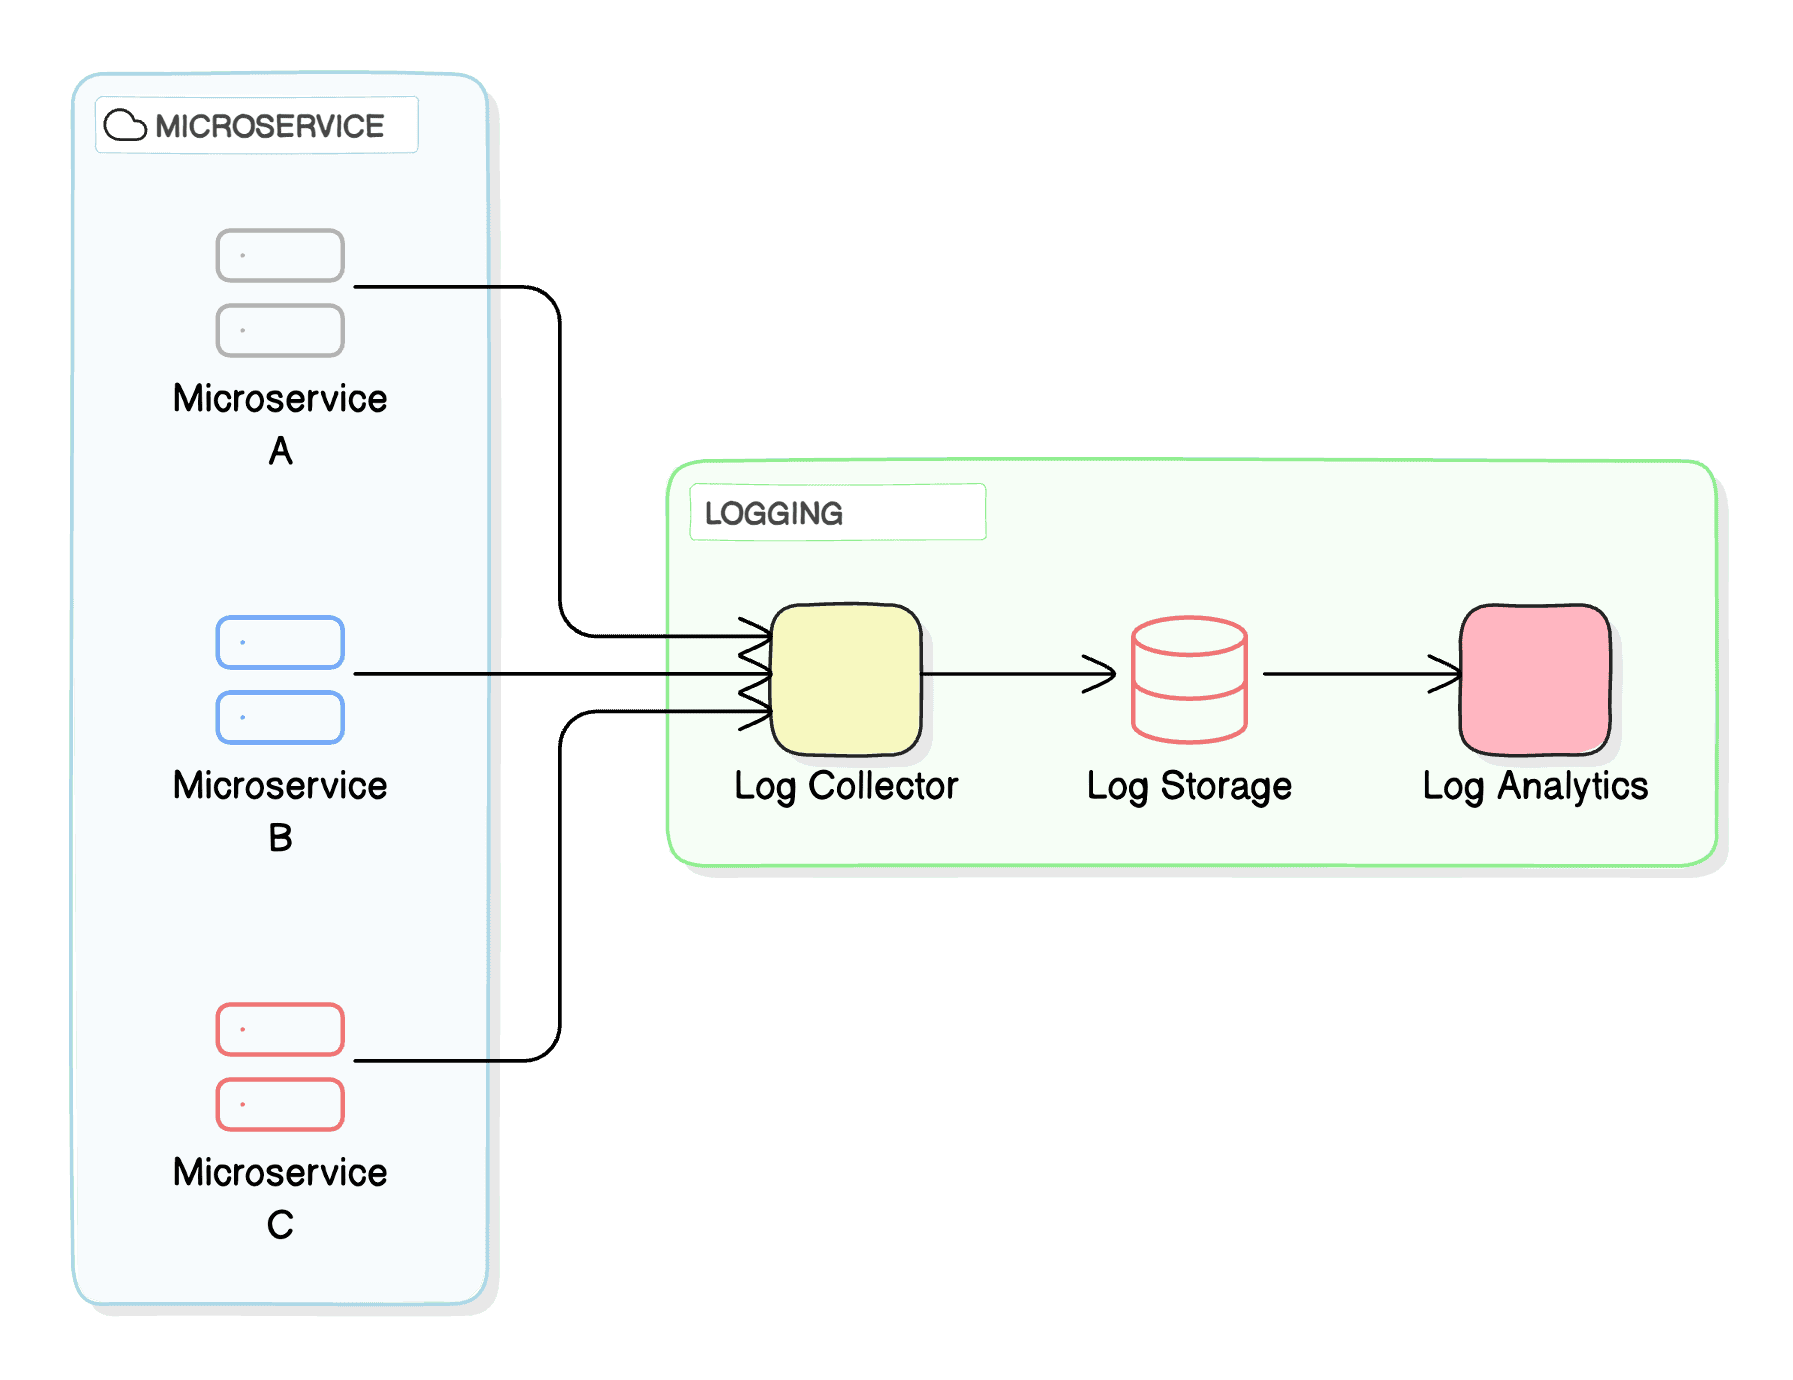
This component diagram shows how a centralized logging system collects logs from multiple microservices, stores them in a central location, and provides analytics capabilities.
In microservices architectures, correlation IDs are essential for connecting logs across services. When a customer places an order in our e-commerce example, their request flows through multiple services–each generating its own logs. Without correlation, tracing an order's journey becomes virtually impossible.
| Log Entries |
|---|
| { "timestamp": "2024-10-22T14:30:00Z", "service": "order-service", "level": "INFO", "correlation_id": "ord-123e4567", "message": "New order received", "order_id": "ORD-789", "cart_total": 299.99 } { "timestamp": "2024-10-22T14:30:01Z", "service": "inventory-service", "level": "INFO", "correlation_id": "ord-123e4567", "message": "Stock verification started", "order_id": "ORD-789", "items": ["SKU-123", "SKU-456"] } { "timestamp": "2024-10-22T14:30:02Z", "service": "payment-service", "level": "ERROR", "correlation_id": "ord-123e4567", "message": "Payment processing failed", "order_id": "ORD-789", "error_code": "INSUFFICIENT_FUNDS" } |
In this example:
By using a consistent correlation_id across services, you can trace the entire flow of an order from initiation to completion, or failure, across multiple services.
📌 Pro Tip: Generate correlation IDs at your system’s entry point (such as the API Gateway) and ensure they are passed through all subsequent service calls. This allows you to trace both successful transactions and failures across your system.
Metrics provide quantitative insights into your system's performance. Follow these best practices for effective metrics collection:
Identify and track KPIs that align with your business and technical goals. Some essential metrics for microservices include:
Adopt a consistent naming convention for your metrics to ensure clarity and ease of use. For example, you might use <service_name>_<metric_type>_<unit>
for an e-commerce application, to track key metrics like the following:
order_processing_requests_per_secondpayment_service_latency_millisecondsinventory_service_error_rate_percentUse specialized time-series databases to store and query your metrics efficiently. These databases are optimized for handling time-stamped data and provide fast querying capabilities for large volumes of metrics.
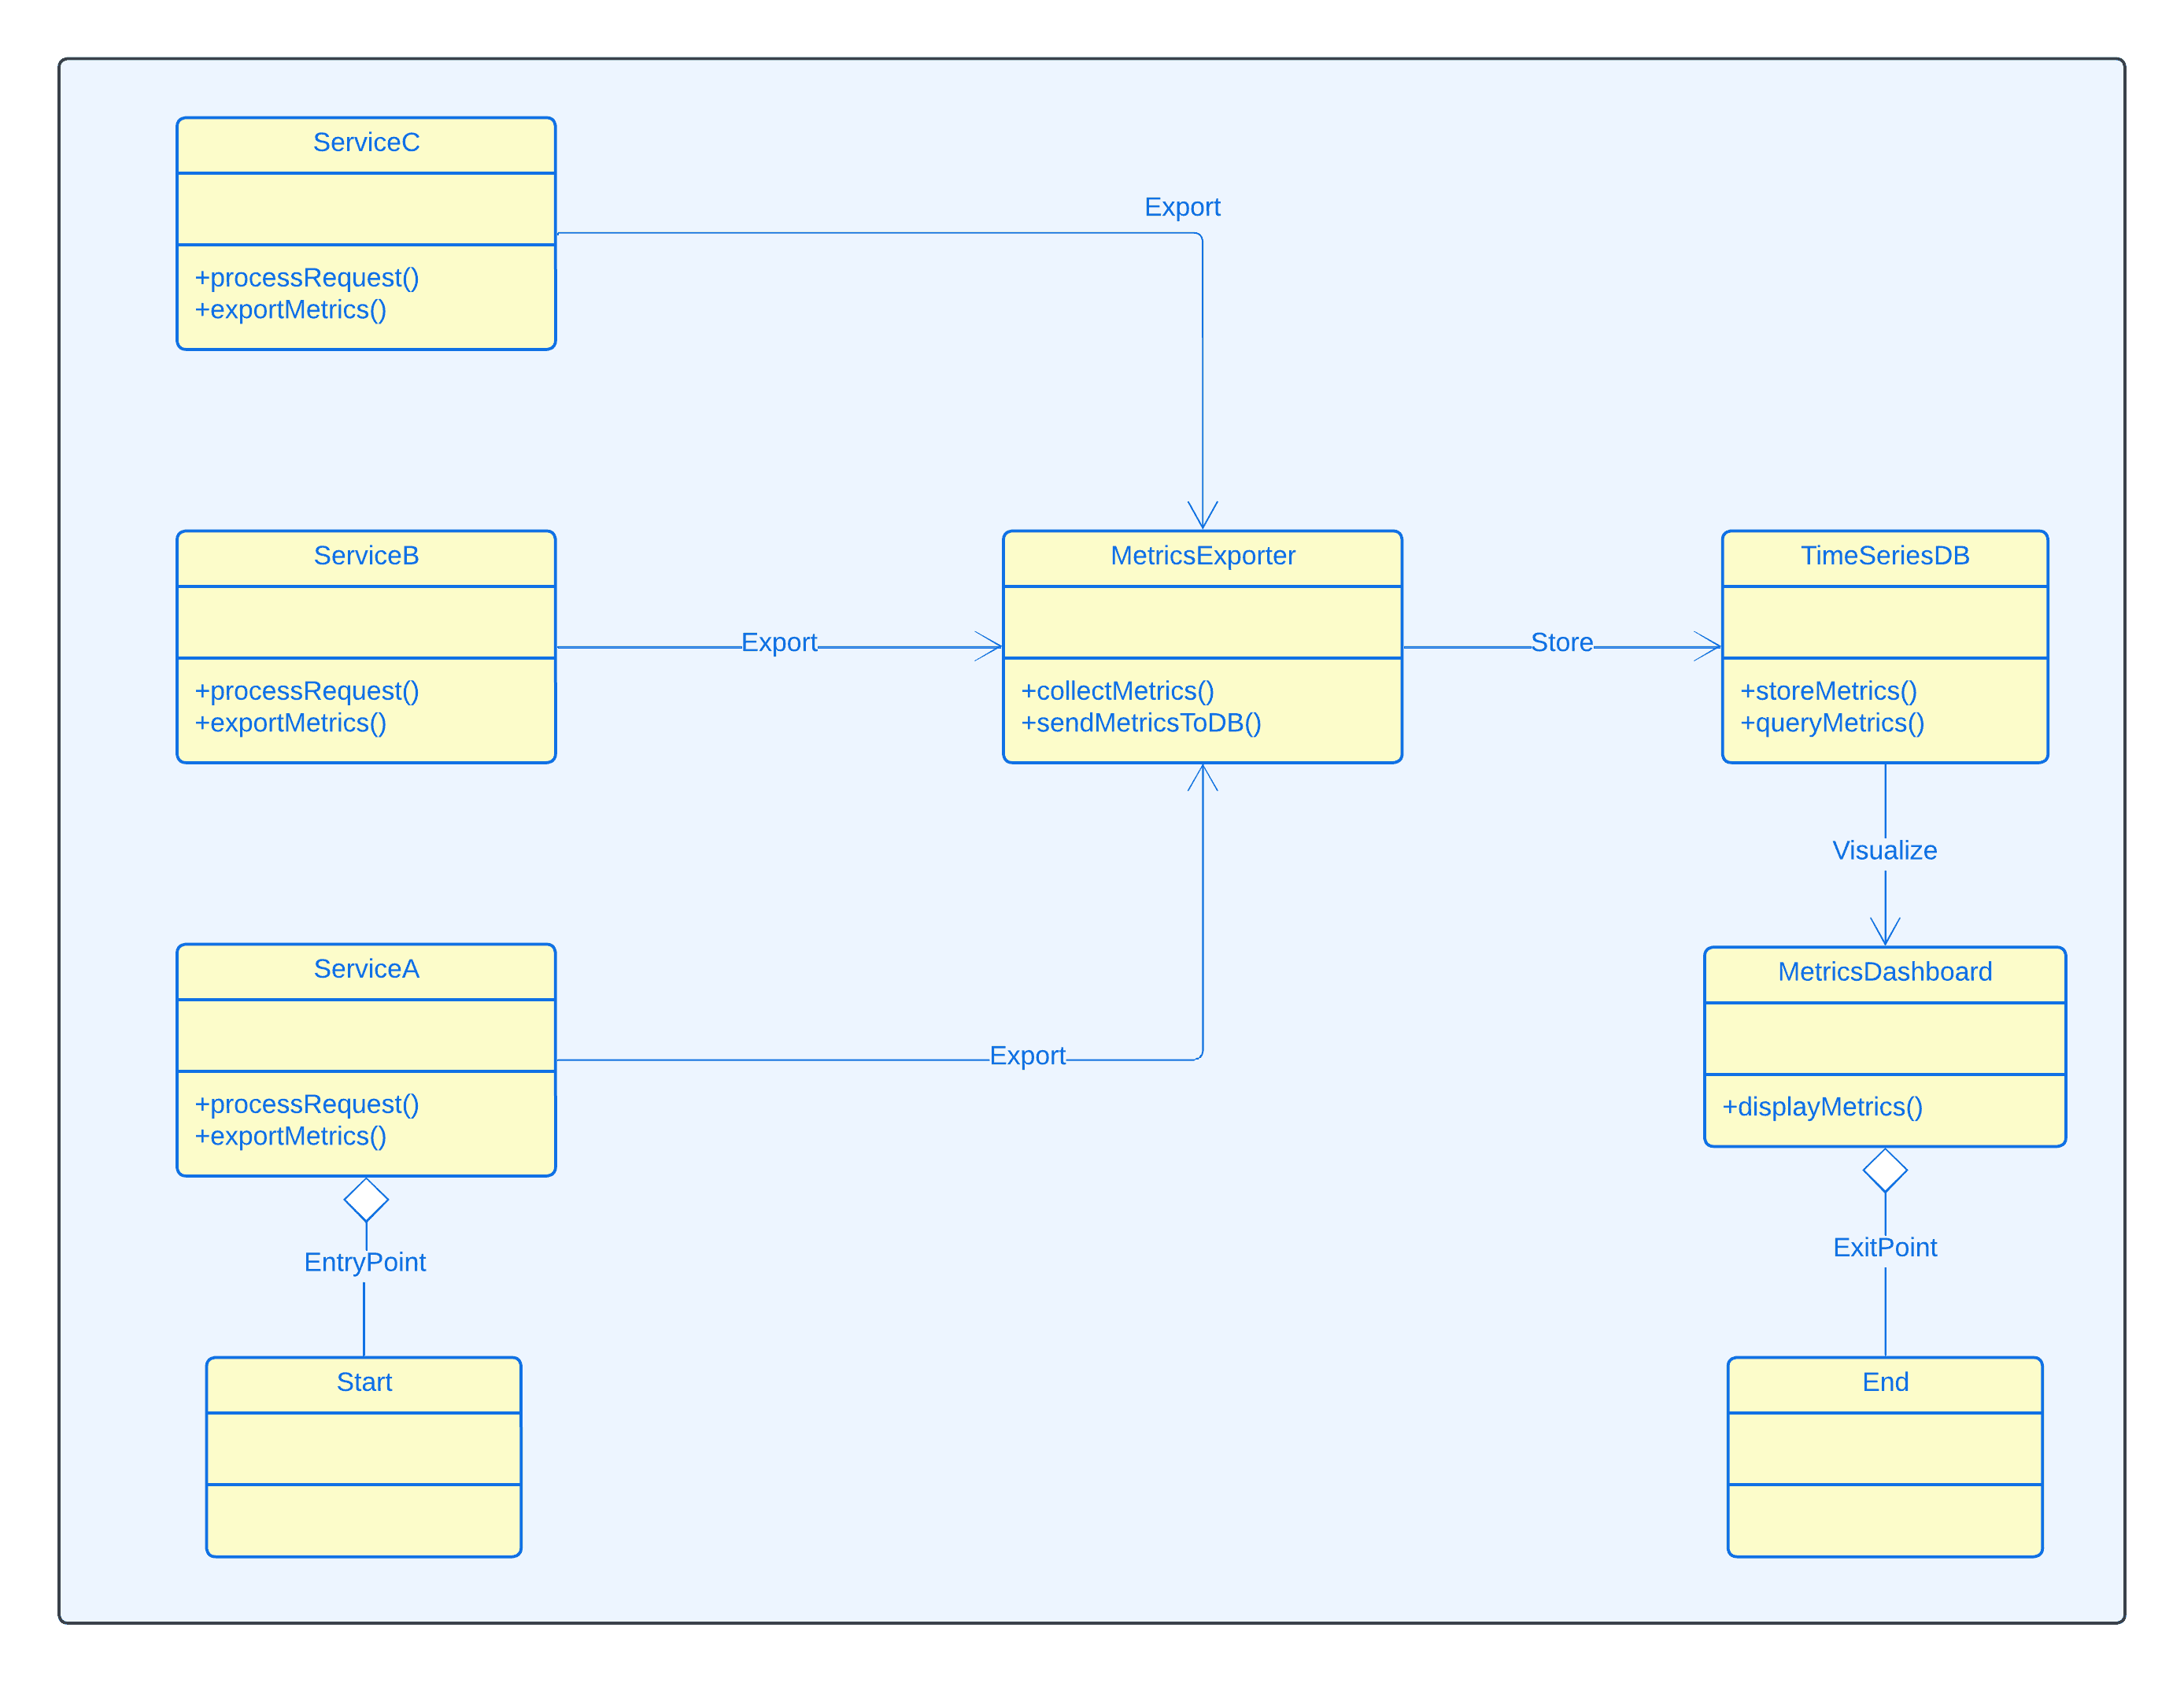
This component diagram illustrates how metrics are collected from microservices, stored in a time-series database, and visualized through a metrics dashboard.
Use aggregation techniques to summarize metrics across multiple instances of a service. Visualize your metrics using dashboards that provide at-a-glance insights into system performance.
Example of a metrics query using PromQL (Prometheus Query Language):
rate(http_requests_total{job="order_service"}[5m])
This query calculates the rate of HTTP requests for the order service over the last 5 minutes.
📌 Pro Tip: Set up alerting thresholds based on your metrics to proactively identify and address issues before they impact users.
In microservices architectures, a single user request (like placing an order) often triggers a cascade of service-to-service communications. Distributed tracing captures this flow by creating and connecting spans across services.
OpenTelemetry provides both automatic and manual instrumentation approaches for distributed tracing. Let's explore both using an e-commerce example:
For basic e-commerce flows, OpenTelemetry's automatic instrumentation captures essential operations with minimal setup:
# Install required packages
pip install opentelemetry-distro[otlp]
pip install opentelemetry-instrumentation-flask

# Enable automatic instrumentation
opentelemetry-instrument \
    --service_name=order-service \
    --traces_exporter=otlp \
    flask run
This automatically captures:
For critical business operations like order processing, consider adding custom instrumentation:
from opentelemetry import trace
from opentelemetry.sdk.trace import TracerProvider
from opentelemetry.instrumentation.flask import FlaskInstrumentor
from flask import Flask

# Initialize tracing
trace.set_tracer_provider(TracerProvider())
tracer = trace.get_tracer(__name__)

app = Flask(__name__)
FlaskInstrumentor().instrument_app(app)

@app.route('/process-order')
def process_order():
    with tracer.start_as_current_span("process_order") as span:
        # Add order context
        span.set_attribute("order_id", "ORD-123")
        span.set_attribute("customer_id", "CUS-456")
        span.set_attribute("total_amount", 299.99)

        try:
            # Process order steps
            with tracer.start_span("check_inventory"):
                check_product_availability()

            with tracer.start_span("process_payment"):
                process_payment_transaction()

            span.set_attribute("order_status", "completed")
            return "Order processed successfully"
        except Exception as e:
            span.set_status(Status(StatusCode.ERROR))
            span.record_exception(e)
            raise
OpenTelemetry automatically propagates trace context through HTTP headers:
traceparent: 00-80f198ee56343ba864fe8b2a57d3eff7-e457b5a2e4d86bd1-01
📌 Pro Tip: Use automatic instrumentation as your foundation, then incorporate custom instrumentation for nuanced, business-critical operations like payment processing and inventory management where you need detailed performance insights.
Ensure that trace context is properly propagated across service boundaries. This allows you to maintain a complete picture of a request's journey through your system.
Example of trace context propagation in HTTP headers:
| Header Values |
|---|
| X-B3-TraceId: 80f198ee56343ba864fe8b2a57d3eff7 X-B3-ParentSpanId: 05e3ac9a4f6e3b90 X-B3-SpanId: e457b5a2e4d86bd1 X-B3-Sampled: 1 |
📌 Pro Tip: Use sampling strategies to reduce the volume of trace data collected while still maintaining visibility into system behavior.
When implementing microservices observability, organizations typically face several key challenges. Here's how to address them effectively:
| Challenge | Solution |
|---|---|
| Data Volume Management | Implement adaptive sampling based on traffic patterns and error rates Use columnar storage formats for efficient data compression Enable bloom filters for high-cardinality fields Apply intelligent partitioning strategies for faster data retrieval Set up data retention policies aligned with business needs |
| Data Consistency | Develop standardized logging formats and conventions Create organization-wide observability standards Implement automated validation of telemetry data Use structured logging with consistent field names Establish clear guidelines for metric naming and labeling |
| Context Propagation | Implement distributed tracing using OpenTelemetry Use correlation IDs consistently across services Automate context propagation in service-to-service communication Standardize header formats for trace context Monitor trace completion rates and fix gaps in context propagation |
| Tool Sprawl | Adopt a unified observability platform Standardize on open protocols and formats Integrate observability tools with existing workflows Implement centralized configuration management Establish clear criteria for tool selection and retirement |
As microservices architectures continue to evolve, observability practices will need to adapt. The journey we've taken through the pillars of observability—logging, metrics, and distributed tracing—provides a solid foundation for managing complex distributed systems. However, the landscape is constantly changing, and new trends are emerging to address the growing complexity of modern applications.
Some future trends in microservices observability include:
By staying ahead of these trends and implementing robust observability practices, you can ensure that your microservices architecture remains scalable, resilient, and performant in the face of ever-increasing complexity.
As we've explored throughout this article, effective microservices observability requires a comprehensive approach that integrates logs, metrics, and traces. By following best practices such as starting small and scaling gradually, promoting collaboration and automation, and creating accessible data visualizations, you can build a robust observability strategy that enhances your system's performance and reliability.
OpenObserve is uniquely positioned to help you implement these best practices and achieve complete observability:
Unlock the full potential of microservices observability with OpenObserve. Sign up today and discover how our cutting-edge platform can help you implement observability best practices, optimize your application's performance, and gain real-time insights into your distributed systems. With OpenObserve, you'll have a comprehensive solution that brings together logs, metrics, and traces in a unified, scalable platform designed for modern, cloud-native applications.
By leveraging OpenObserve's powerful features, you'll be well-equipped to navigate the complexities of microservices architectures, make data-driven decisions, and deliver exceptional experiences to your users. Reach out if you have any questions along the way, or join our Slack community!
Nitya is a Developer Advocate at OpenObserve, with a diverse background in software development, technical consulting, and organizational leadership. Nitya is passionate about open-source technology, accessibility, and sustainable innovation.