Comprehensive Guide to Monitoring AWS RDS via CloudWatch Metrics and OpenTelemetry

Chaitanya Sistla
December 19, 2024
4 min read
Don’t forget to share!
Try OpenObserve Cloud today for more efficient and performant observability.
Monitoring AWS RDS metrics is critical for ensuring the reliability, performance, and scalability of your database systems, especially when managing multiple AWS accounts with multiple RDS instances. This guide walks you through the end-to-end process of using AWS CloudWatch and OpenTelemetry (Otel) 1.0 to collect, stream, and visualize RDS metrics efficiently.
RDS metrics provide essential insights into your database health and performance, enabling you to:
Before starting, ensure:
CloudWatch streams metrics via Kinesis, which acts as a transport mechanism. Follow these steps:
Create a Kinesis Data Stream:
RDSMetricsStream). 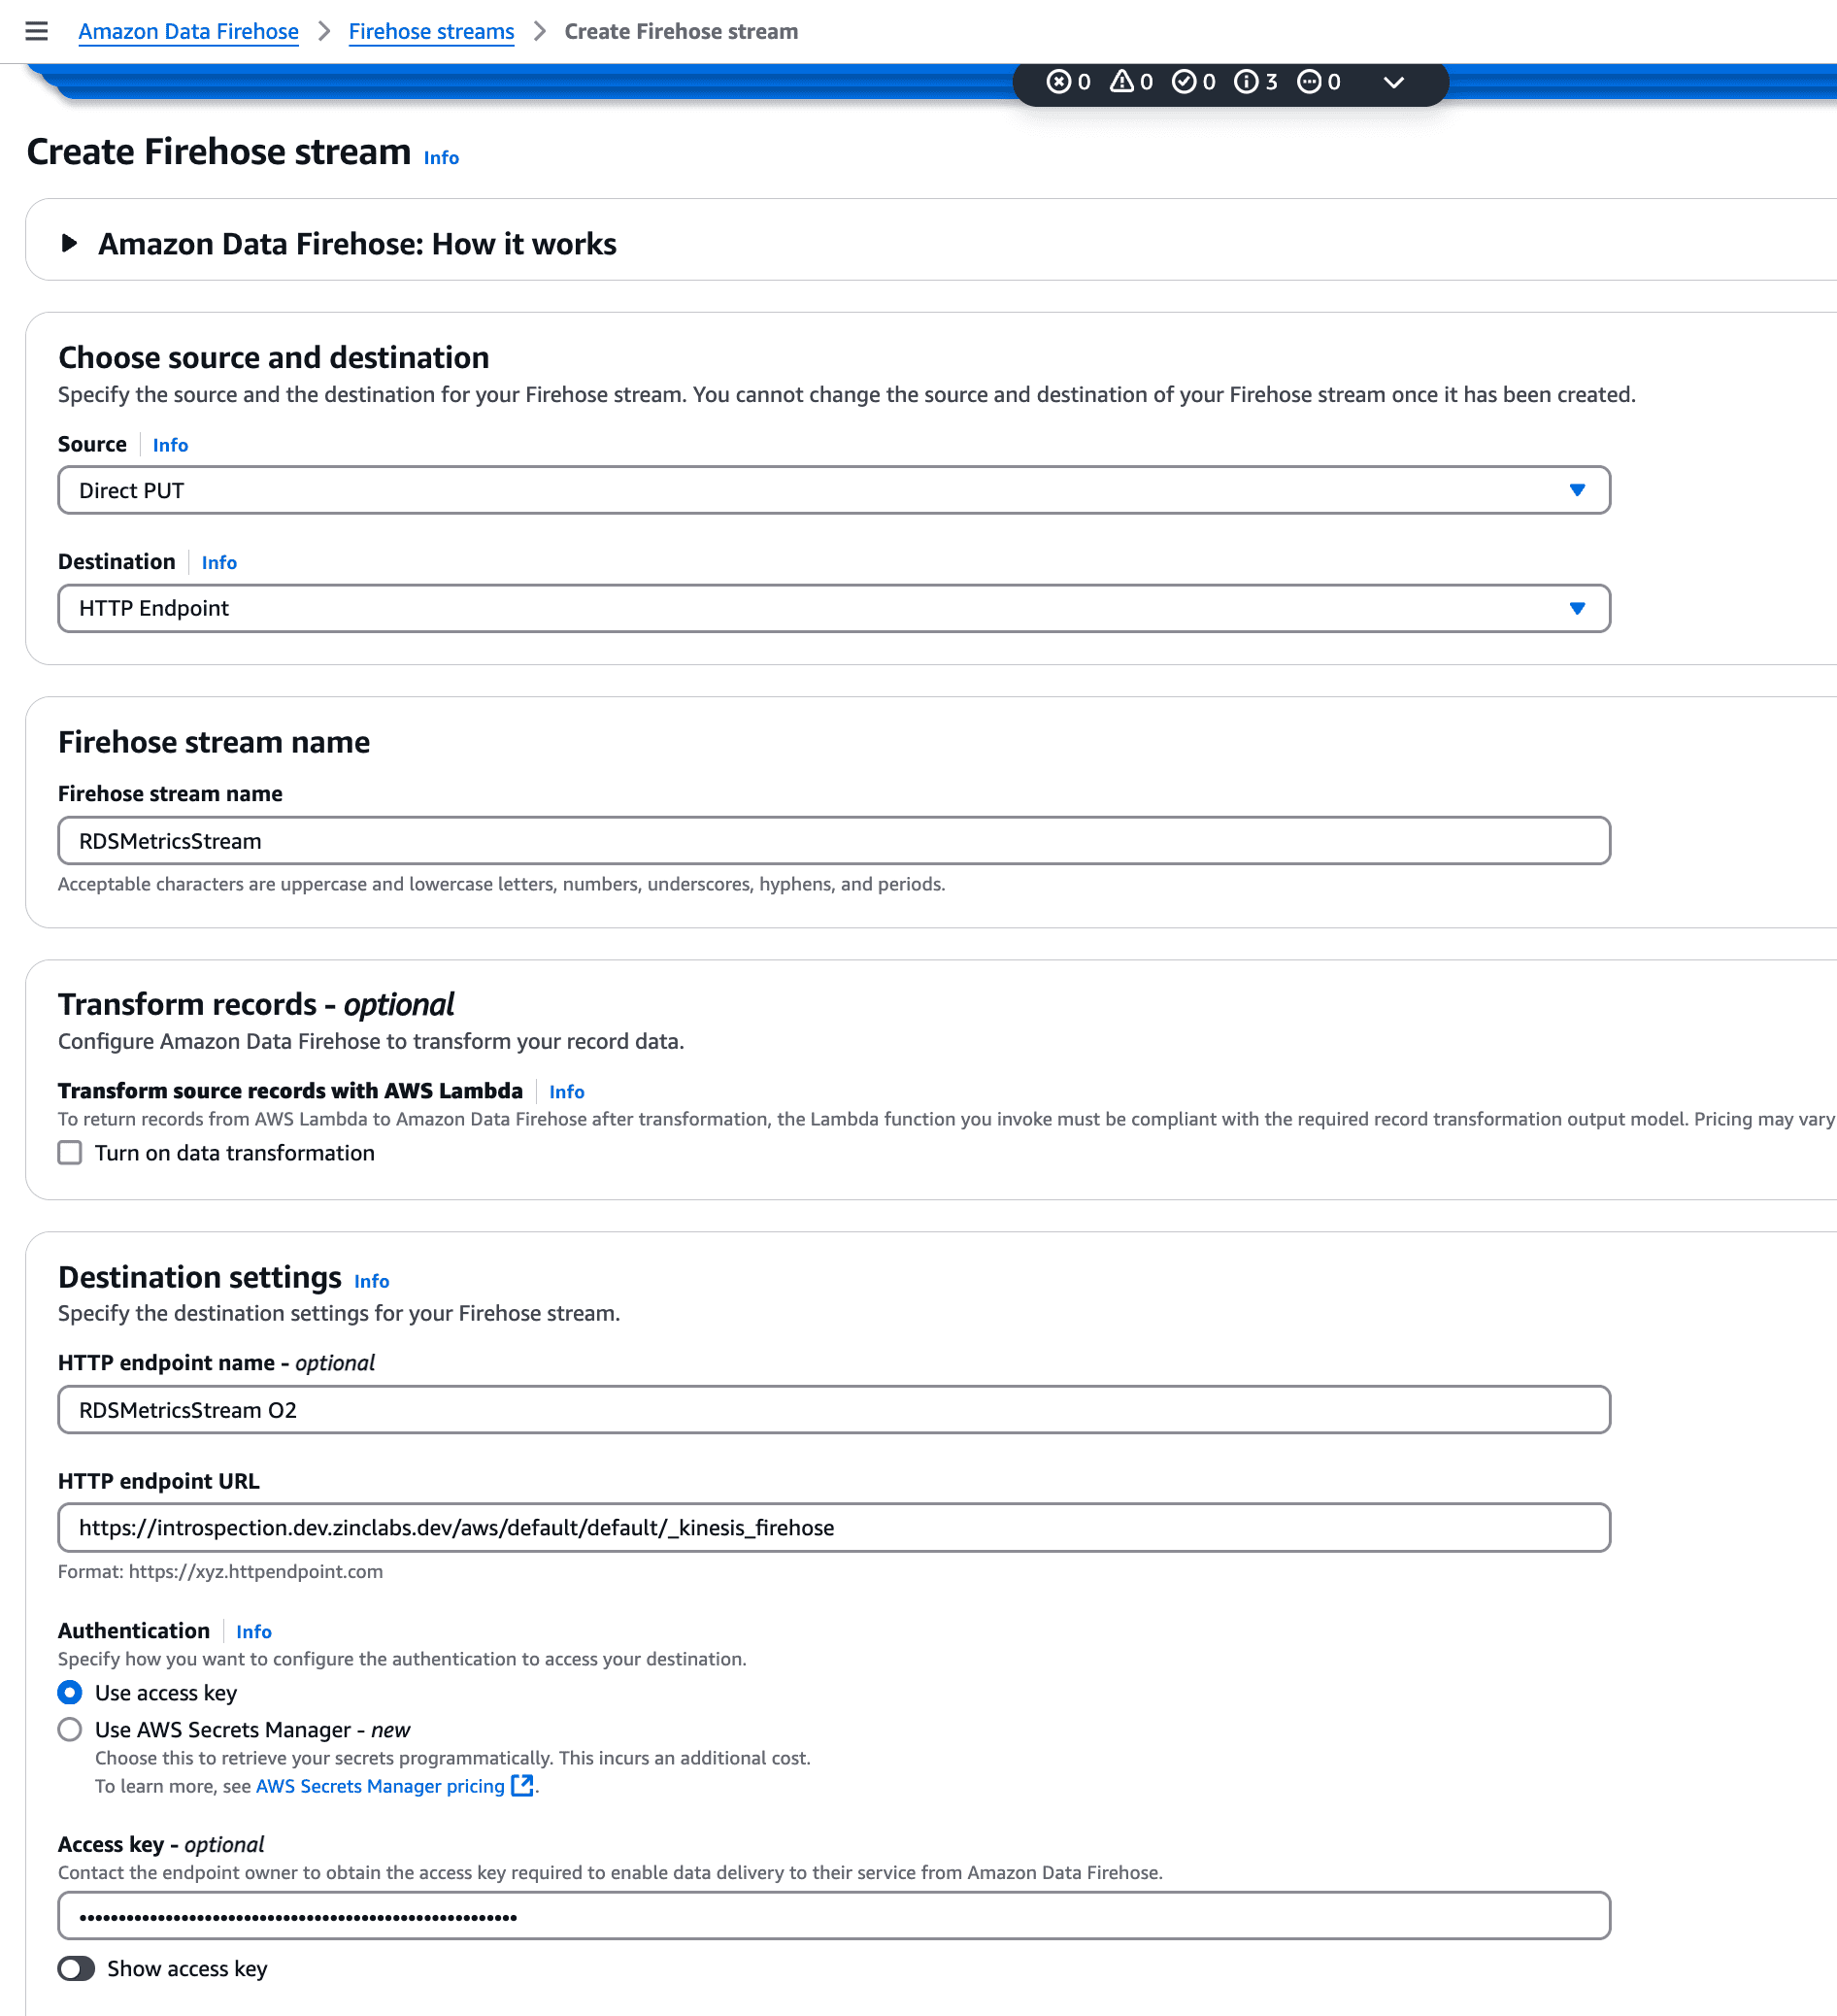
Connect the Metric Stream to Kinesis:
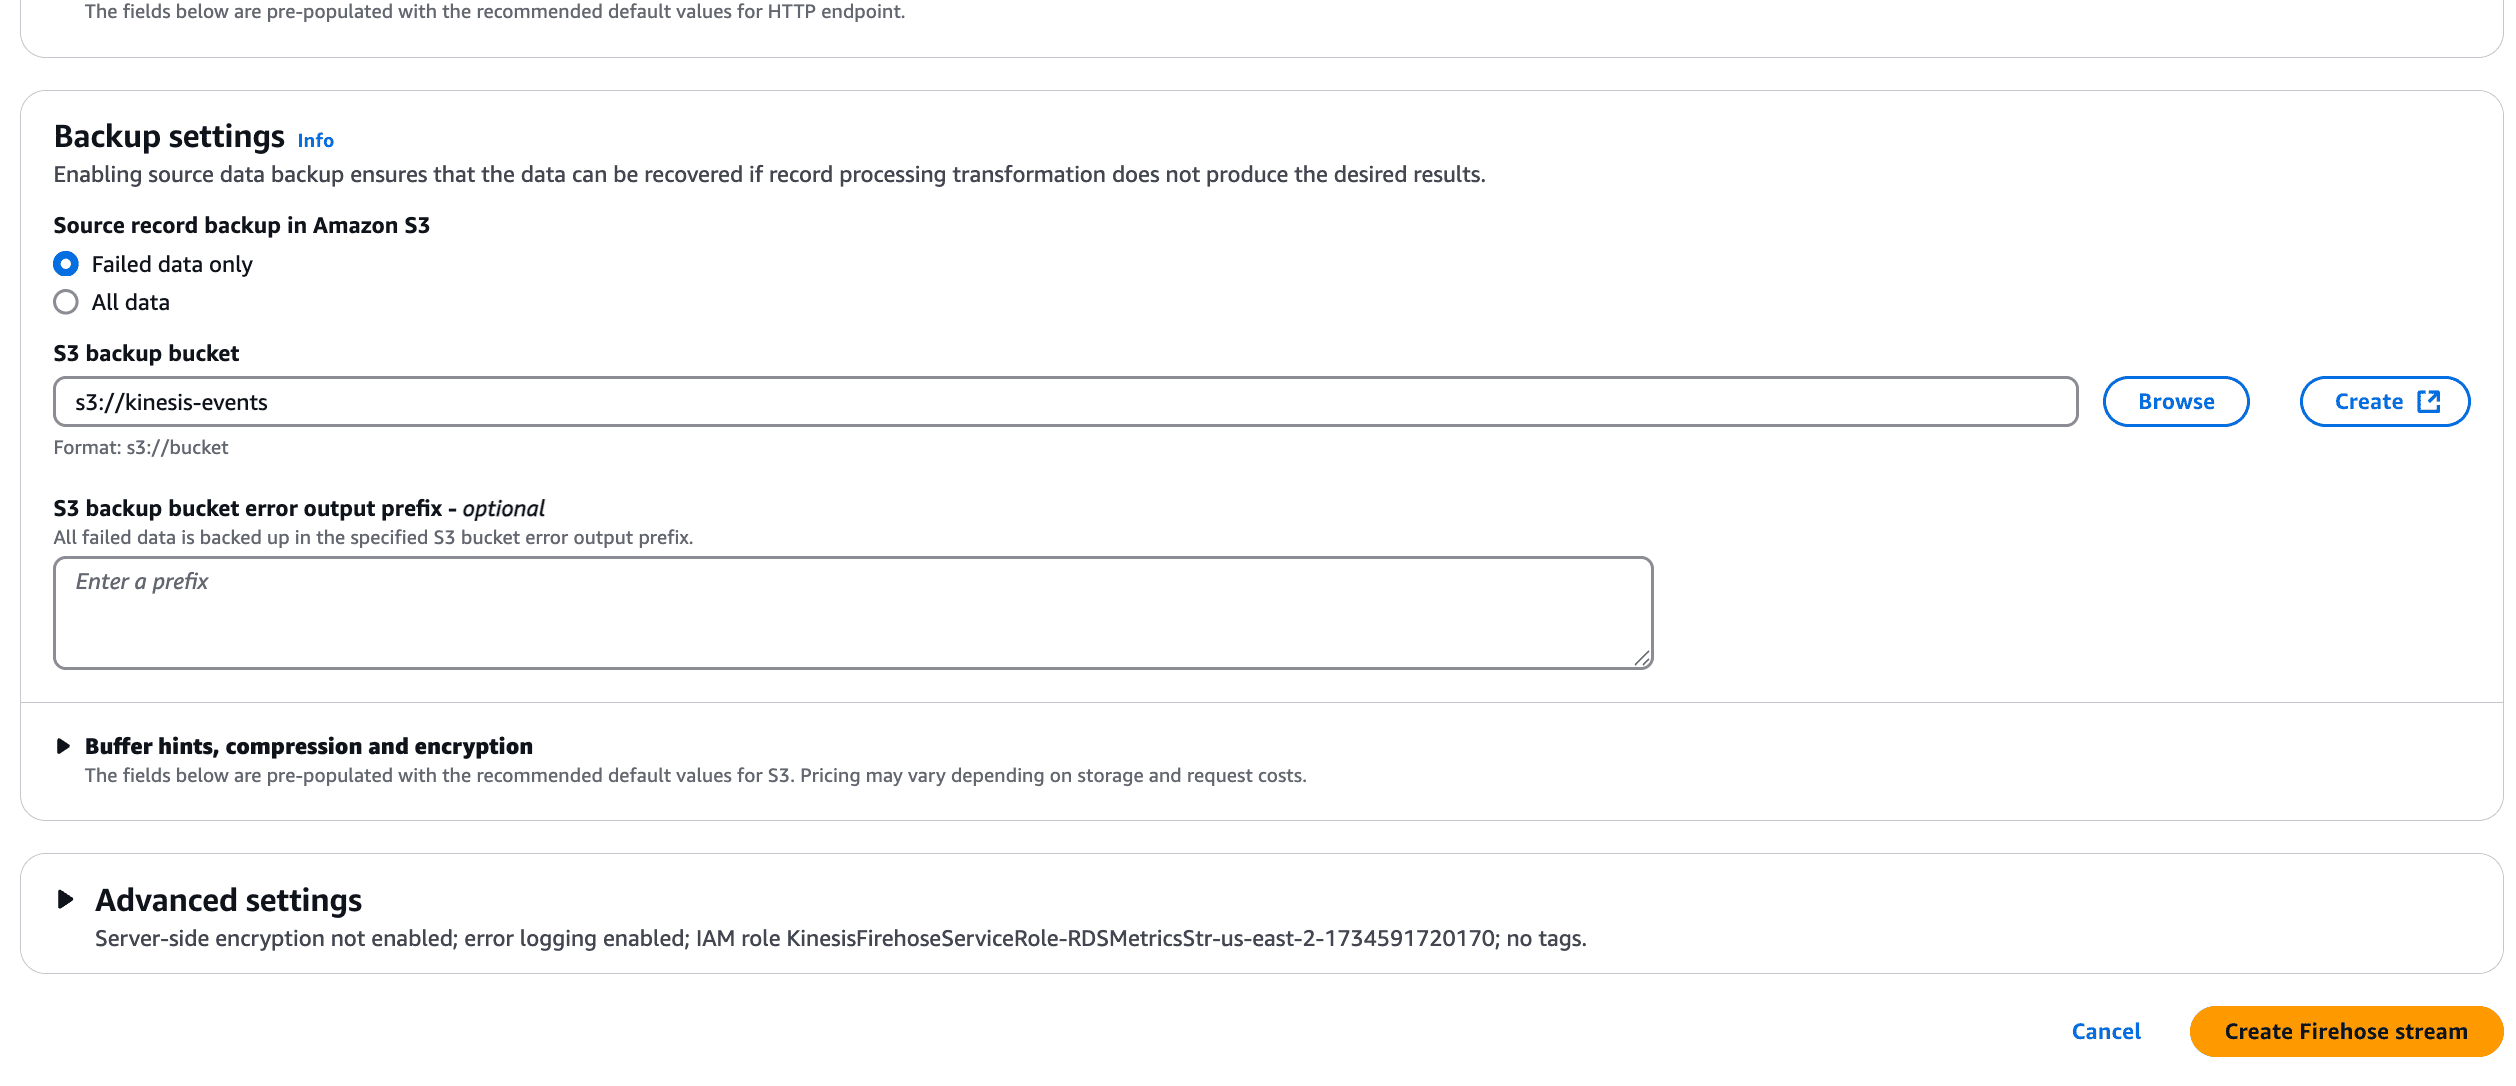
Refer to this guide for detailed Kinesis configuration steps.
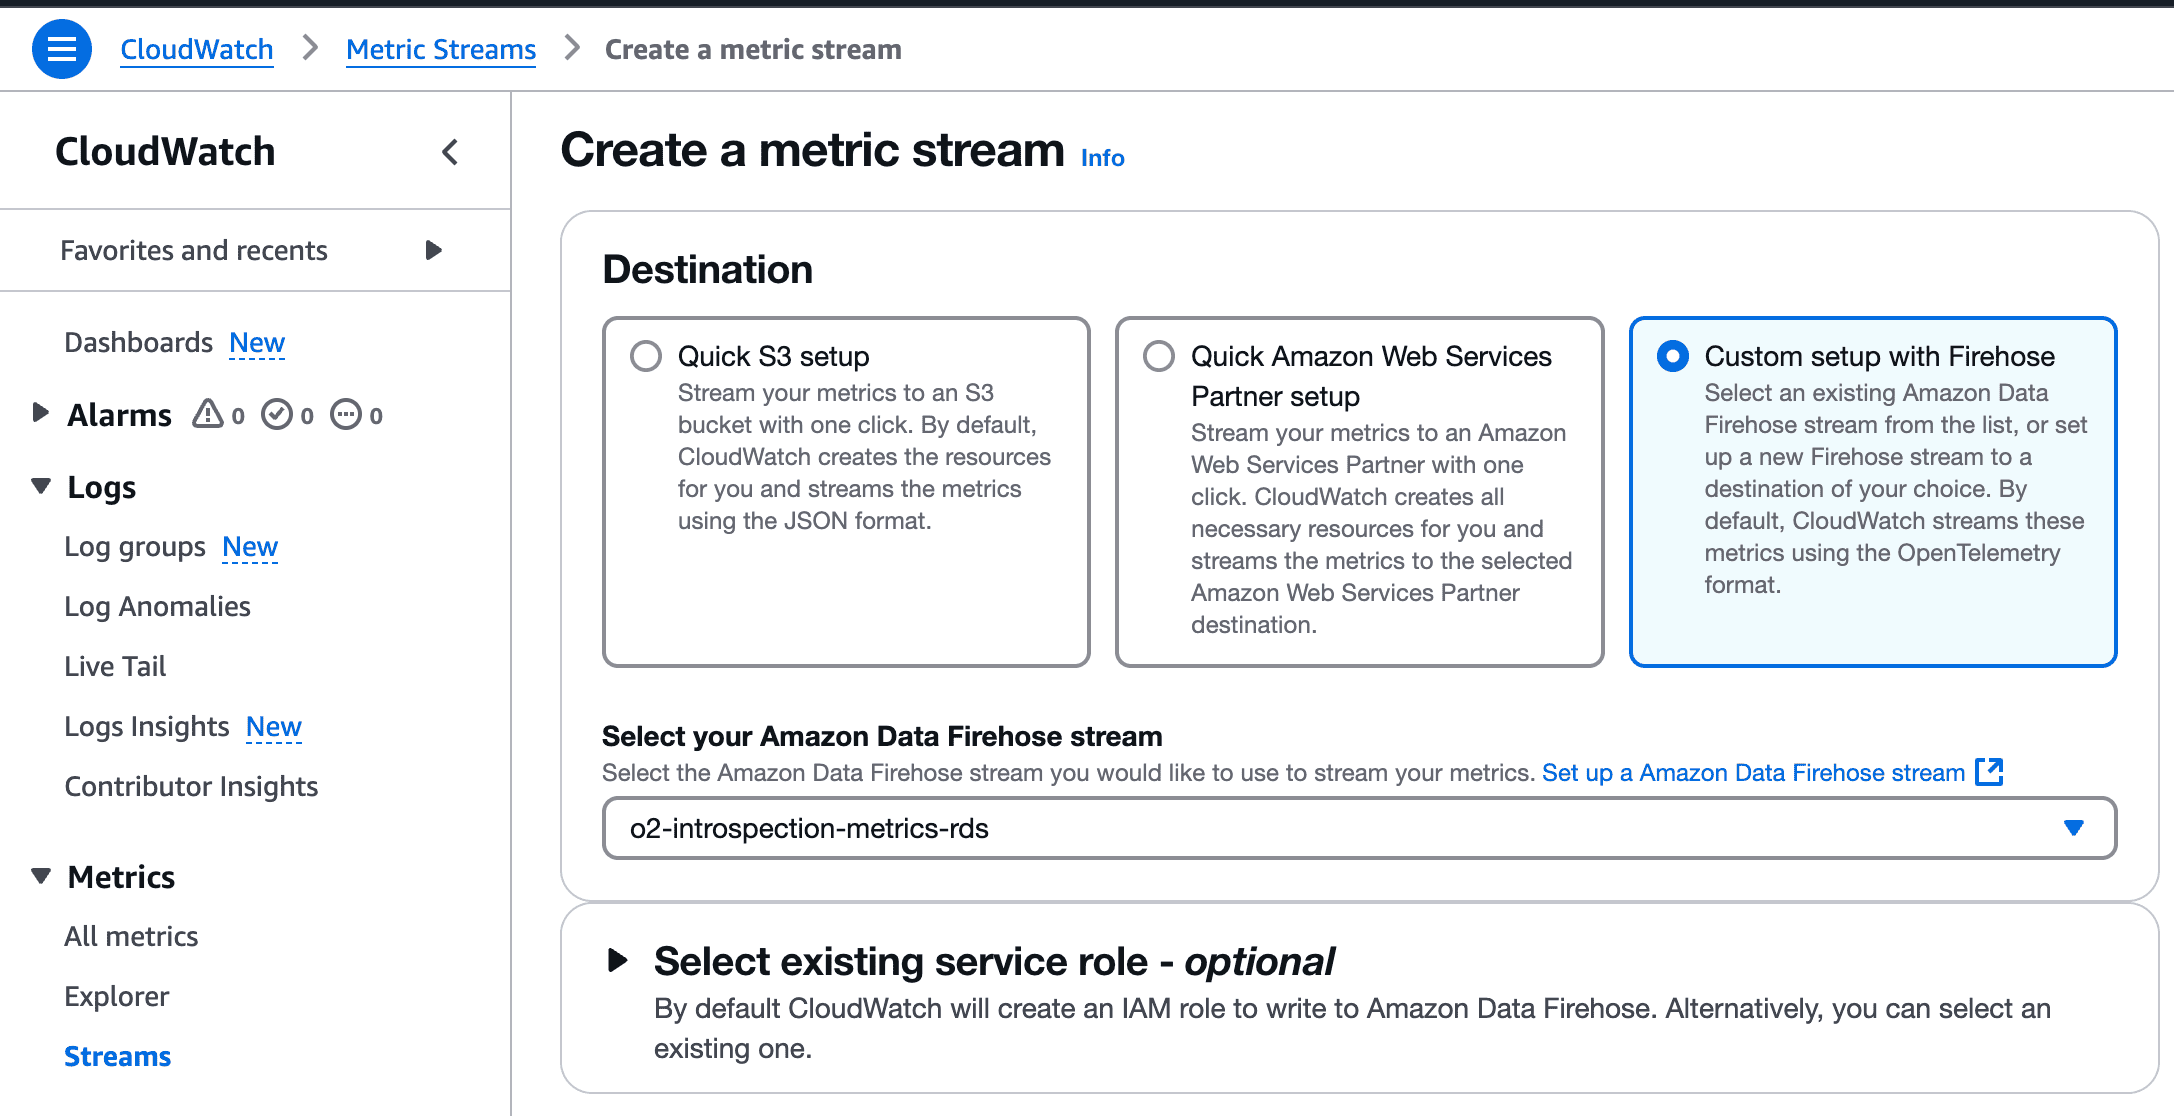
A metric stream in AWS CloudWatch allows you to stream selected metrics to a destination for analysis. Follow these steps:
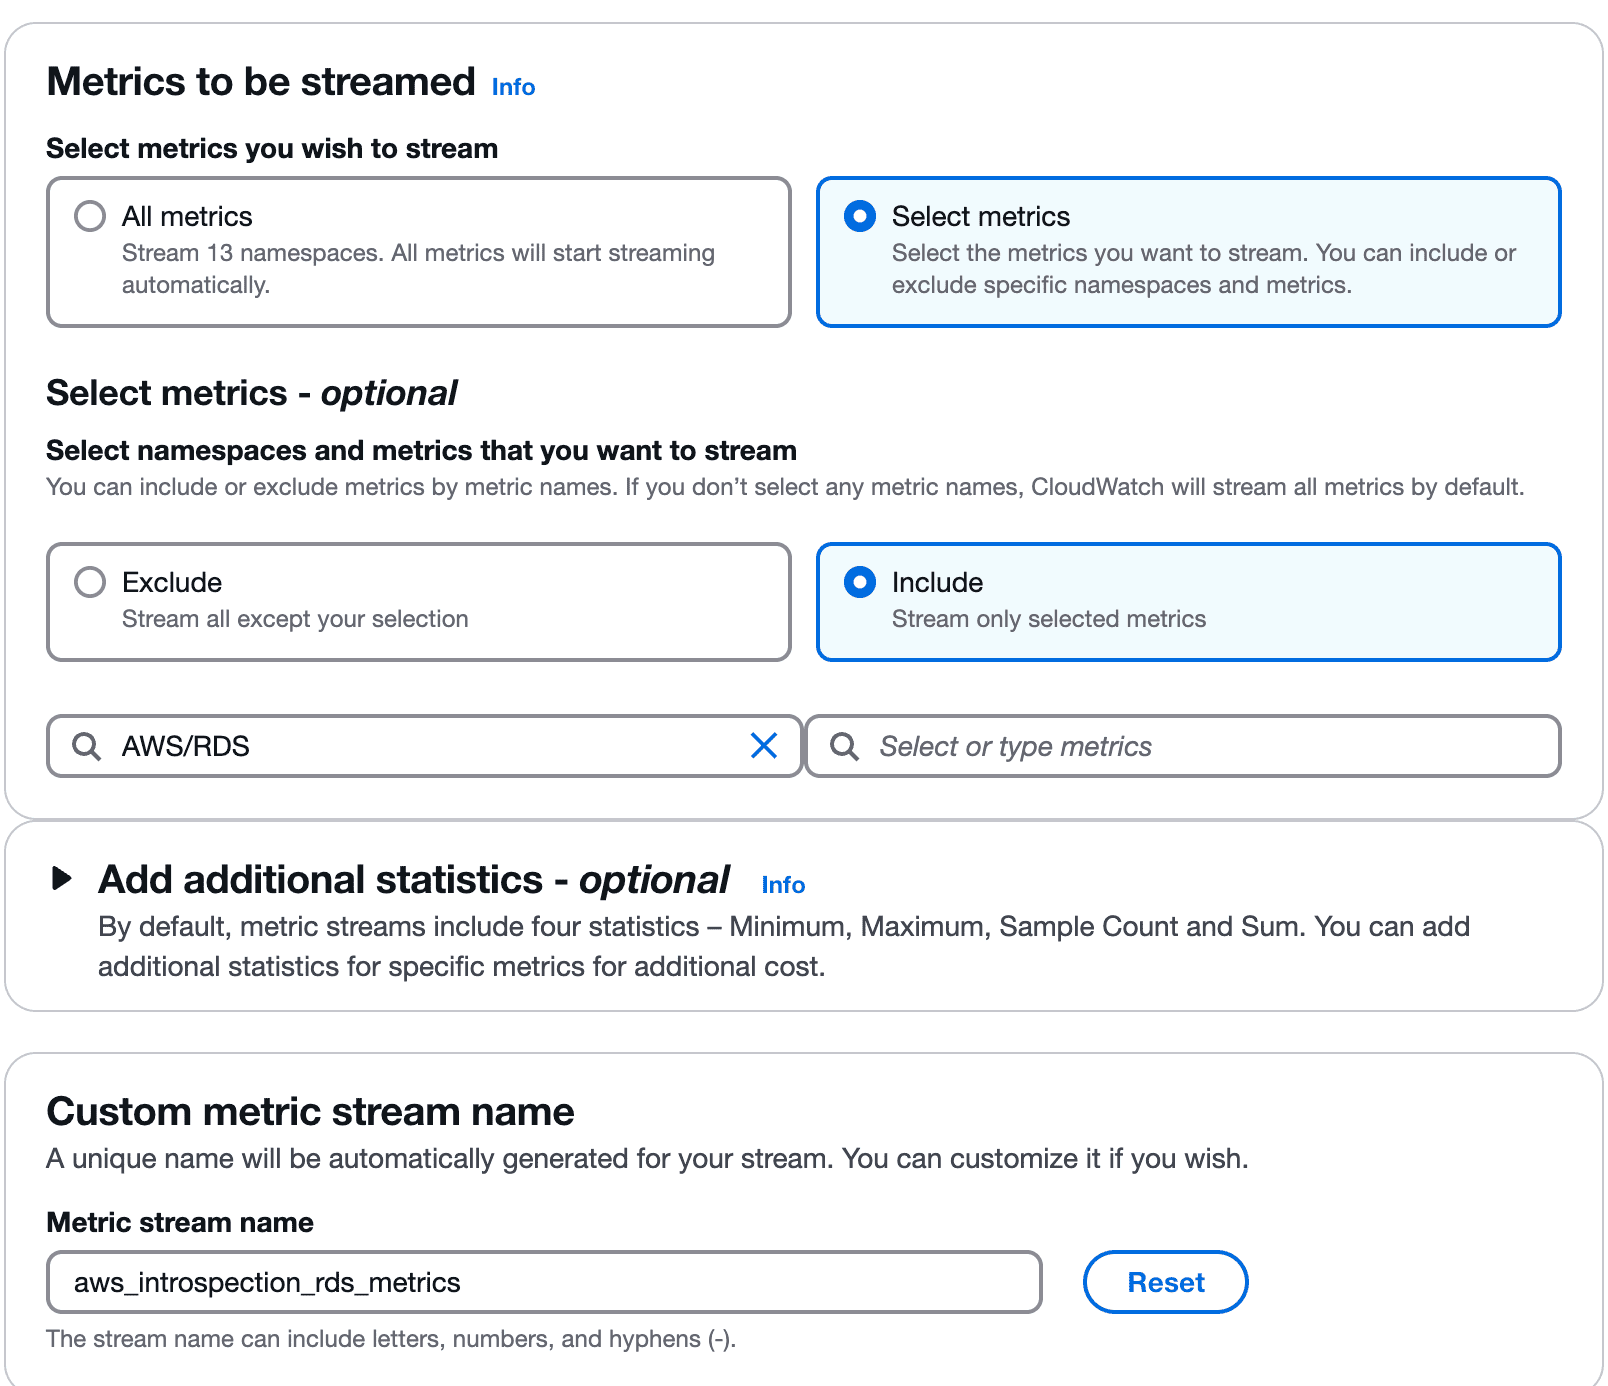
Select the metrics you want to stream:
Go to OpenObserve dashboard and select logs and search for the stream that you have created while providing HTTP endpoint in kinesis.
Metrics are ingested as logs within OpenObserve in OpenTelemetry 1.0 format that will allow you to use SQL to create dashboards.
To visualize the ingested metrics effectively, use the prebuilt RDS monitoring dashboard available in the OpenObserve Dashboards repository:
| Feature/Aspect | With OpenObserve | Without OpenObserve |
|---|---|---|
| Centralized Monitoring | Multi-account and multi-region RDS instances can be monitored in a single dashboard. | Requires navigating through multiple AWS accounts and regions individually. |
| Custom Dashboards | Build tailored dashboards with real-time visualizations and alerts for RDS metrics. | Limited to pre-defined CloudWatch views with minimal customization options. |
| Unified Observability | Correlate RDS metrics with other system metrics in one platform. | No correlation between RDS metrics and other observability data sources. |
| Cost Efficiency | Optimize cost by ingesting only required metrics and storing them in OpenObserve. | Increased CloudWatch costs due to prolonged retention of all metrics. |
| Alerting and Automation | Set up advanced alerts and automated workflows based on RDS performance thresholds. | Limited alerting options with basic CloudWatch alarms. |
| Retention and Analysis | Long-term storage of metrics with advanced querying for historical analysis. | Metrics retention limited to CloudWatch retention policies (up to 15 months). |
By following these steps, you can set up an end-to-end monitoring solution for AWS RDS metrics using CloudWatch and OpenTelemetry. This approach ensures:
Ready to optimize your database performance and simplify your observability workflows? Visit our website to learn more details about how the platform works.
Chaitanya Sistla is a Principal Solutions Architect with 17X certifications across Cloud, Data, DevOps, and Cybersecurity. Leveraging extensive startup experience and a focus on MLOps, Chaitanya excels at designing scalable, innovative solutions that drive operational excellence and business transformation.