How to Monitor Jenkins Pipelines with OpenTelemetry and OpenObserve

Chaitanya Sistla
November 10, 2024
5 min read
Don’t forget to share!
Try OpenObserve Cloud today for more efficient and performant observability.
Effective monitoring of Jenkins pipelines is crucial for maintaining reliable software delivery, identifying bottlenecks, and ensuring that each step in your CI/CD pipeline runs smoothly. OpenTelemetry and OpenObserve provide a powerful combination for tracking Jenkins logs, metrics, and traces in real-time. This guide will walk you through setting up Jenkins with OpenTelemetry to visualize key metrics and improve your pipeline observability using OpenObserve.
Jenkins is a popular open source platform for automating software build, test, and deployment workflows, but out-of-the-box monitoring capabilities can be limited. By integrating OpenTelemetry into Jenkins, you can gain insights into each stage of your pipeline, identify performance bottlenecks, and troubleshoot issues with ease. OpenObserve offers a simple and scalable solution for viewing these metrics, logs, and traces.
To start capturing Jenkins pipeline data, install the OpenTelemetry (OTel) plugin:
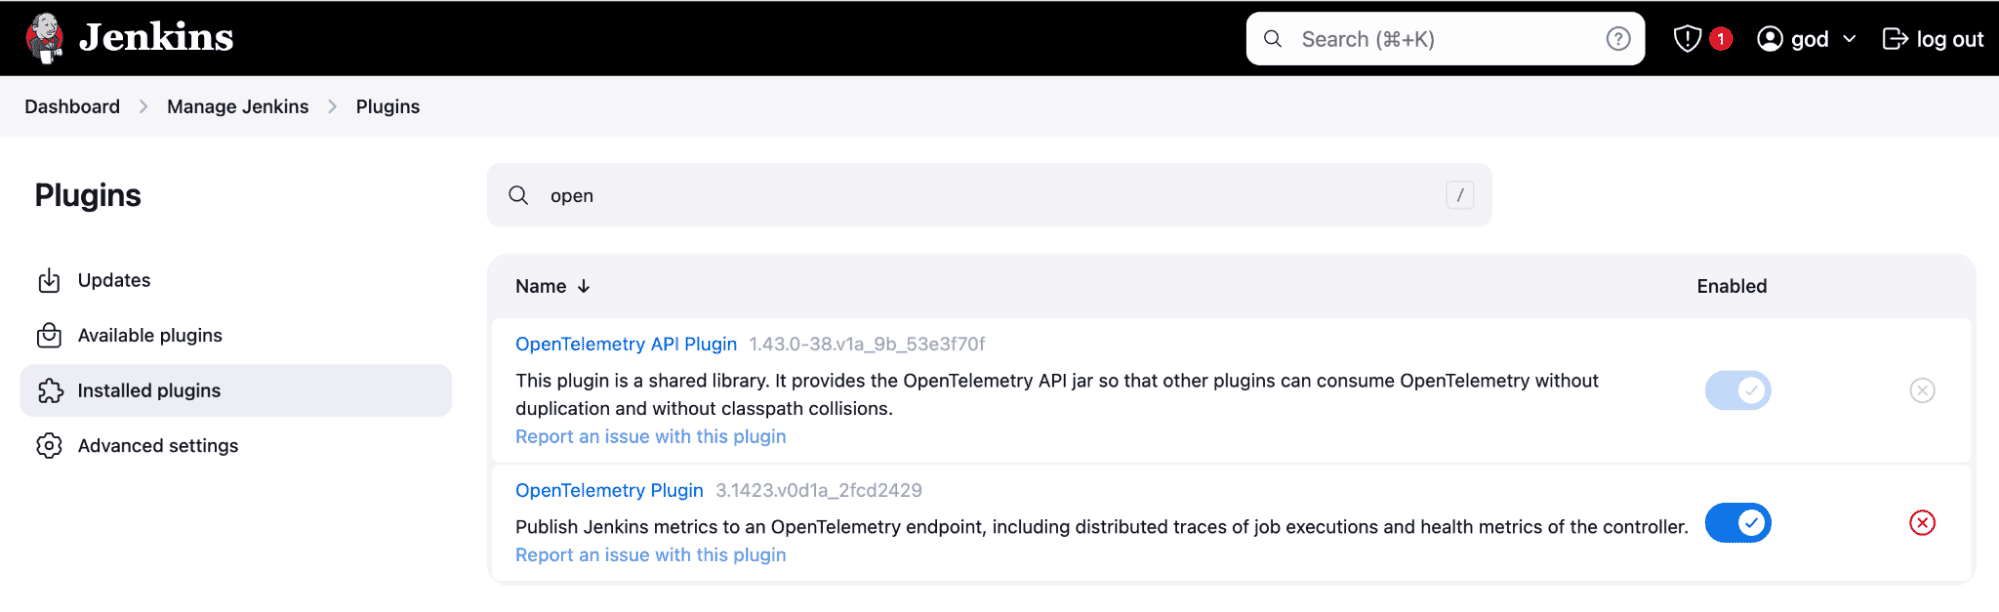
Once installed, the OpenTelemetry plugin enables capturing metrics, traces, and logs, which you’ll configure to send to OpenObserve.
Setting up the OTLP Endpoint in Jenkins
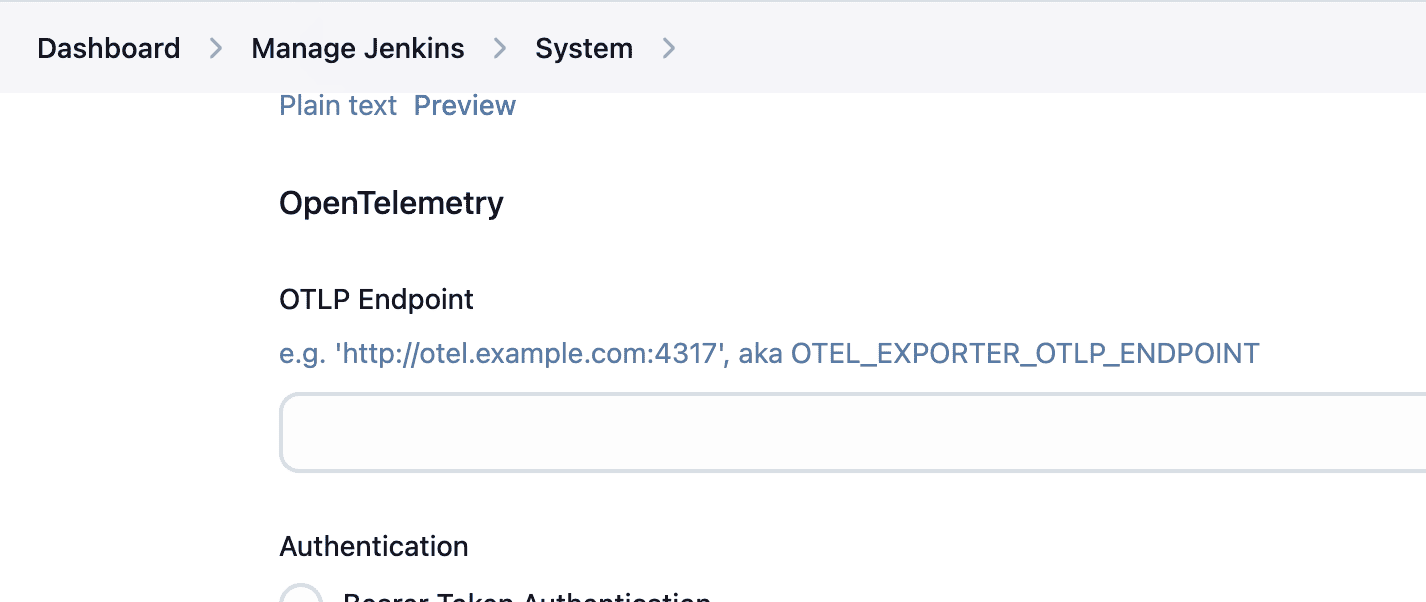
https://<O2_HOST>/api/<O2_ORGNAME>
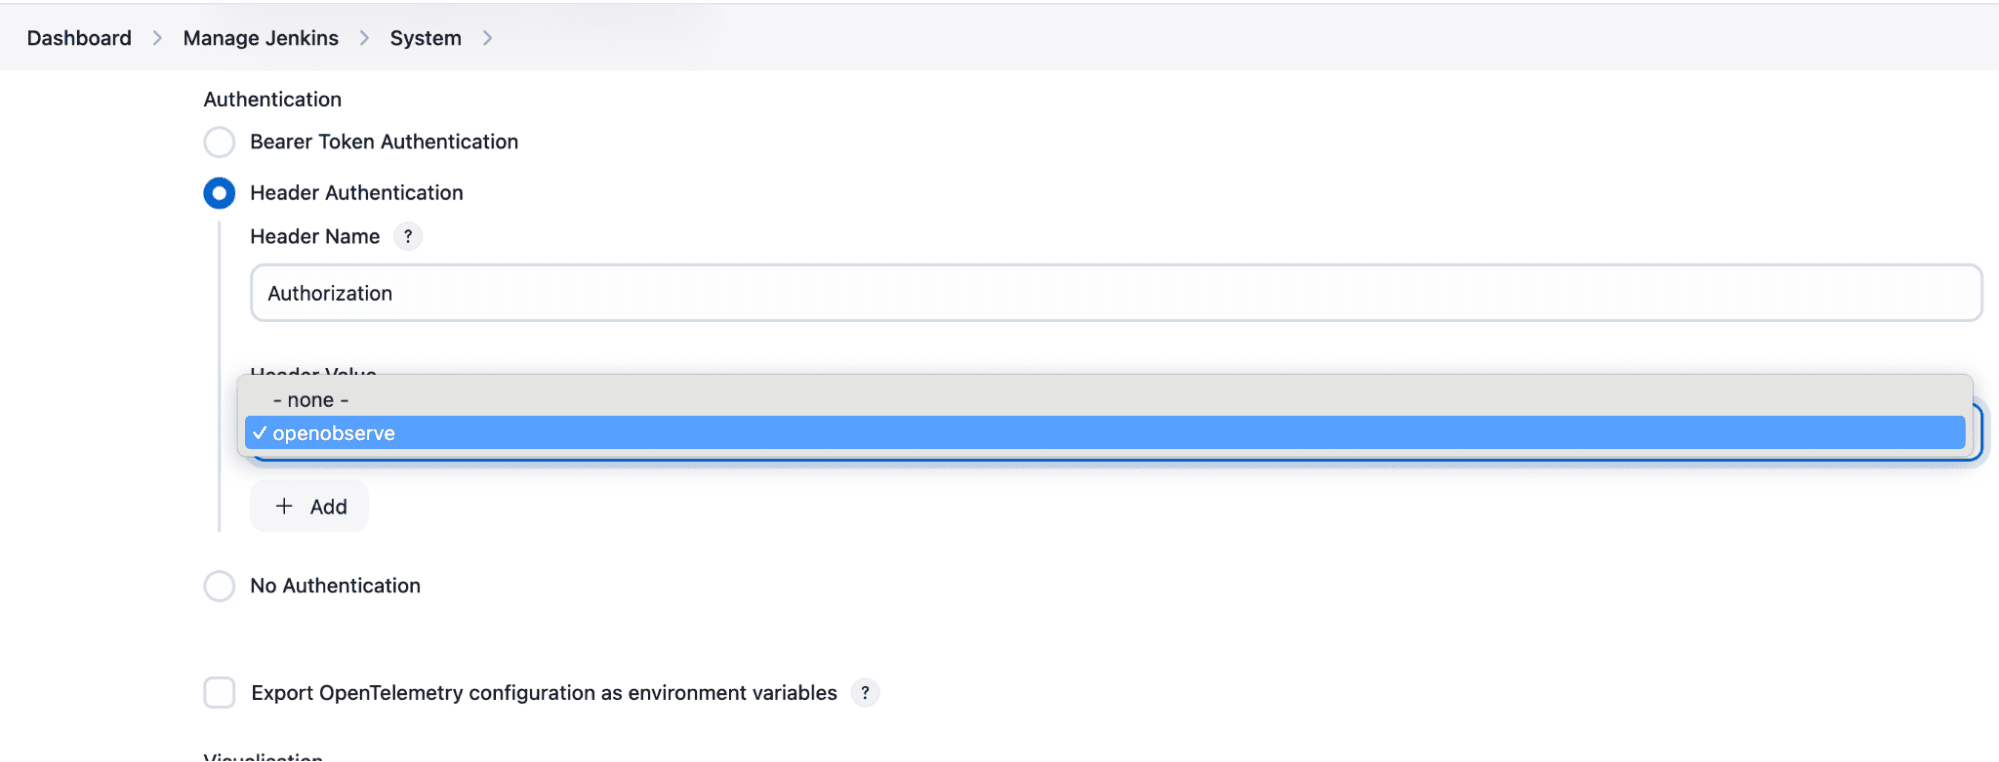
Basic <token>
In the Advanced settings of the OpenTelemetry configuration, add the following properties under Configuration properties to define your logging and tracing setup:
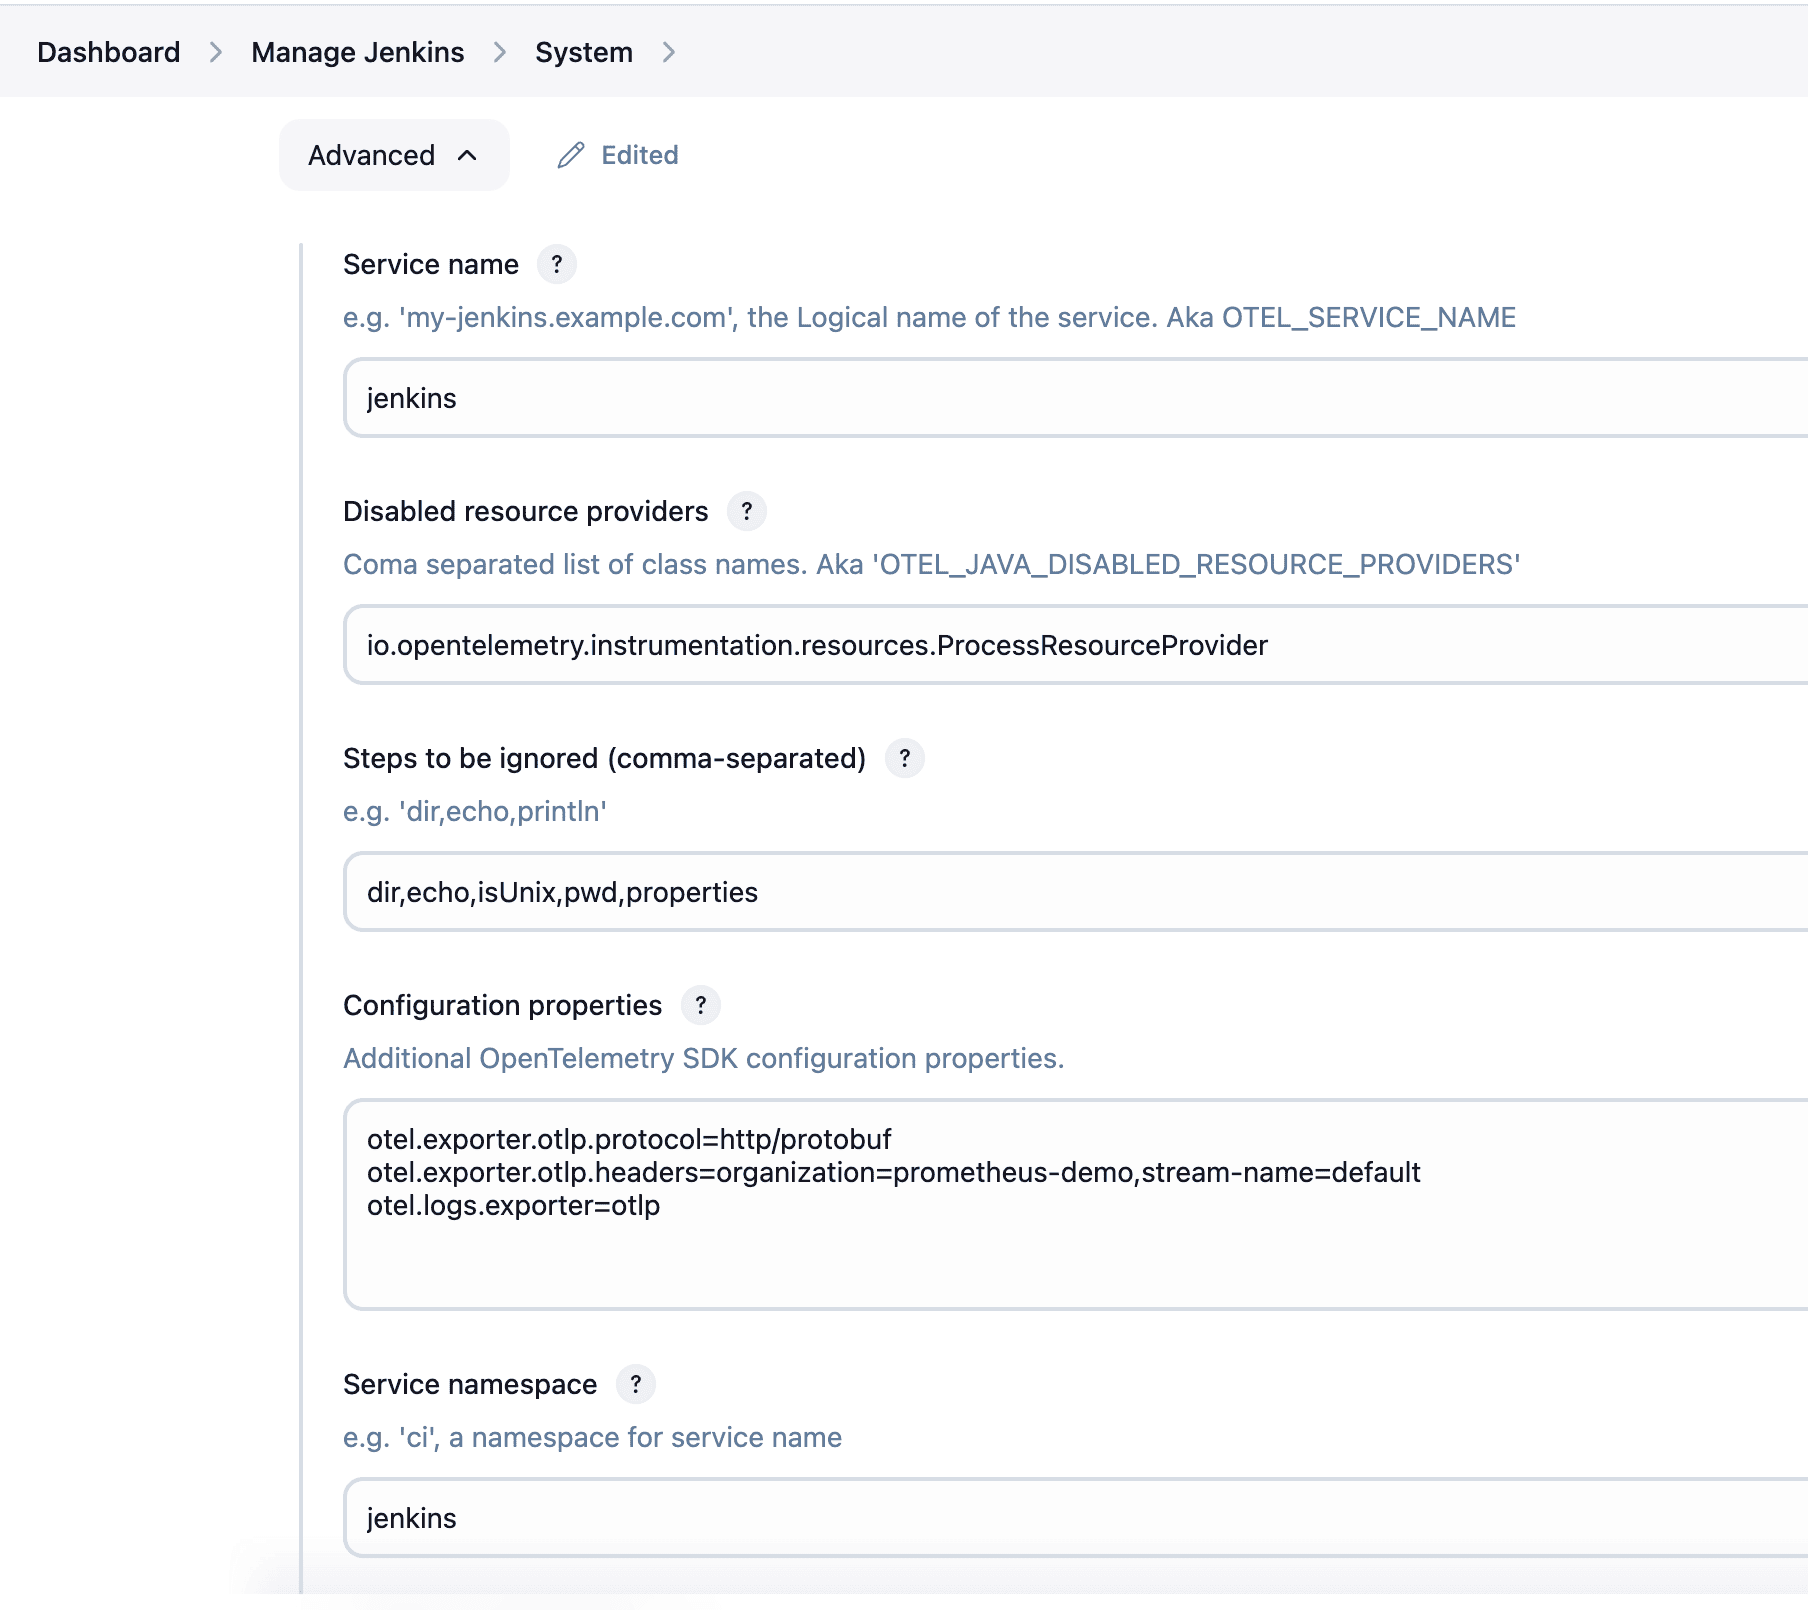
otel.exporter.otlp.protocol=http/protobuf
otel.exporter.otlp.headers=organization=prometheus-demo,stream-name=default
otel.logs.exporter=otlp
You can also refer to the documentation that can help you customize the SDK even further.
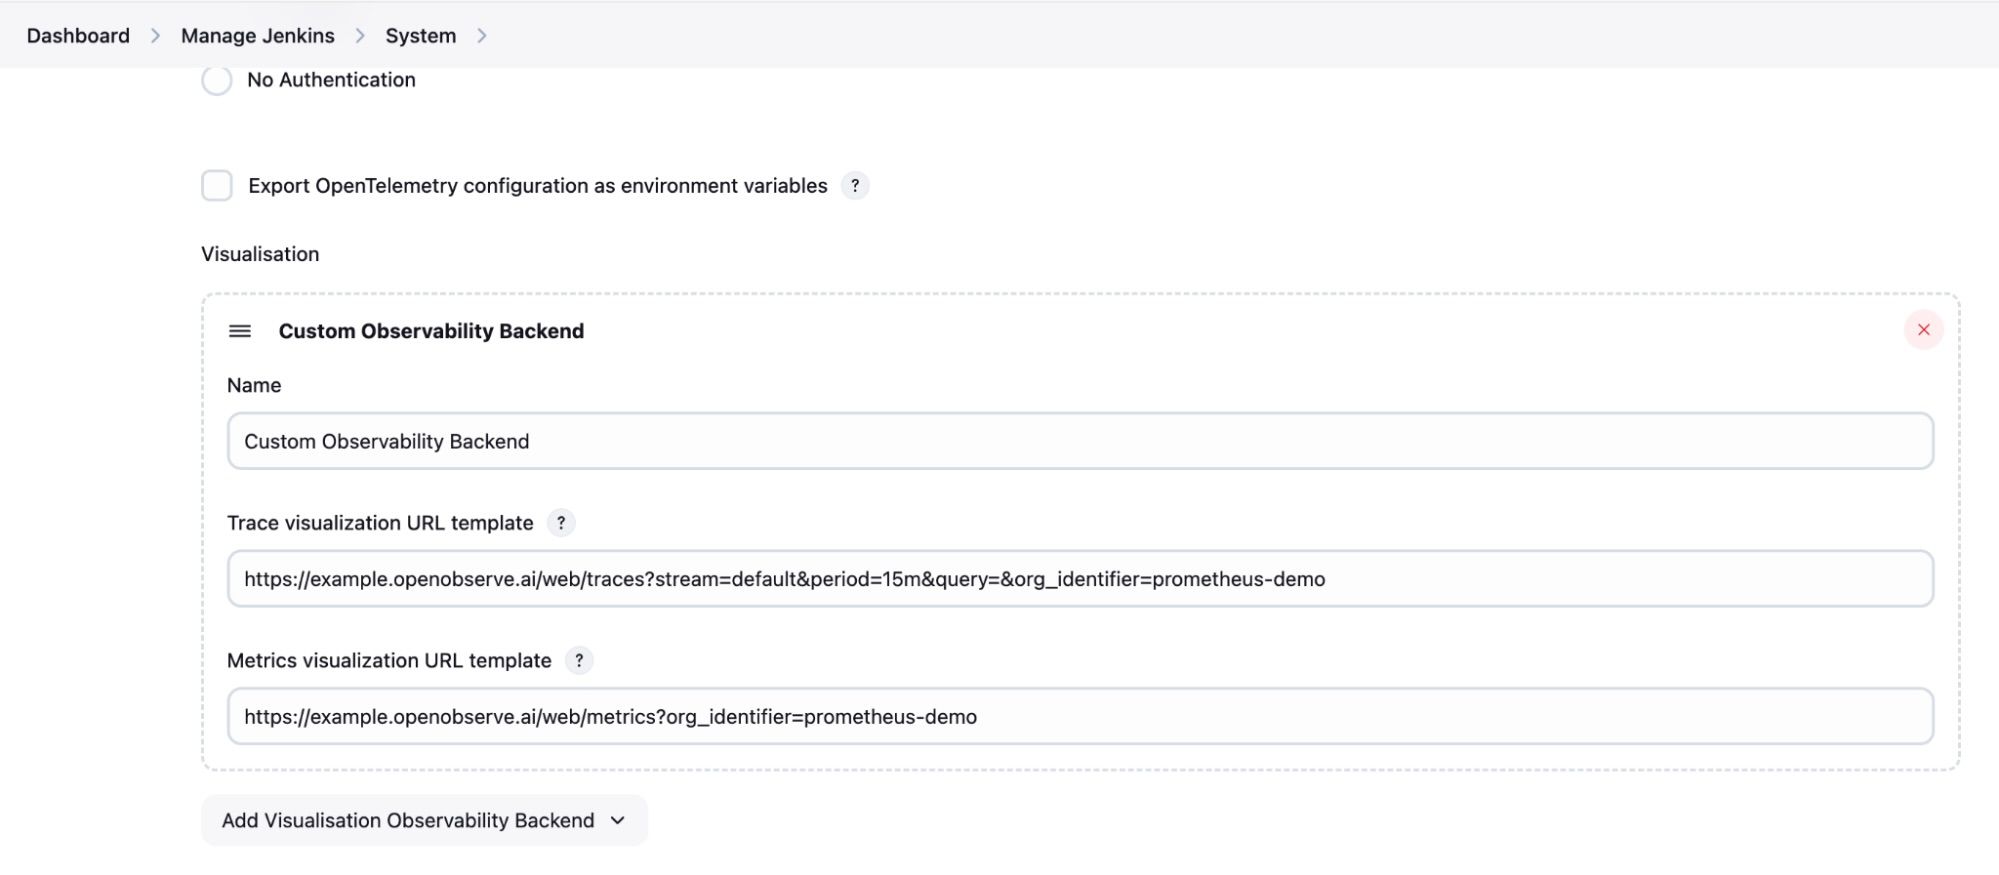
https://<O2_HOST>/traces https://<O2_HOST>/metricsThis setup allows Jenkins users to view pipeline logs and metrics by simply clicking a link in the Jenkins job panel, which redirects them to the relevant OpenObserve visualizations.
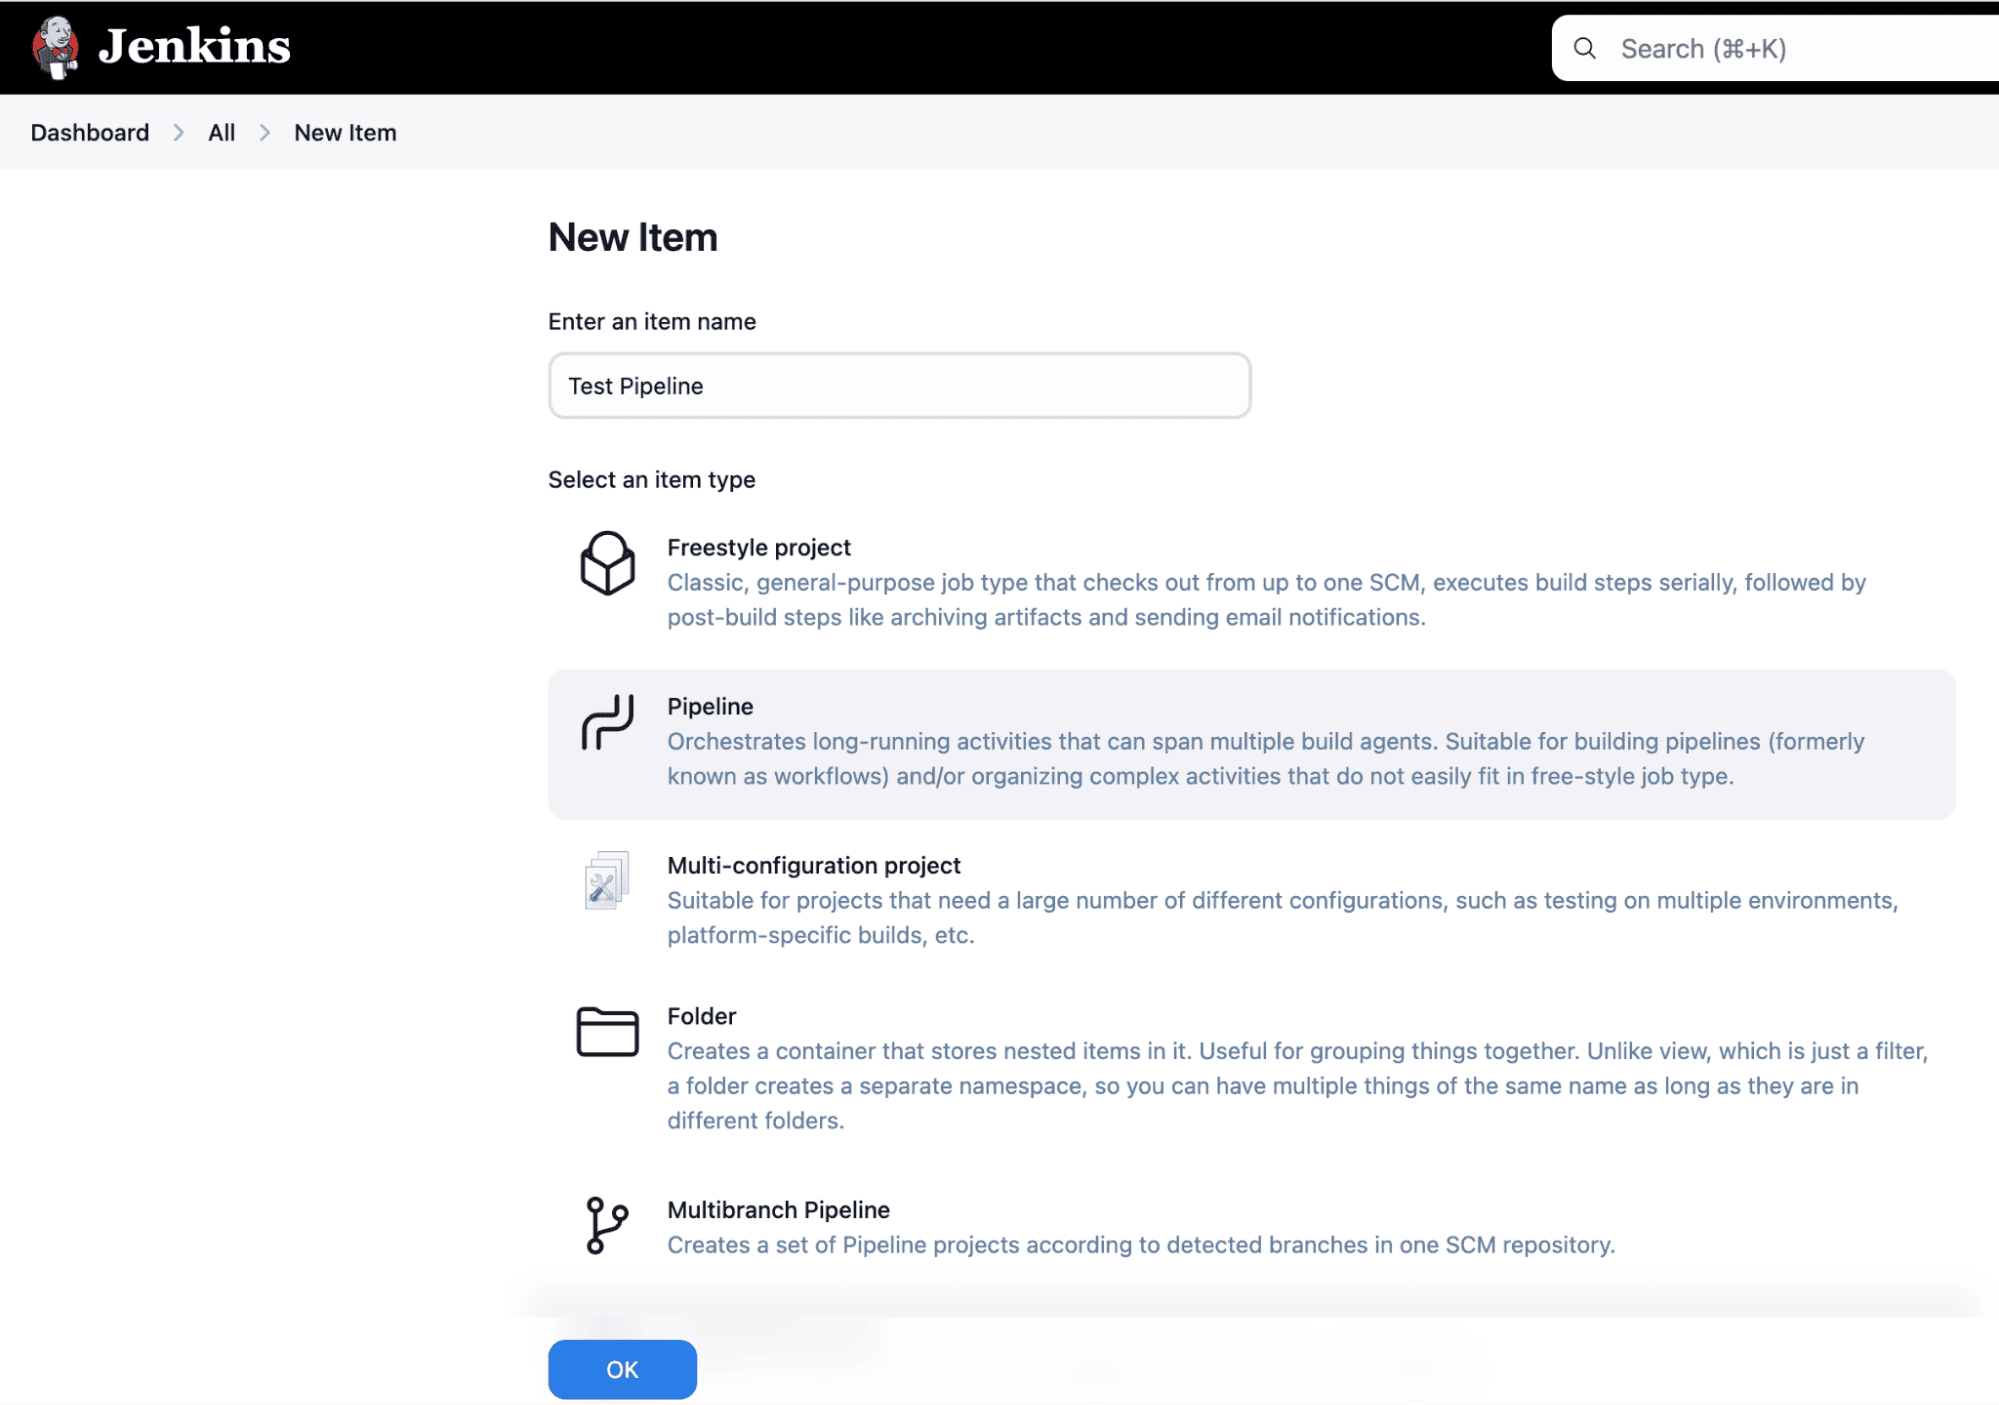
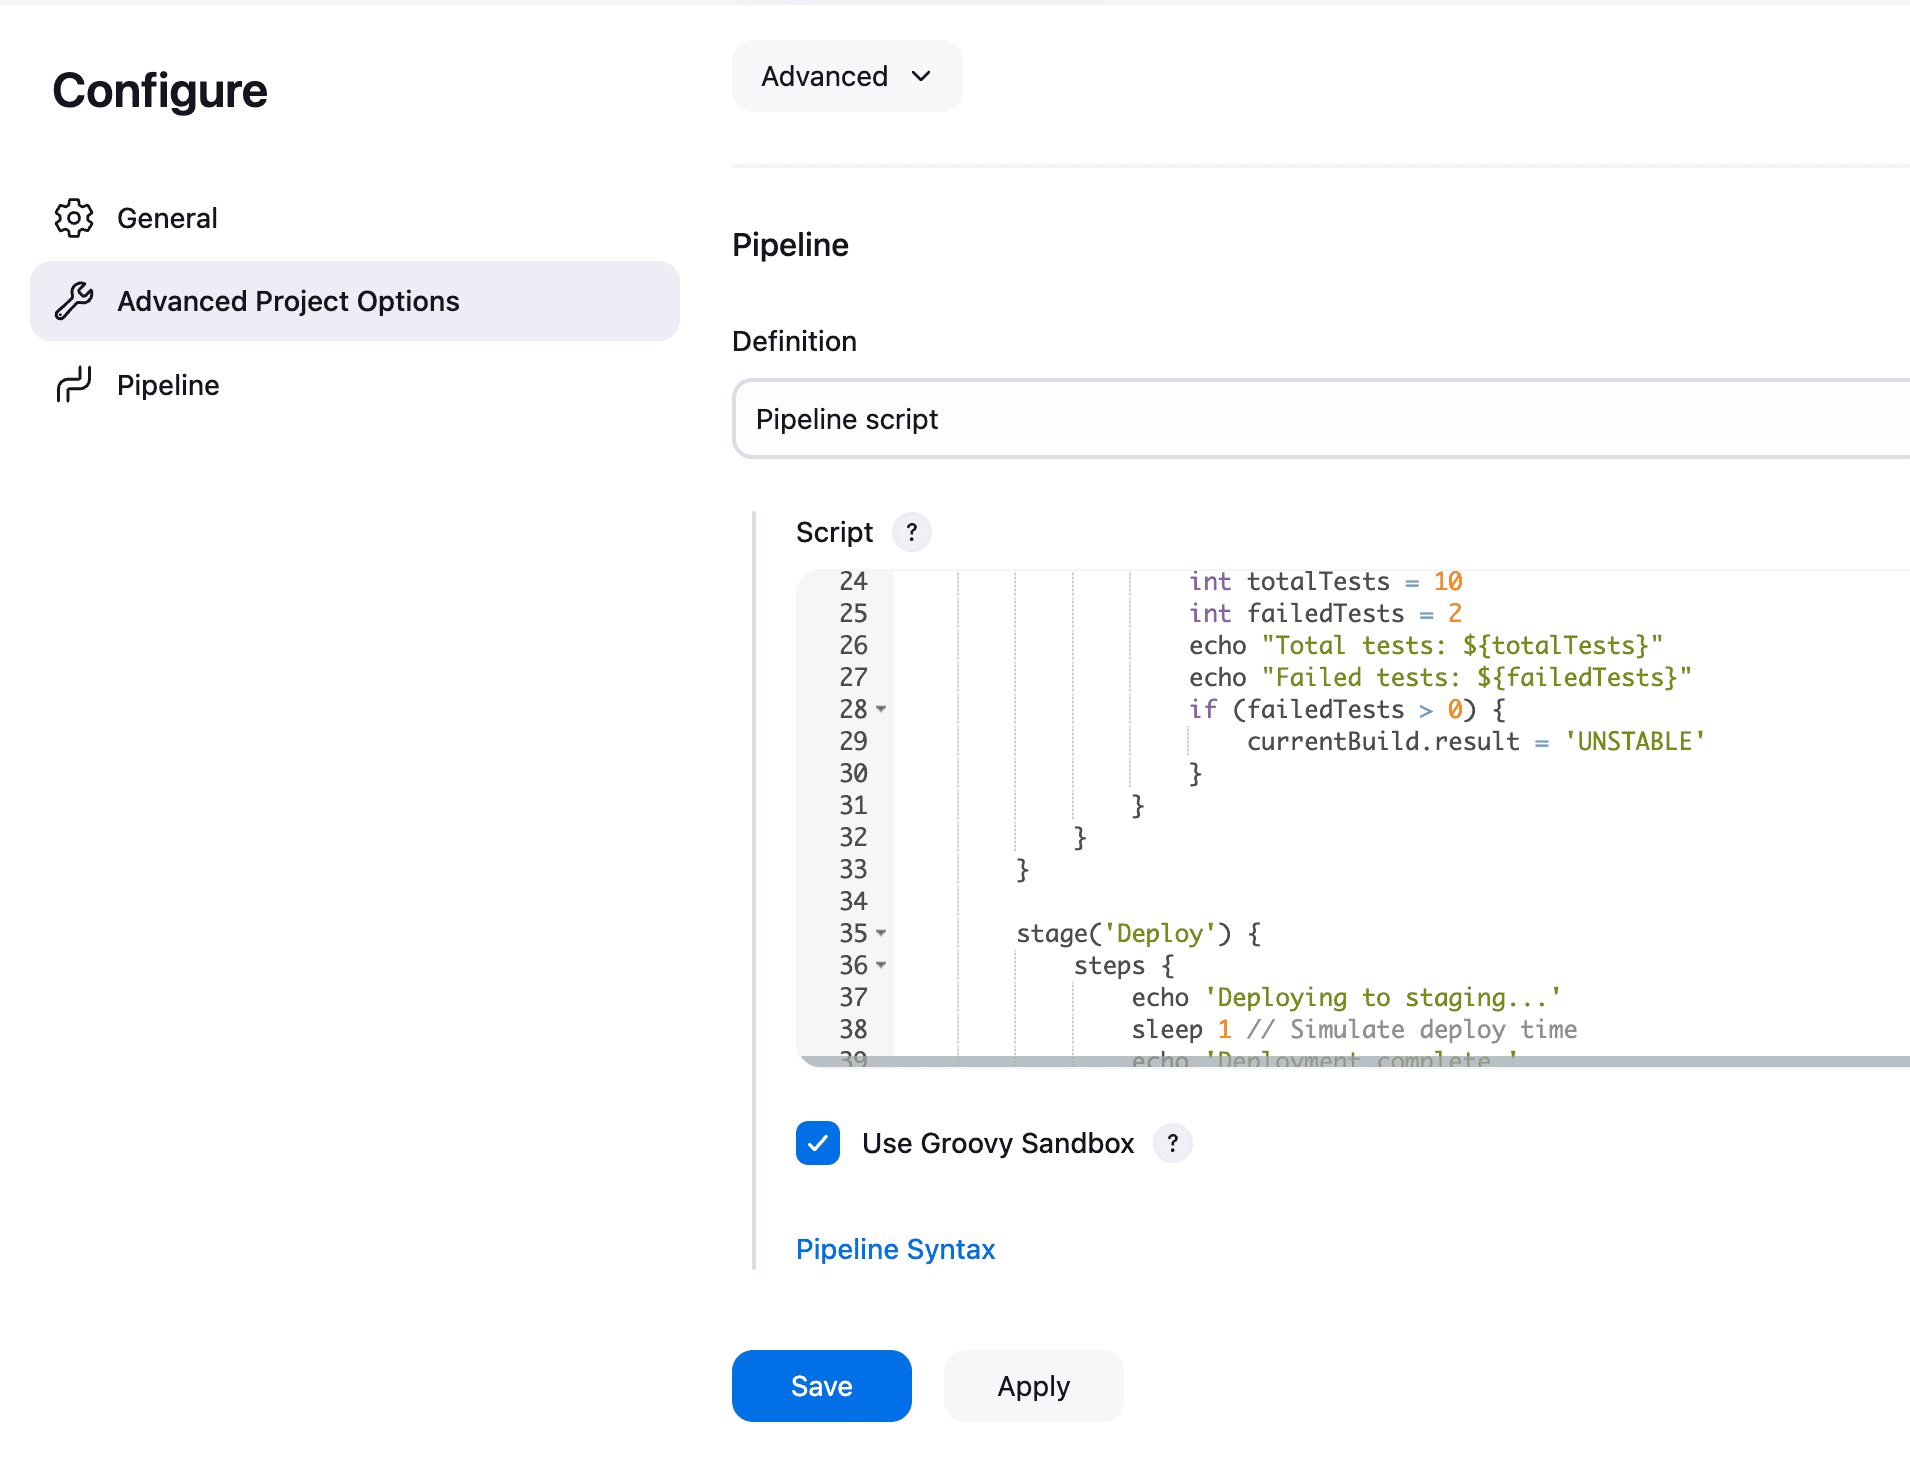
Create a pipeline to generate test data, logs, and metrics to ensure OpenObserve can capture and display your Jenkins pipeline data.
pipeline {
    agent any

    stages {
        stage('Prepare') {
            steps {
                echo 'Preparing environment...'
                sleep 1
            }
        }

        stage('Build') {
            steps {
                echo 'Building the project...'
                sleep 2
            }
        }

        stage('Test') {
            steps {
                echo 'Running tests...'
                script {
                    int totalTests = 10
                    int failedTests = 2
                    echo "Total tests: ${totalTests}"
                    echo "Failed tests: ${failedTests}"
                    if (failedTests > 0) {
                        currentBuild.result = 'UNSTABLE'
                    }
                }
            }
        }

        stage('Deploy') {
            steps {
                echo 'Deploying to staging...'
                sleep 1
            }
        }
    }

    post {
        success {
            echo 'Pipeline completed successfully!'
        }
        unstable {
            echo 'Pipeline completed with some test failures.'
        }
        failure {
            echo 'Pipeline failed.'
        }
    }
}
This pipeline includes stages for Prepare, Build, Test, and Deploy, generating different types of logs, metrics, and statuses. Run this pipeline to create activity that will be captured by OpenTelemetry and sent to OpenObserve.
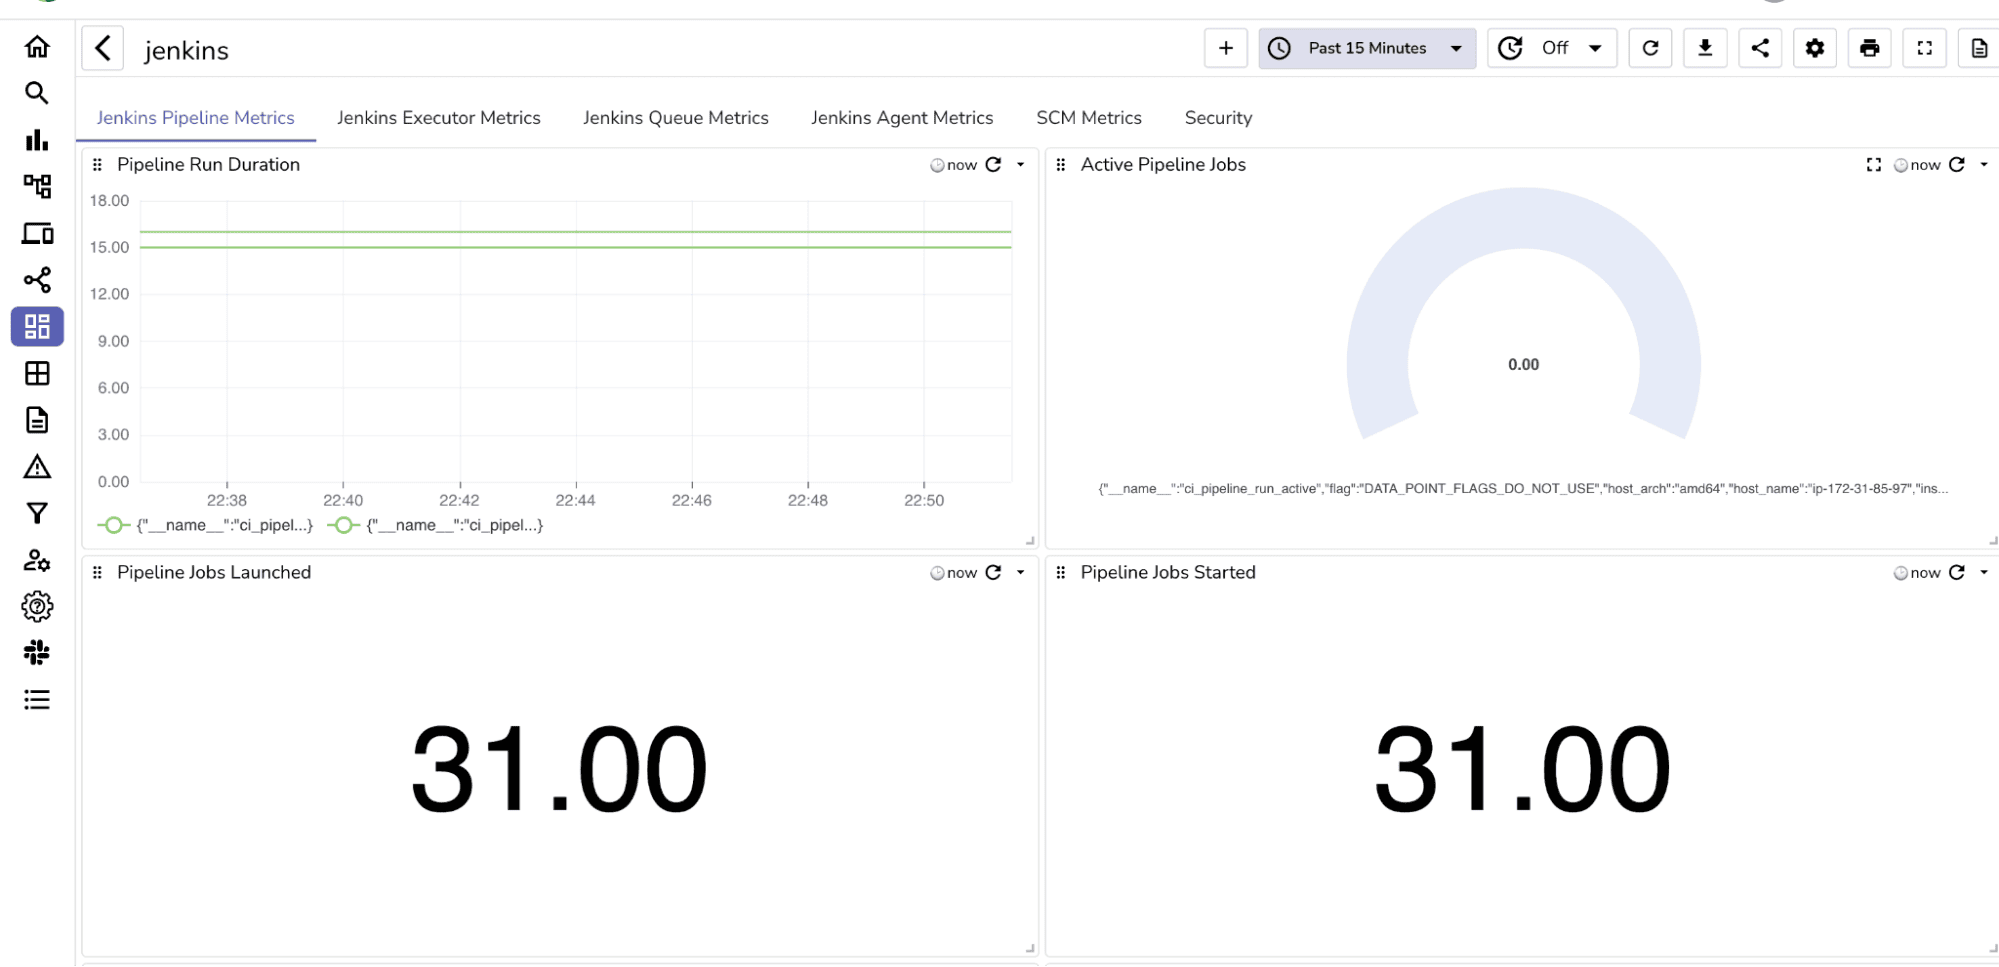
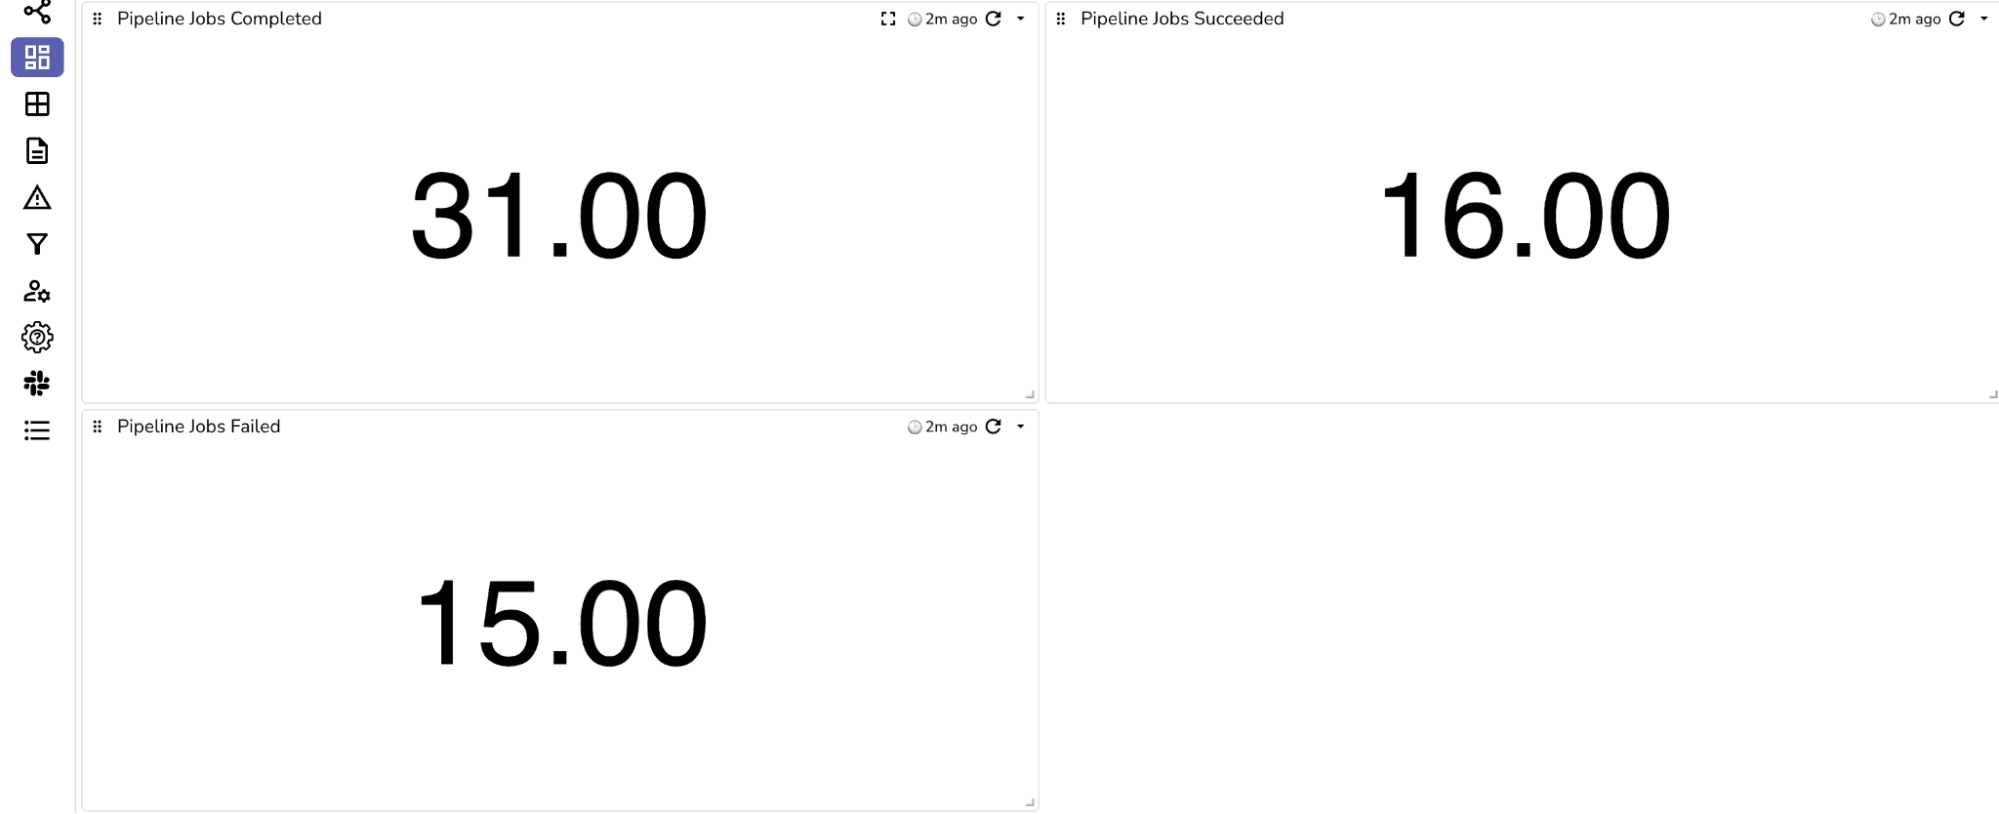
To visualize Jenkins metrics efficiently, import a pre-configured dashboard JSON file for Jenkins monitoring. This JSON file, available for download here, includes panels for key metrics like pipeline duration, test results, and errors.
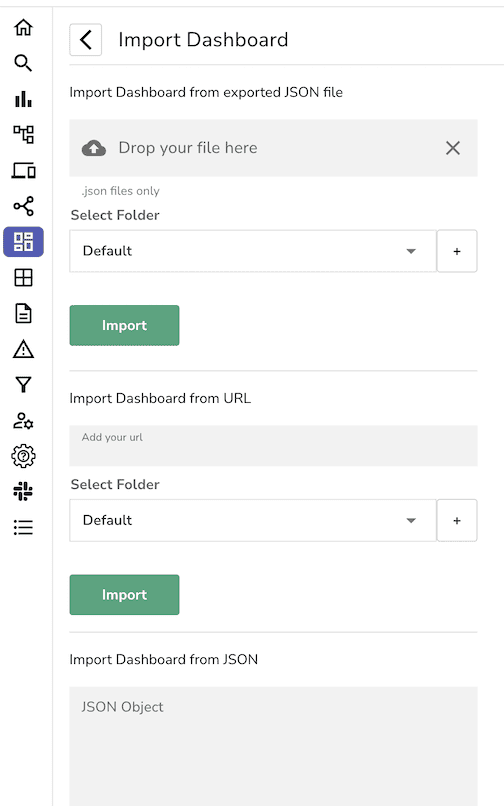
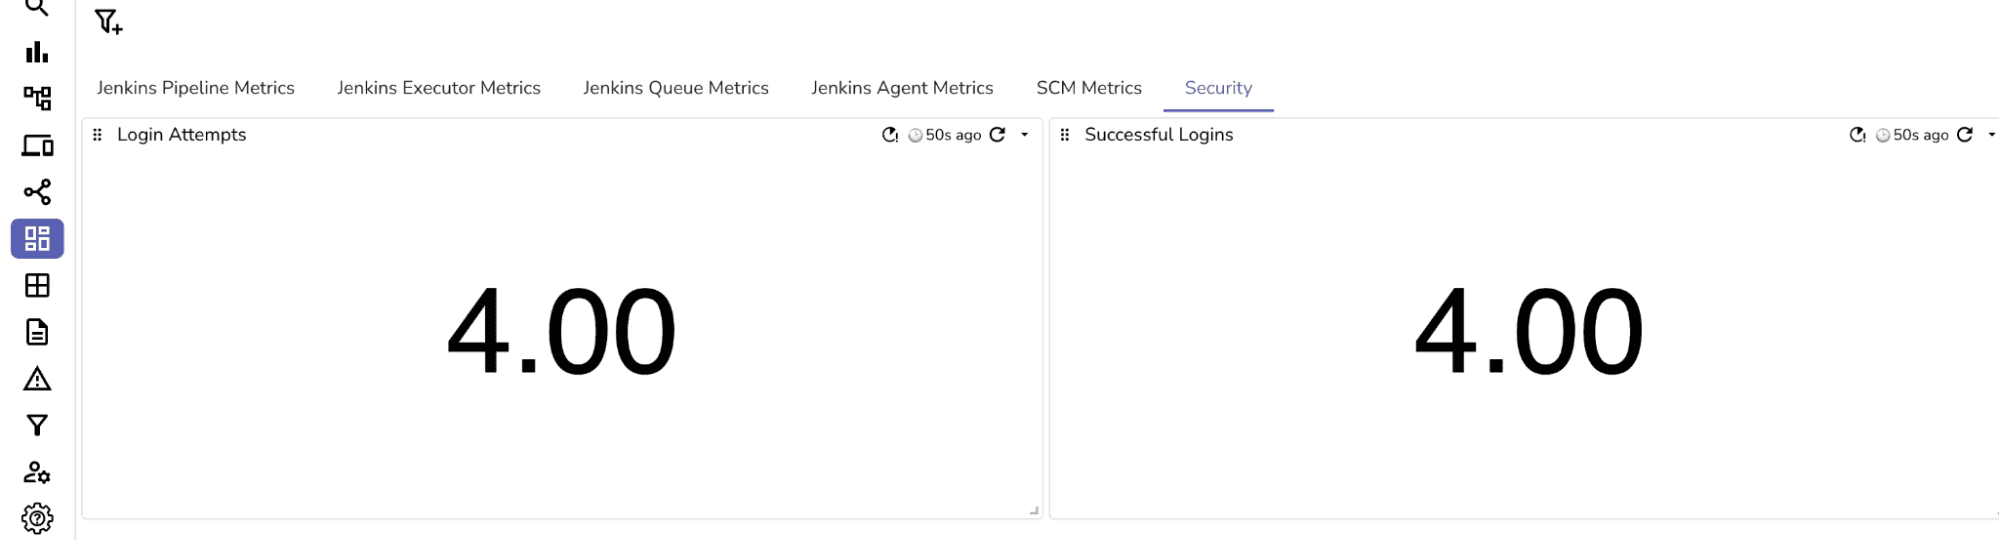
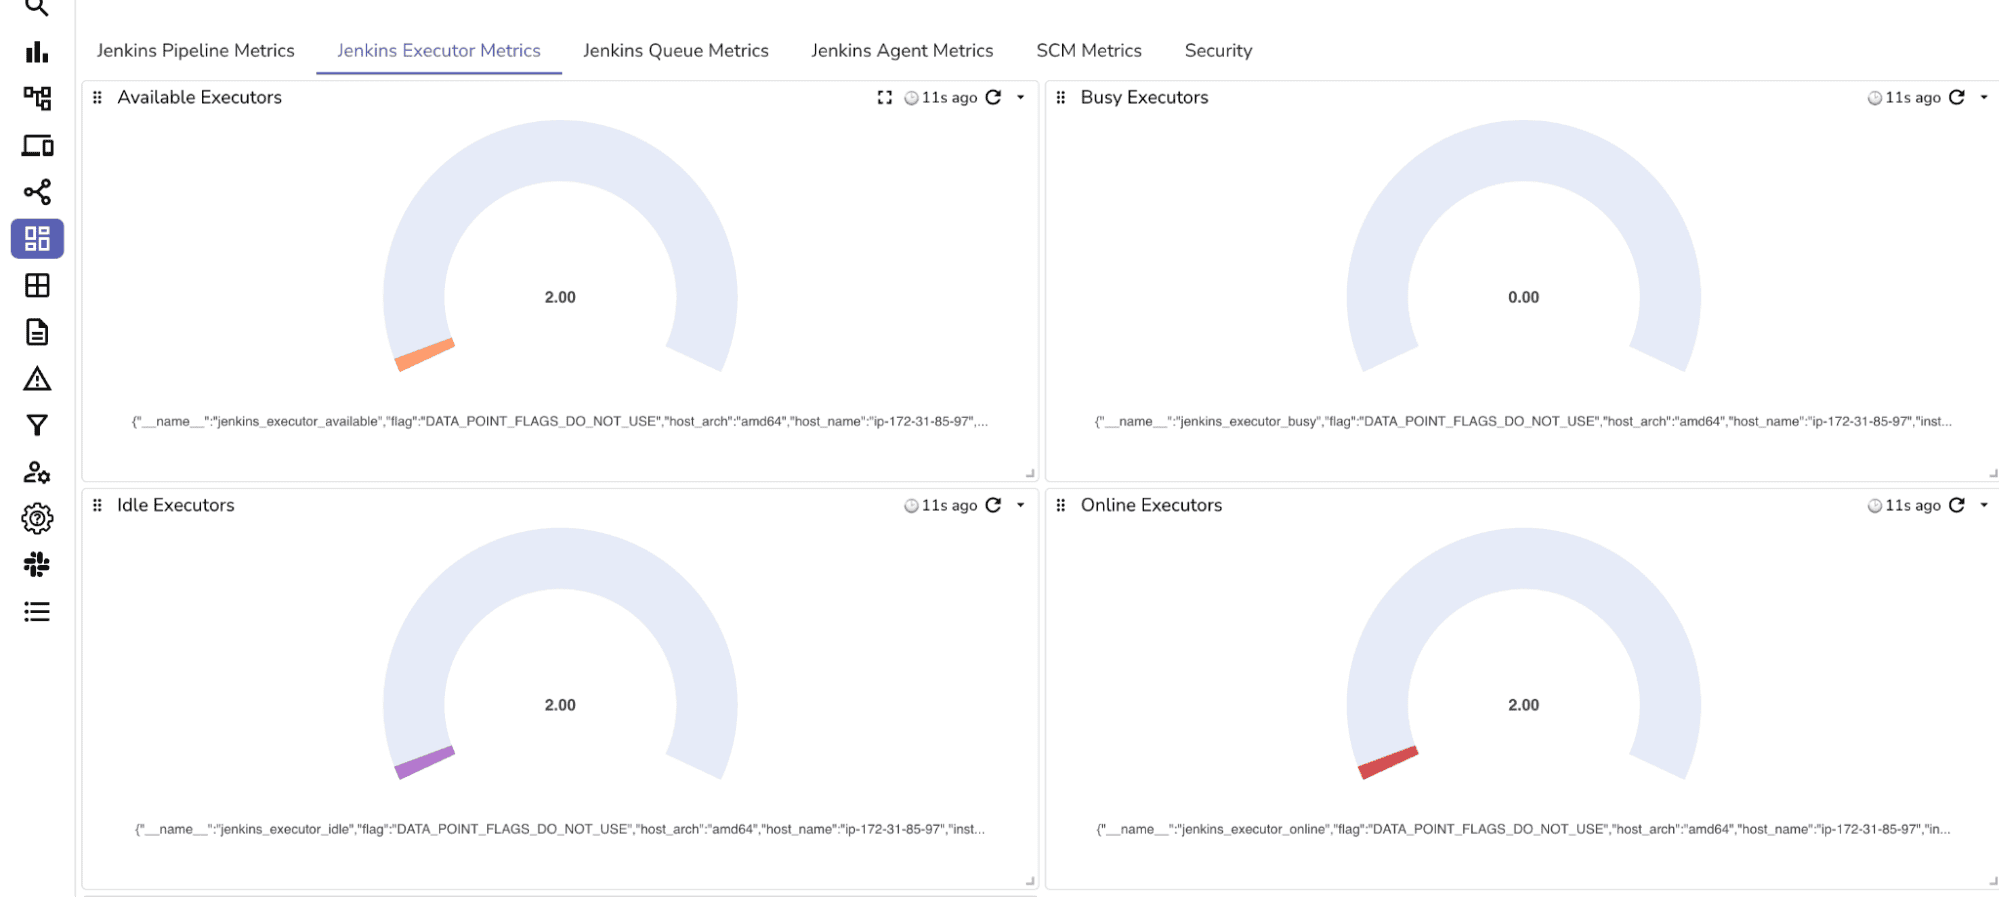
This dashboard offers a complete view of Jenkins pipeline activity, making it easy to monitor builds and troubleshoot issues.
With OpenObserve URLs configured as your Custom Observability Backend in Jenkins, you can easily view logs and metrics by simply clicking on the observability link provided in the job panel. This feature allows anyone monitoring the Jenkins job to quickly access logs and traces directly in OpenObserve without navigating away from the Jenkins interface.
With the OpenTelemetry and OpenObserve integration, you gain several key benefits:
Setting up Jenkins with OpenTelemetry and OpenObserve gives you a powerful way to monitor your CI/CD pipelines in real-time, making it easier to detect issues and optimize performance. By following this guide, you’ll have a comprehensive observability solution for tracking your Jenkins pipelines, logs, and metrics.
For teams using Jenkins for large-scale builds and deployments, monitoring is essential. OpenTelemetry and OpenObserve together provide a scalable solution to ensure your pipelines are reliable, optimized, and transparent.
Sign up for OpenObserve to track logs, metrics, and traces across your pipelines with ease.
Chaitanya Sistla is a Principal Solutions Architect with 17X certifications across Cloud, Data, DevOps, and Cybersecurity. Leveraging extensive startup experience and a focus on MLOps, Chaitanya excels at designing scalable, innovative solutions that drive operational excellence and business transformation.


