Monitor Your SQL Server Performance with OpenTelemetry and OpenObserve

Manas Sharma
December 23, 2024
6 min read
Don’t forget to share!
Try OpenObserve Cloud today for more efficient and performant observability.
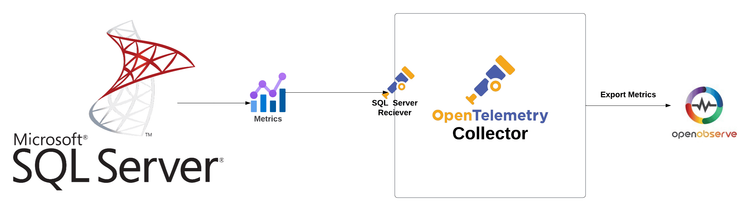
Are you ready to take your SQL Server monitoring to the next level? In this blog, we’ll explore how to leverage OpenTelemetry and OpenObserve to effectively monitor your Microsoft SQL Server instance. By utilizing the SQL Server receiver of the OpenTelemetry Collector, you can seamlessly scrape metrics and gain insights into the performance and health of your database.
Microsoft SQL Server is a robust relational database management system that supports a wide range of data storage and retrieval needs. Known for its reliability, scalability, and security features, SQL Server is widely used in enterprise environments. Whether you’re managing transactional data, analytics, or reporting, monitoring your SQL Server instance is crucial for maintaining optimal performance.
To get started, check out our detailed YouTube tutorial that covers:
The SQL Server receiver in the OpenTelemetry Collector retrieves performance metrics by either utilizing Windows Performance Counters or by directly connecting to the SQL Server instance and executing queries. This flexibility allows you to monitor your database effectively, regardless of your deployment environment.
Tip: If you're using Windows, ensure that the SQL Server instance is configured to allow remote connections for the OpenTelemetry Collector to access it.
When implementing SQL Server monitoring, consider focusing on the following key metrics:
Before we begin, ensure you have:
Important Note: Ensure that your SQL Server instance is configured to allow the necessary permissions for the user account you will use for monitoring.
Ensure your SQL Server instance is running and accessible. If you're using a named instance, you’ll need to specify the instance name in your configuration.
Tip: Use SQL Server Management Studio (SSMS) to verify that your SQL Server instance is running and to check the connection settings.
Next, we need to install the OpenTelemetry Collector.
NOTE: The default Otel Collector doesn't have all the receivers, including the SQL receiver one we are going to use to collect data from the DB. It has support for receivers like Kafka, Prometheus, Jaeger, etc. So, instead of using opentelemetry-collector, we are going to use opentelemetry-collector-contrib.
Visit the OpenTelemetry Collector Contrib Releases page.
Download the latest release for your machine. You can use the following command in your terminal, replacing X.Y.Z with the latest version number:
curl --proto '=https' --tlsv1.2 -fOL https://github.com/open-telemetry/opentelemetry-collector-releases/releases/download/v0.115.1/otelcol-contrib_0.115.1_darwin_arm64.tar.gz
tar -xvf otelcol-contrib_0.115.1_darwin_arm64.tar.gz
sudo mv otelcol-contrib /usr/local/bin/
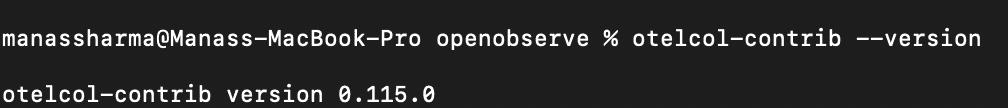
otelcol-contrib --version
Receivers in the OpenTelemetry Collector are responsible for collecting telemetry data from various sources. They act as the entry point for data into the collector, allowing it to gather metrics, logs, and traces from different systems. Each receiver is designed to handle specific types of data and protocols.
Next, you’ll need to create a configuration file named config.yaml. This file defines how the Collector will behave, including what data it will receive, how it will process that data, and where it will send it.
receivers:
  sqlserver:
        collection_interval: 10s
        resource_attributes:
          sqlserver.computer.name:
            enabled: true
          sqlserver.instance.name:
            enabled: true
  sqlserver/1:
        collection_interval: 5s
        username: otel
        password: securepassword
        server: 0.0.0.0
        port: 1433

processors:
  batch:
    send_batch_size: 10000
    send_batch_max_size: 11000
    timeout: 10s

exporters:
  otlphttp/openobserve:
    endpoint: http://localhost:5080/api/default
    headers:
      Authorization: Basic YOUR_AUTH_TOKEN
      stream-name: default

service:
  pipelines:
    metrics:
      receivers: [sqlserver/1]
      processors: [batch]
      exporters: [otlphttp/openobserve]
Receivers: The SQL Server receiver collects metrics from your SQL Server instance. Ensure the username, password, server, and port match your SQL Server configuration.
Processors: The batch processors help manage and optimize data flow to exporters.
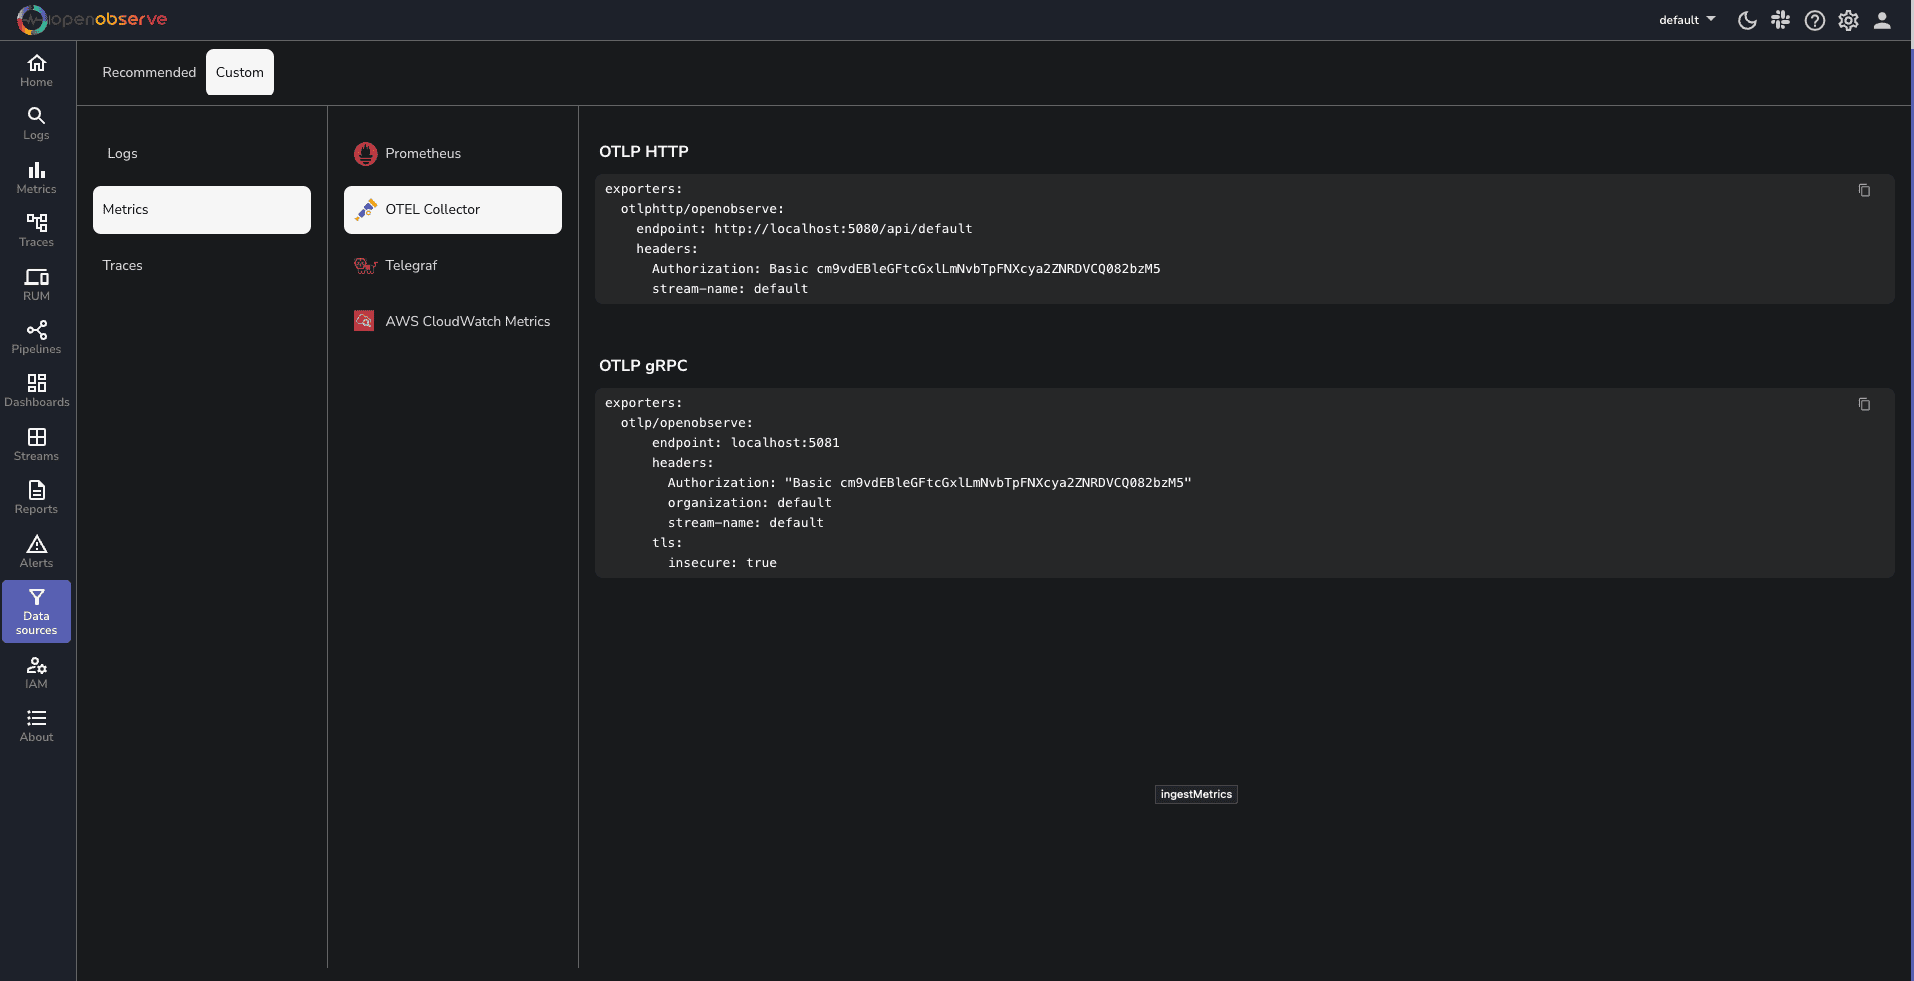
Exporters: The otlphttp/openobserve exporter sends the collected telemetry data to OpenObserve. Replace YOUR_API_ENDPOINT and YOUR_AUTH_TOKEN with your actual OpenObserve API endpoint and authentication token, which you can find in your Data Sources -> Custom - > Metrics -> Otel Collector
To run the OpenTelemetry Collector with the specified configuration, execute the following command in your terminal:
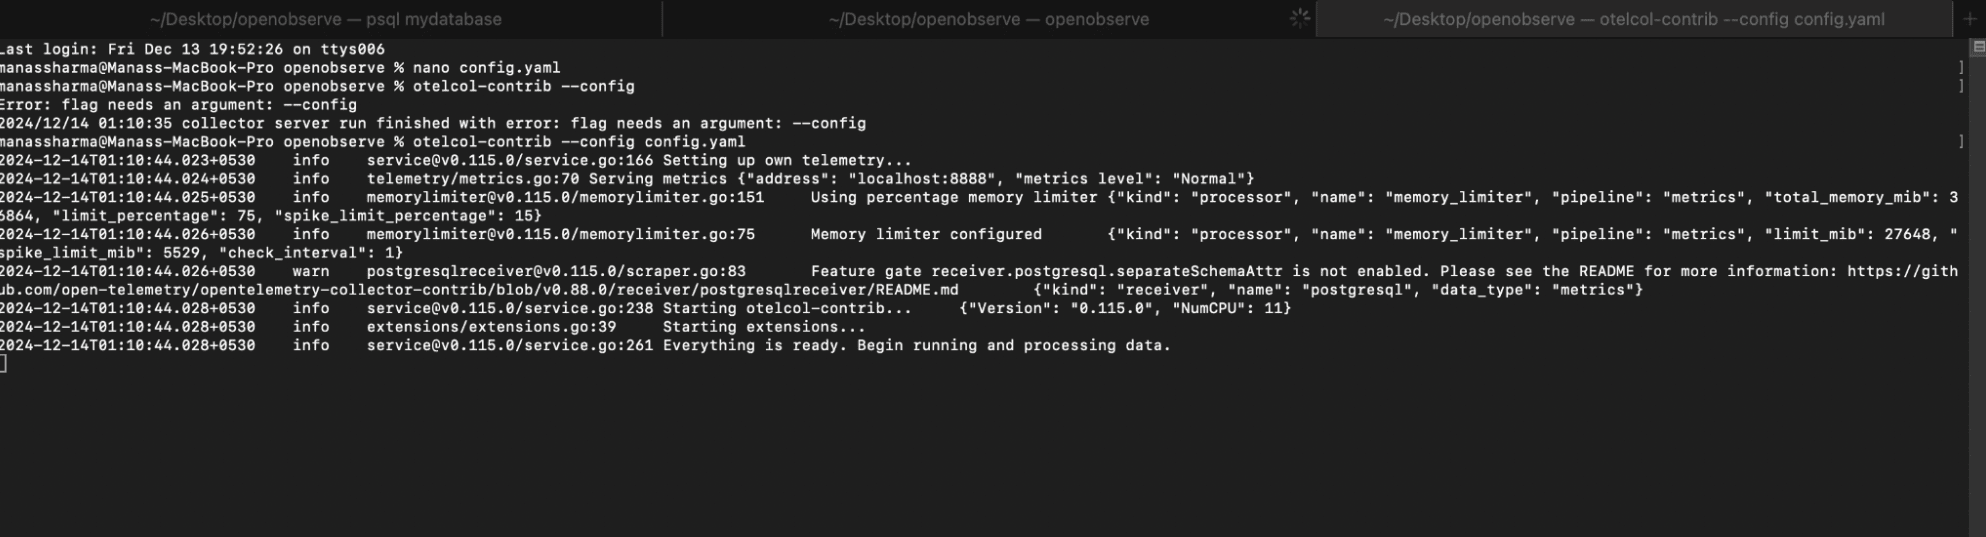
otelcol-contrib --config /path/to/your/config.yaml
Replace /path/to/your/config.yaml with the actual path to your configuration file.
You will get a Output similar to this Screenshot
Once your setup is complete, navigate to the OpenObserve dashboard. Click on the "Streams" button in the sidebar to view the collected data streams.
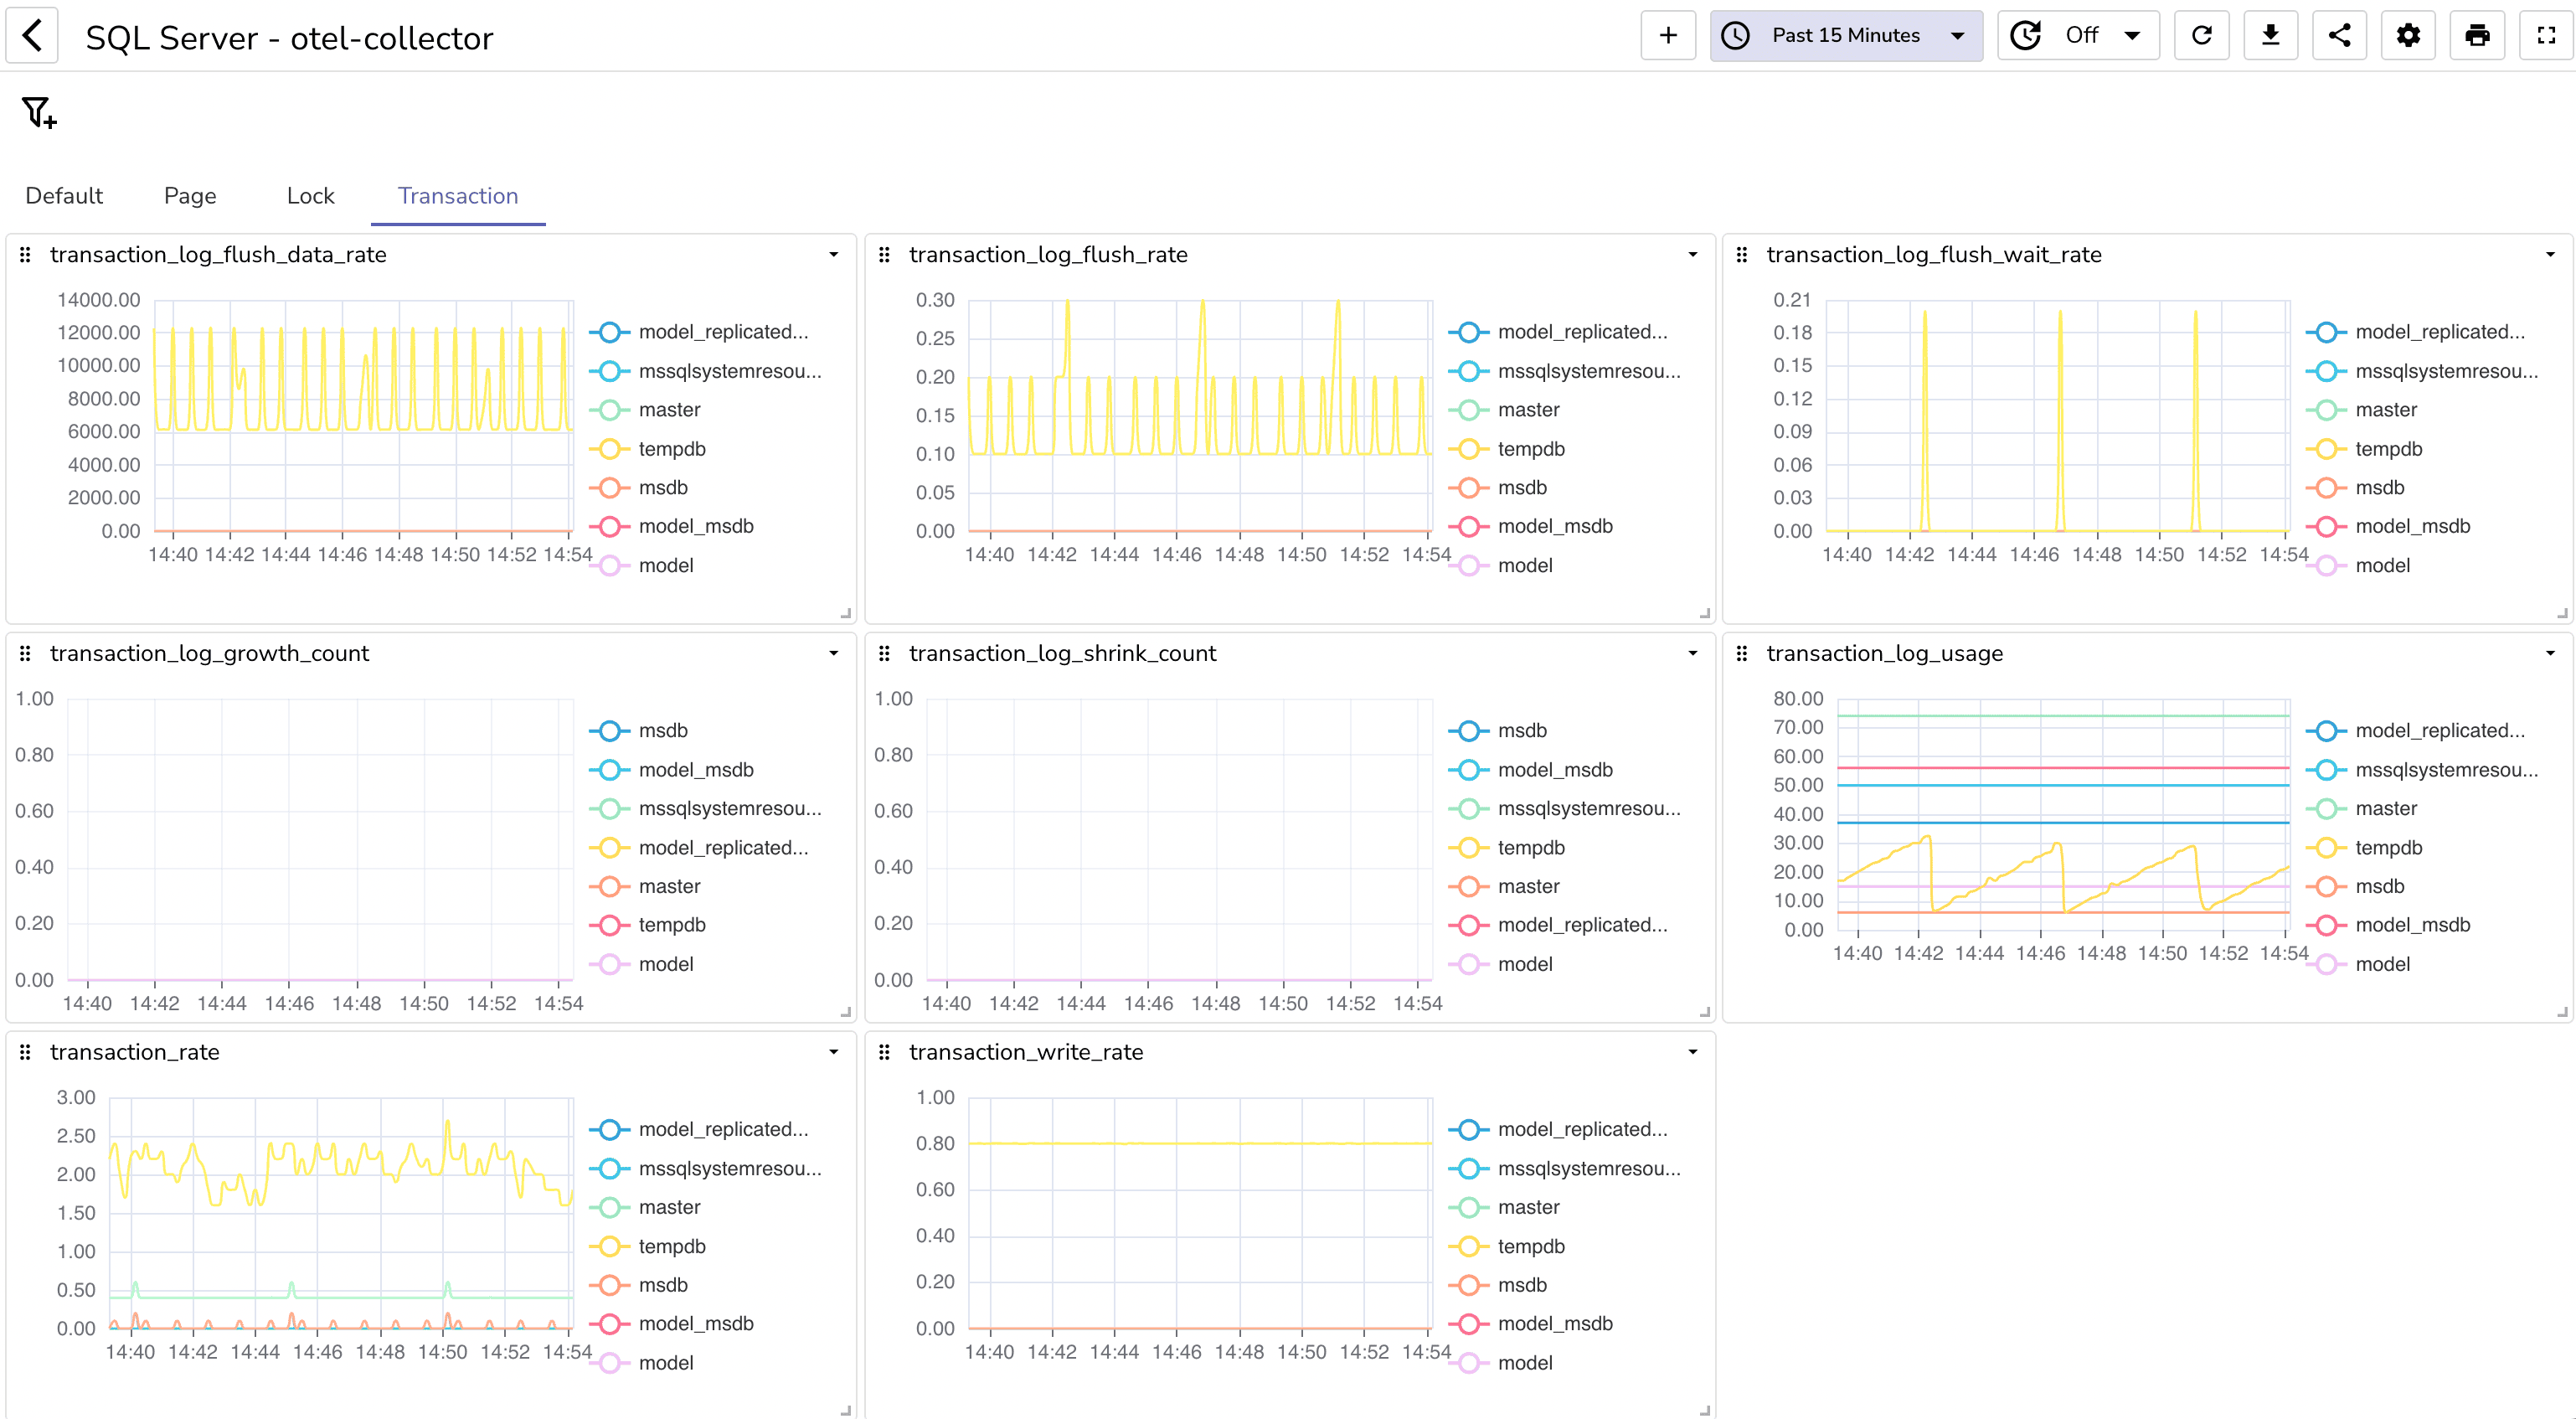
You can download the JSON for this SQL Server monitoring dashboard from here. After downloading, import this dashboard into your O2 instance, and you'll have it up and running within 2 minutes. For detailed steps on importing a dashboard in Openobserve, refer to this Dashboard blog.
If you encounter connection issues during setup, consider the following:
Congratulations! You’ve successfully set up a SQL Server metrics monitoring system using OpenTelemetry and OpenObserve. This powerful combination allows you to gain valuable insights into your SQL Server performance, enabling you to make informed decisions to optimize your applications.
Happy monitoring! 🚀
For more information and detailed documentation, check out the OpenTelemetry SQL Server Receiver Documentation and the OpenObserve Documentation.
Manas is a passionate Dev and Cloud Advocate with a strong focus on cloud-native technologies, including observability, cloud, kubernetes, and opensource. building bridges between tech and community.


