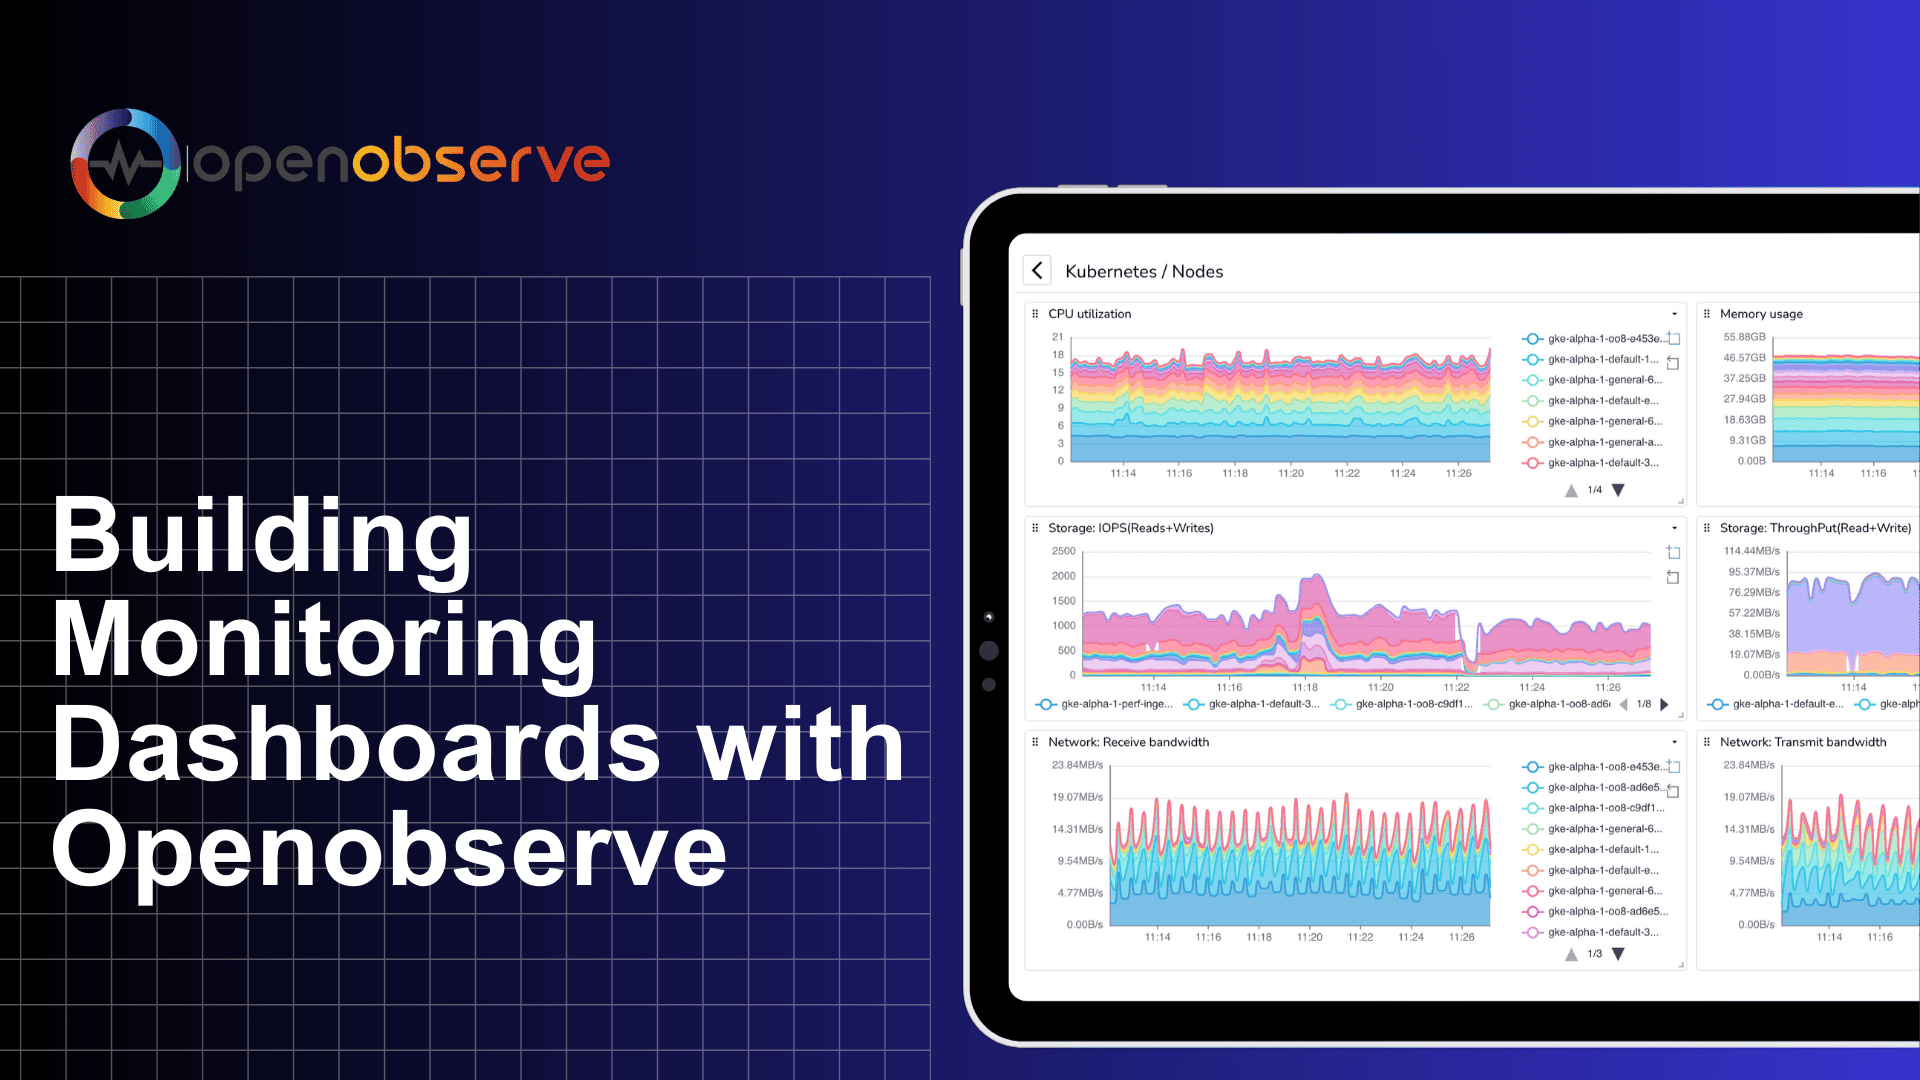
Building Monitoring Dashboards with OpenObserve [Tutorial]

Manas Sharma
October 23, 2024
8 min read
Don’t forget to share!
Try OpenObserve Cloud today for more efficient and performant observability.
Let's face it, building a monitoring dashboard is crucial for keeping track of your application's performance and infrastructure health to deliver a seamless user experience. But, we've all been there—staring at a sea of metrics, struggling to make sense of it all. That's where effective monitoring dashboards come in.
A well-designed dashboard can help you identify potential issues before they become major problems, optimize resource allocation, and make data-driven decisions. But, what makes a dashboard truly effective? And how do you build a monitoring dashboard that provides actionable insights?
OpenObserve: Simplifying Monitoring
Our open-source observability platform makes monitoring simple and intuitive, with:
Follow along with our simple guide below and check out our detailed YouTube tutorial!
In this guide, we'll explore how to build monitoring dashboards in OpenObserve, we'll dive into the key features, best practices, and step-by-step instructions for creating customizable dashboards that meet your specific needs.
Now that you know the highlights, let's move on to creating your first dashboard in OpenObserve!
Using Docker (Recommended for Quick Setup):
If you have Docker installed on your machine, setting up OpenObserve is straightforward. Run the following command in your terminal or command prompt:
Docker images are available at https://gallery.ecr.aws/zinclabs/openobserve
docker run -v $PWD/data:/data -e ZO_DATA_DIR="/data" -p 5080:5080 \
 -e ZO_ROOT_USER_EMAIL="root@example.com" -e ZO_ROOT_USER_PASSWORD="Complexpass#123" \public.ecr.aws/zinclabs/openobserve:latest
Replace root@example.com and Complexpass#123 with your desired credentials.
Once the container is up and running, navigate to http://localhost:5080 and login in your web browser to access the OpenObserve UI.
For more installation options and instructions, refer to our Quickstart Documentation.
Let's start by loading sample data into OpenObserve. This will allow you to quickly experience all the Dashboard features without needing to set up custom data sources, making it easy to dive into building and visualizing dashboards.
Ensure you have curl installed on your system before running these commands.
Use the following command to download real-life log data:
curl -L https://zinc-public-data.s3.us-west-2.amazonaws.com/zinc-enl/sample-k8s-logs/k8slog_json.json.zip -o k8slog_json.json.zip
Unzip the downloaded file:
unzip k8slog_json.json.zip
To ingest this data into OpenObserve, use:
curl http://localhost:5080/api/default/default/_json -i -u "root@example.com:Complexpass#123" -d "@k8slog_json.json"
Note: The process is similar for cloud service, simply replace the URL and credentials accordingly.
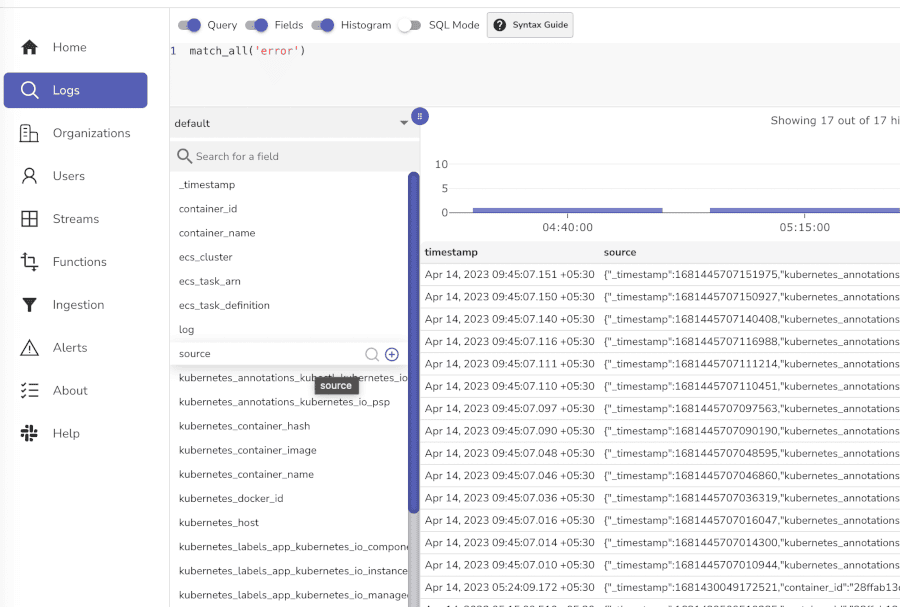
Tip: Use the search bar to quickly find specific log entries or patterns.
Navigate to the Dashboards section in OpenObserve's left-side menu.
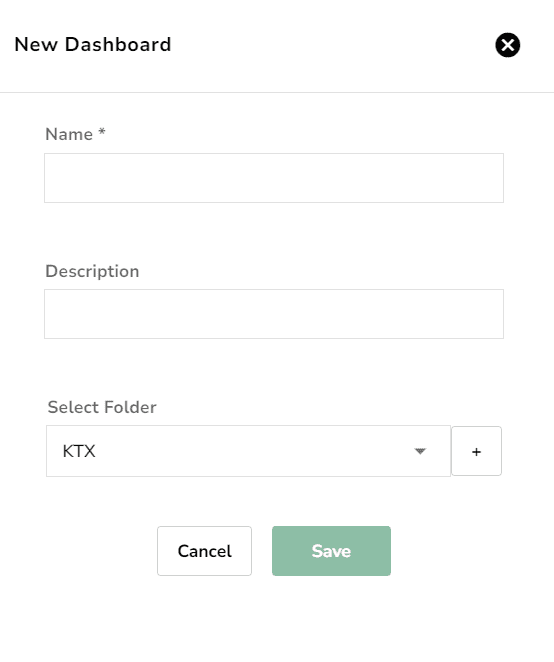
Click New Dashboard and provide a name, description, and choose a folder.
Tip: Use descriptive names for your dashboards to easily identify them later.
Click Add Panel on the empty dashboard.
Select the stream type to Logs and select a data stream.
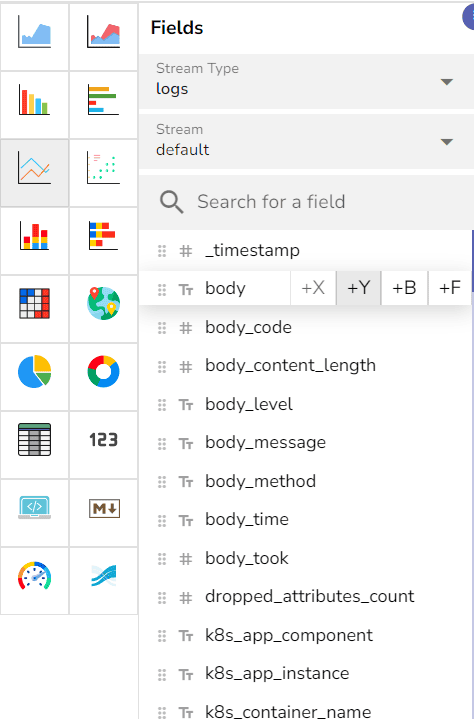
stream_name, body).Panel 1:
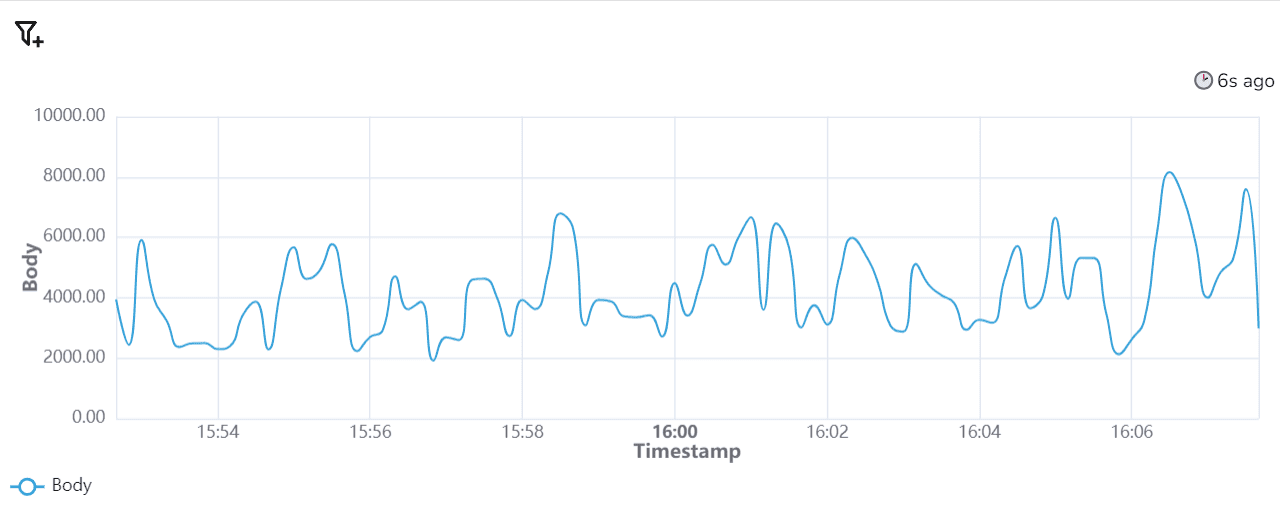 Chart Type: Line Chart (for time-series data)
Panel 2:
Repeat the panel configuration steps as needed.
Click Apply and preview.
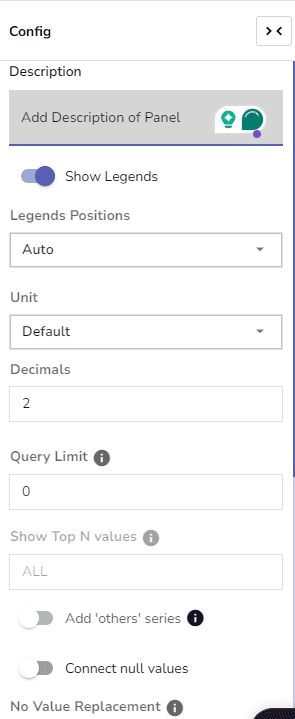
For those who love customization, the Config Panel is your best friend! This powerful configuration tool ensures that every panel displays the data exactly how you need it.
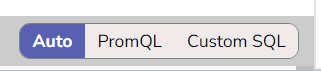
Auto Mode is the easiest way to create panels. It allows you to:
Auto Mode is perfect for beginners or when you need quick insights without complex queries.
Use Custom Queries for more control and flexibility. Here are some scenarios where Custom Query Mode is useful:
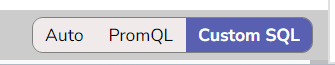
Advanced Aggregations: If you need specialized aggregations beyond basic counts or averages.
Complex Filters: For advanced conditions like AND/OR combinations.
SQL Functions: Use SQL functions for custom data manipulation. See the documentation for a list of available functions.
For metrics, OpenObserve supports PromQL. PromQL is a powerful tool for querying time-series data. Here are some examples:
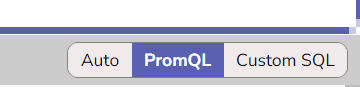
up{job="node-exporter"}.rate(http_requests_total{job="web server"}[5m]).sum(cpu_usage{instance="example-server"}).rate(http_requests_total{job="web server"}[5m]) * 100.PromQL is ideal for detailed metrics analysis, giving you full control over your data.
Tip: Auto Mode works well for most use cases, while Custom Queries and PromQL provide more advanced options when needed.
When you build monitoring dashboards, dynamic filtering with variables can streamline your monitoring setup, reducing the need for multiple dashboards and improving load times.
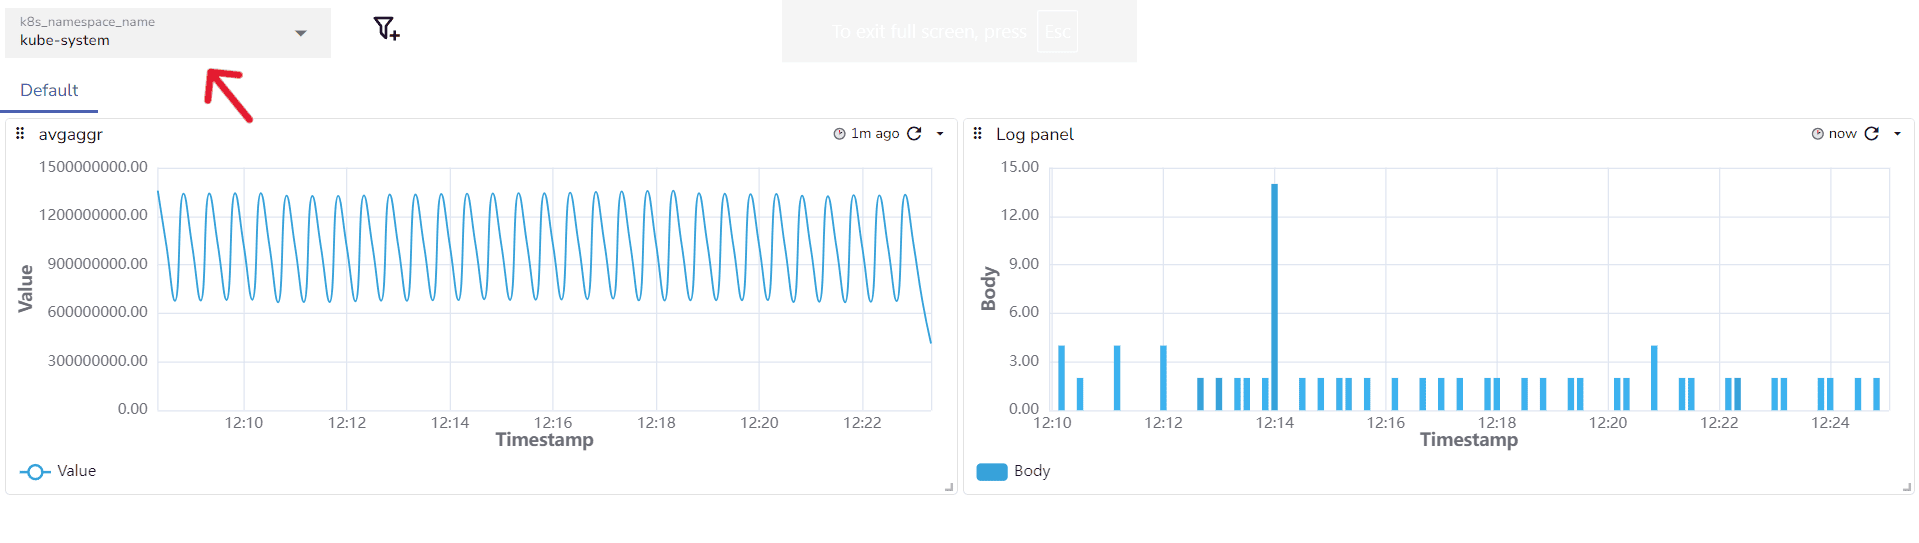
Practical Use Case: Multiple Kubernetes Namespaces
When monitoring multiple Kubernetes namespaces, creating separate dashboards can be inefficient. Instead of creating a separate dashboard for each namespace, you can create a variable called namespace. This variable can then be used across all panels with a filter, such as $namespace .
How It Works:
Add the namespace variable to your panels.
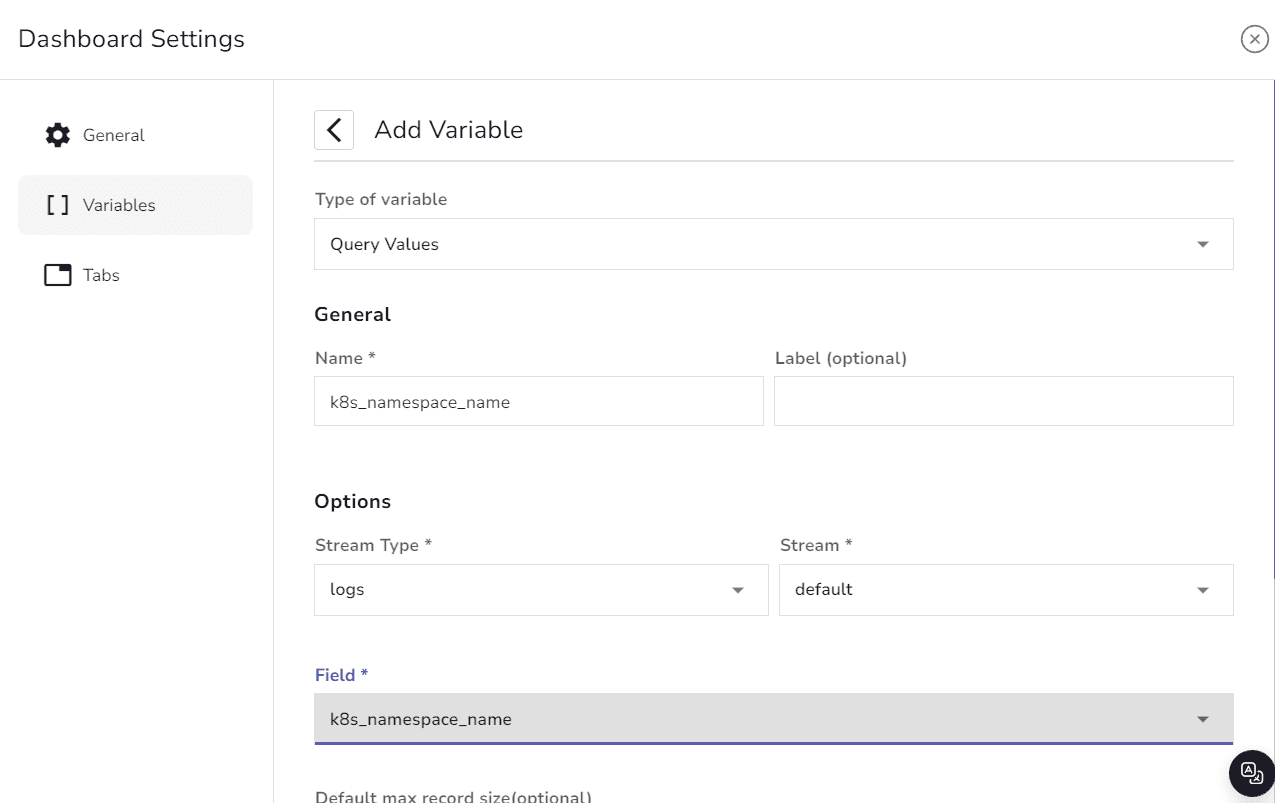
Use it in your queries to filter the displayed data dynamically.
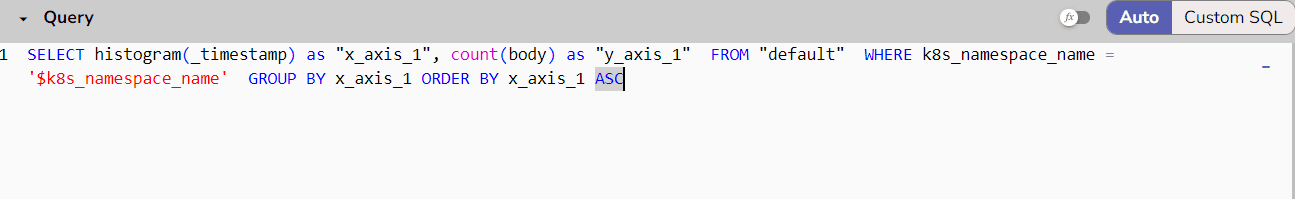
With just one dashboard, you can select any Kubernetes namespace and instantly load its relevant data.
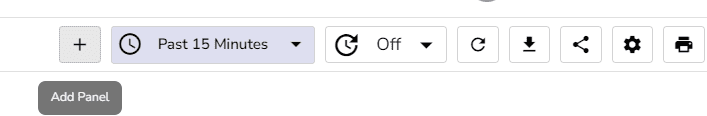
Once you've arranged all the panels to your satisfaction, click Save Dashboard.
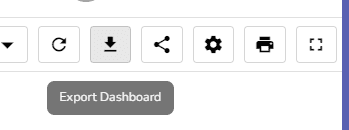
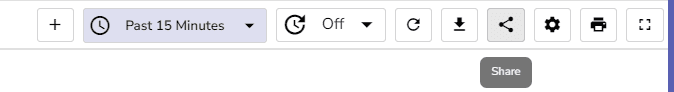
Export: Click Export to save the dashboard as a JSON file for sharing or backup purposes.
Share: Copy and share the link with colleagues.
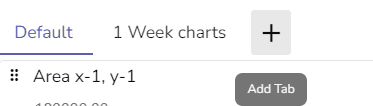
Note: Create tabs for CPU, Memory if you want to add additional related metrics without cluttering the main view.
If you're short on time, you can take advantage of prebuilt monitoring dashboards available for OpenObserve. These templates provide a quick way to build a monitoring dashboard tailored to specific needs, and you can customize them further to match your infrastructure
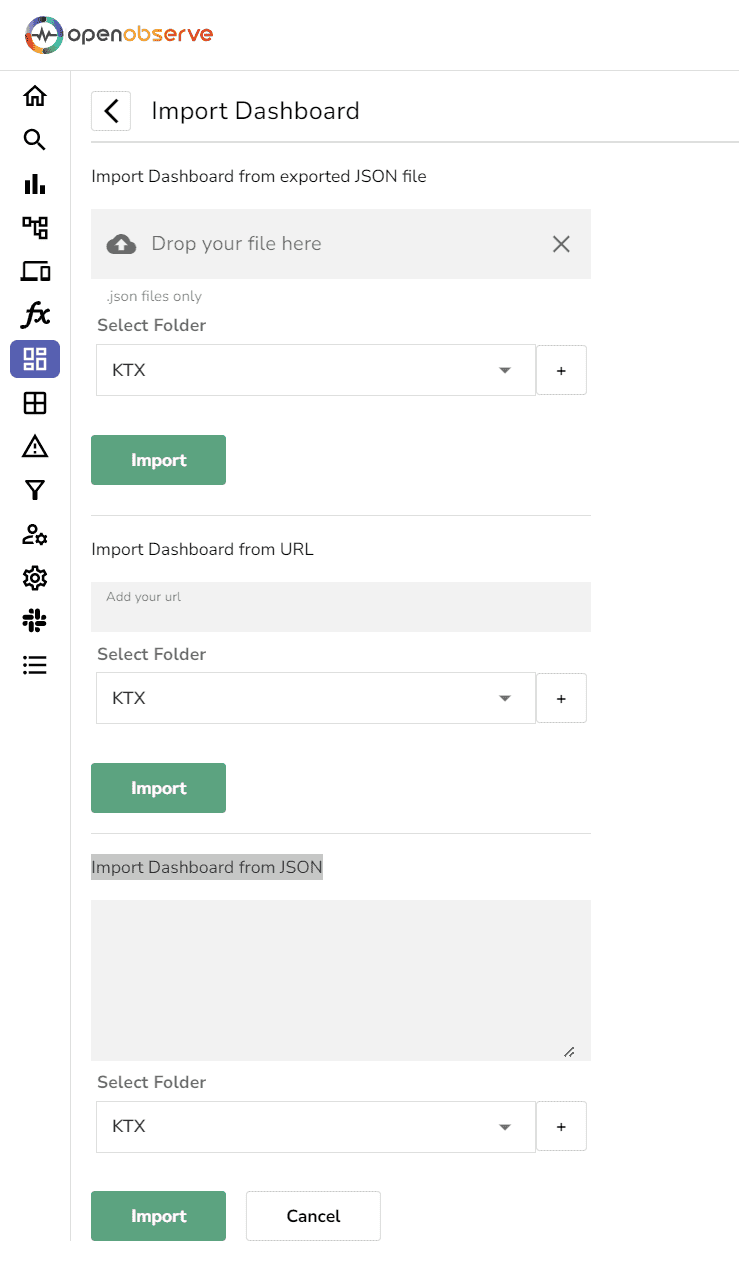
Follow these easy steps to import a prebuilt dashboard into OpenObserve:
Download the Dashboard:
Import the Dashboard:
Tip: Prebuilt dashboards are an excellent starting point, but don't hesitate to customize them. Tailor them to match your infrastructure and monitoring needs by adding specific metrics, changing chart types, or configuring alerts.
Add more filters, and use drill-downs to catch issues early.
Add More Metrics: Add panels for Network Traffic, Disk I/O for a complete view of your cluster.
Set Up Alerts: Configure custom alerts for notifications via email, Slack, or other channels.
Join the Community: Connect with OpenObserve users and contribute your own dashboards to the community repository to help fellow users!
Community Forums:
Start your observability journey today with OpenObserve and transform how you monitor your systems!
Thank you for reading! We hope you found this guide helpful. If you have any questions, feedback, or suggestions, we’d love to hear from you.
Happy Monitoring! 🚀
Manas is a passionate Dev and Cloud Advocate with a strong focus on cloud-native technologies, including observability, cloud, kubernetes, and opensource. building bridges between tech and community.