Monitoring Your FastAPI Application with OpenTelemetry and OpenObserve

Manas Sharma
Updated September 21, 2024
6 min read
Don’t forget to share!
Try OpenObserve Cloud today for more efficient and performant observability.

OpenTelemetry and OpenObserve? Game changers in the observability landscape!
OpenTelemetry, an open-source observability framework, allows developers to collect logs, metrics, and traces in a standardized way. OpenObserve steps in as the perfect partner, offering a user-friendly interface to analyze this telemetry data effectively. It’s like having a magnifying glass to scrutinize the inner workings of your application.
Logging in OpenTelemetry
Logging is not just about recording events; it’s about gaining insights.
OpenTelemetry simplifies logging by integrating with existing logging libraries. This unified approach lets you capture logs, traces, and metrics with consistent metadata, making it easier to correlate data across your application. Imagine tracing a single request from start to finish across various services—that’s the power of OpenTelemetry.
Here's a quick example to get you started:
import logging
from opentelemetry import trace

tracer = trace.get_tracer_provider().get_tracer(__name__)

with tracer.start_as_current_span("demo"):

  current_span = trace.get_current_span()
  current_span.add_event("This is a span event")
  logging.getLogger().error("This is a log message")
Collecting telemetry data is only the first step - the real value lies in the ability to effectively analyze and derive insights from this data. This is where OpenObserve steps in as a powerful solution.
Easy to deploy & Lightweight: Single binary that can run on a laptop or as a container/Kubernetes cluster
User-friendly interface: More intuitive than tools like Grafana
Flexible querying: Supports both SQL and PromQL
Built-in alerting: Eliminates the need for additional setup
Significant cost savings: Up to 140x less storage costs compared to Elasticsearch
Unified data collection with OpenTelemetry? Yes, please!
OpenTelemetry is a versatile tool that allows you to collect logs either directly or via existing log files. You can configure the OpenTelemetry Collector to process these logs and export them to a platform like OpenObserve. This setup ensures that your logs, traces, and metrics are seamlessly integrated, providing a holistic view of your application.
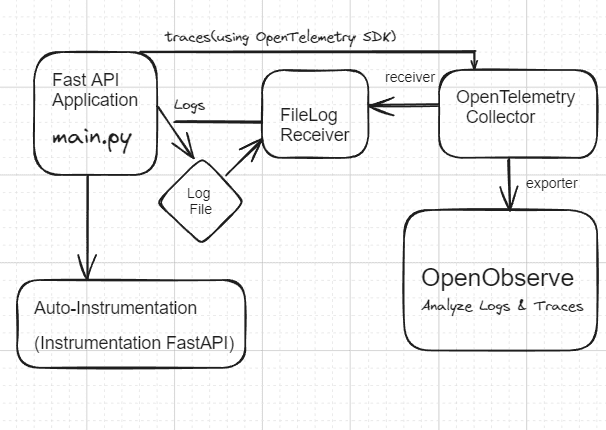 Demo Architecture
For this demo, we will perform all the tasks in a Windows environment. You can also do these in other environment(ubuntu/Mac).
First things first, let’s set up the OpenTelemetry Collector:
opentelemetry-collector-contrib for Windows. Make sure you check that you are using the latest version.cd .\otel-collector\
Invoke-WebRequest -Uri "https://github.com/open-telemetry/opentelemetry-collector-releases/releases/download/v0.107.0/otelcol-contrib_0.107.0_windows_amd64.tar.gz" -OutFile "otelcol-contrib.tar.gz"
tar -xzf otelcol-contrib.tar.gz
Next, we need to configure the OpenTelemetry Collector using a config.yaml file. This file defines how logs are received, processed, and exported. Here's a breakdown of the key components:
filelog: Monitors your application log file.otlp: Supports gRPC and HTTP protocols for receiving traces.batch: Batches log entries for efficient transmission.otlphttp/openobserve: Sends all telemetry data to OpenObserve. To set this up,
log in to OpenObserve, click on the Ingestion button from the sidebar, and
select Custom and then Otel Collector to get the endpoint and the token.config.yamlreceivers:
filelog:
include: path/to/the/file/app.log
otlp:
protocols:
grpc:
http:
processors:
batch:
exporters:
otlphttp/openobserve:
endpoint: `http://localhost:5080/api/default/`
headers:
Authorization: Basic cm9vdEBleGFtcGxlLmNvbTpNM3FCR2tvaFhGNjBjOXFM
stream-name: default
service:
pipelines:
logs:
receivers: [filelog]
processors: [batch]
exporters: [otlphttp/openobserve]
traces:
receivers: [otlp]
processors: [batch]
exporters: [otlphttp/openobserve]
Run this command below in the directory in which opentelemetry-collector-contrib was installed to run the OpenTelemetry Collector:
./otelcol-contrib --config "path/to/file\config.yaml"
You will get an output similar to the screenshot below:
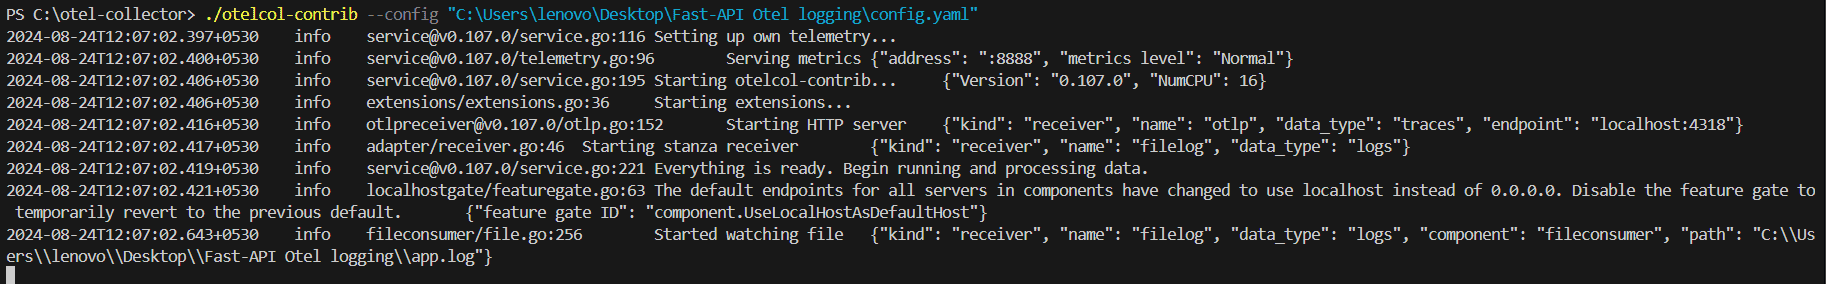
The collector is now up and running, ready to process logs and traces like a pro.
Now, let's get OpenObserve running:
Invoke-WebRequest -Uri "https://github.com/openobserve/openobserve/releases/download/v0.10.7/openobserve-v0.11.0-windows-amd64.zip" -OutFile "openobserve.zip"

Expand-Archive -Path openobserve.zip -DestinationPath .
$env:ZO_ROOT_USER_EMAIL = "root@example.com"
$env:ZO_ROOT_USER_PASSWORD = "Complexpass#123"
.\openobserve.exe
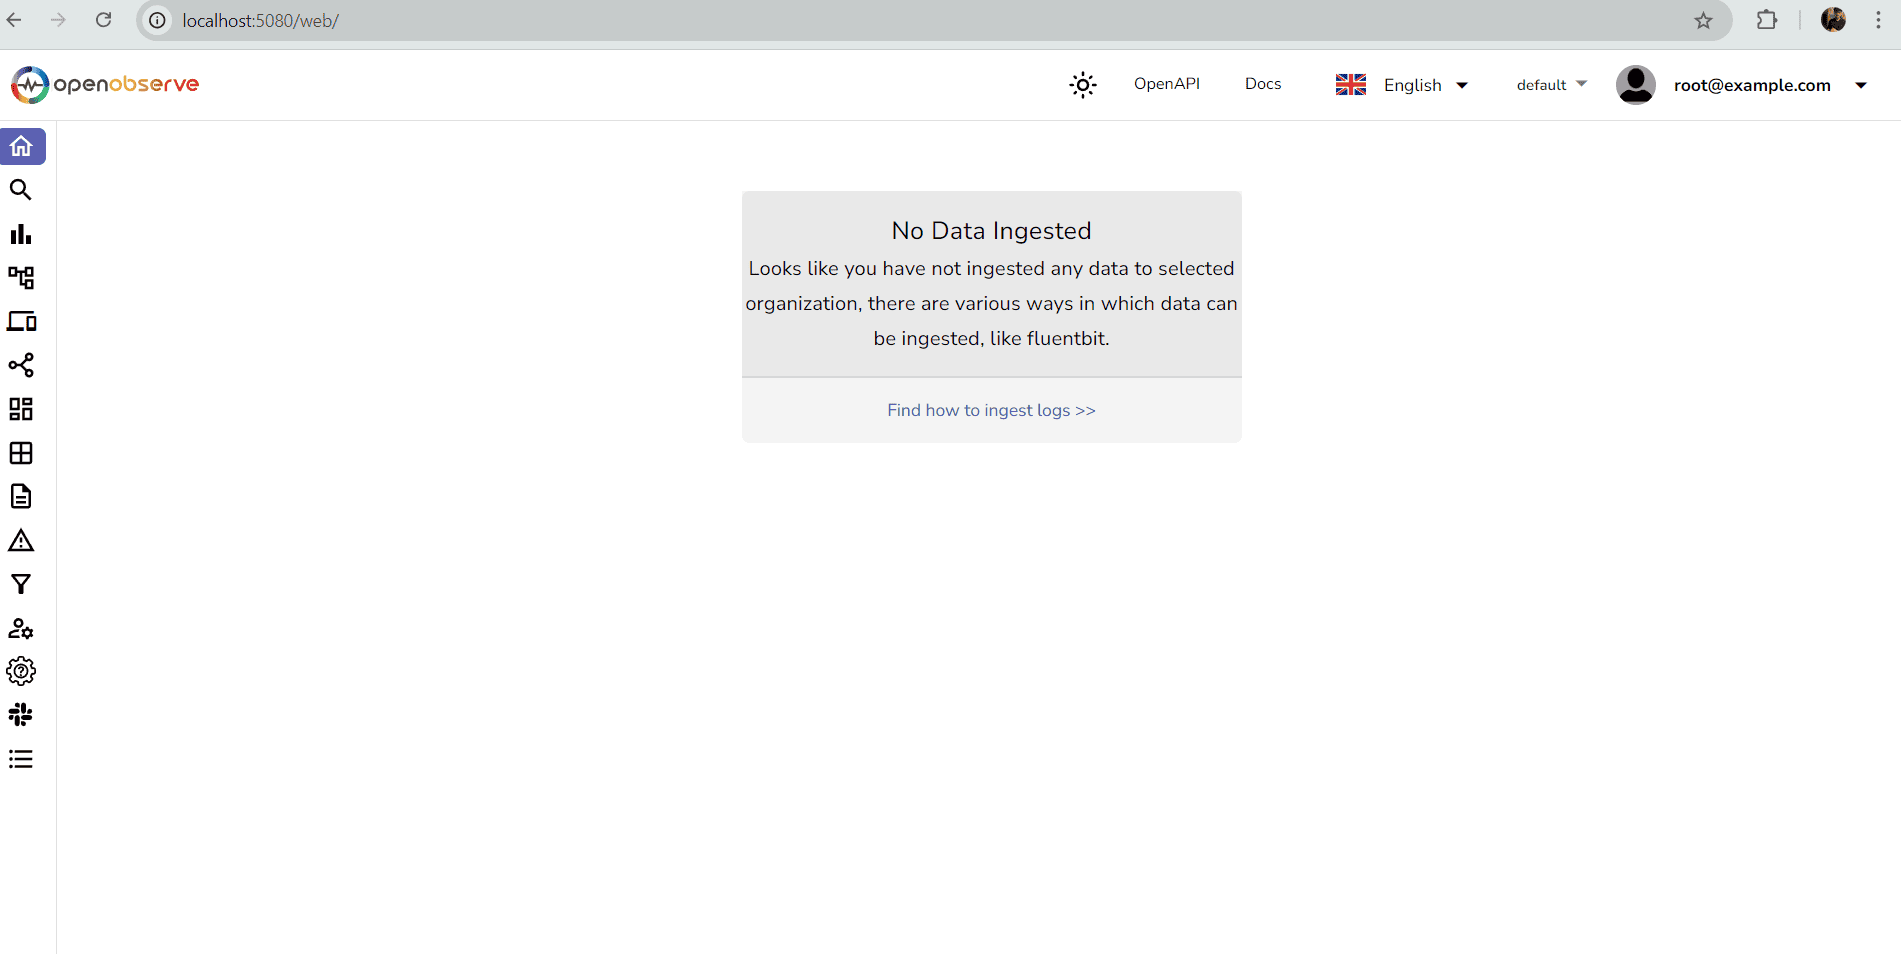
Boom! OpenObserve is live at http://localhost:5080. Time to dive into some data!
Next, we set up a FastAPI application that logs all requests:
main.pyfrom fastapi import FastAPI
from opentelemetry import trace
from opentelemetry.instrumentation.fastapi import FastAPIInstrumentor
from opentelemetry.sdk.trace import TracerProvider
from opentelemetry.sdk.resources import Resource
from opentelemetry.sdk.trace.export import BatchSpanProcessor
from opentelemetry.exporter.otlp.proto.grpc.trace_exporter import OTLPSpanExporter
import logging
resource = Resource(attributes={"service.name": "fastapi-service"})
tracer_provider = TracerProvider(resource=resource)
trace.set_tracer_provider(tracer_provider)
# Set up OTLP exporter for traces
otlp_exporter = OTLPSpanExporter(endpoint="http://localhost:4317", insecure=True)
span_processor = BatchSpanProcessor(otlp_exporter)
tracer_provider.add_span_processor(span_processor)
# Set up logging
logging.basicConfig(
filename='app.log',
filemode='a',
format='%(asctime)s,%(msecs)d %(name)s %(levelname)s %(message)s',
datefmt='%H:%M:%S',
level=logging.DEBUG
)
logger = logging.getLogger(__name__)
app = FastAPI()
# Instrument FastAPI
FastAPIInstrumentor.instrument_app(app)
@app.get("/")
async def root():
logger.info("Root endpoint accessed")
return {"message": "Hello World"}
@app.get("/items/{item_id}")
async def read_item(item_id: int):
logger.info(f"Item details requested for item_id: {item_id}")
return {"item_id": item_id}
Run your FastAPI application:
uvicorn main:app --reload
Your API is now up and running, ready to log and trace every request!
Let’s put everything to the test!
Test Your API:
curl http://localhost:8000/
curl http://localhost:8000/items/45
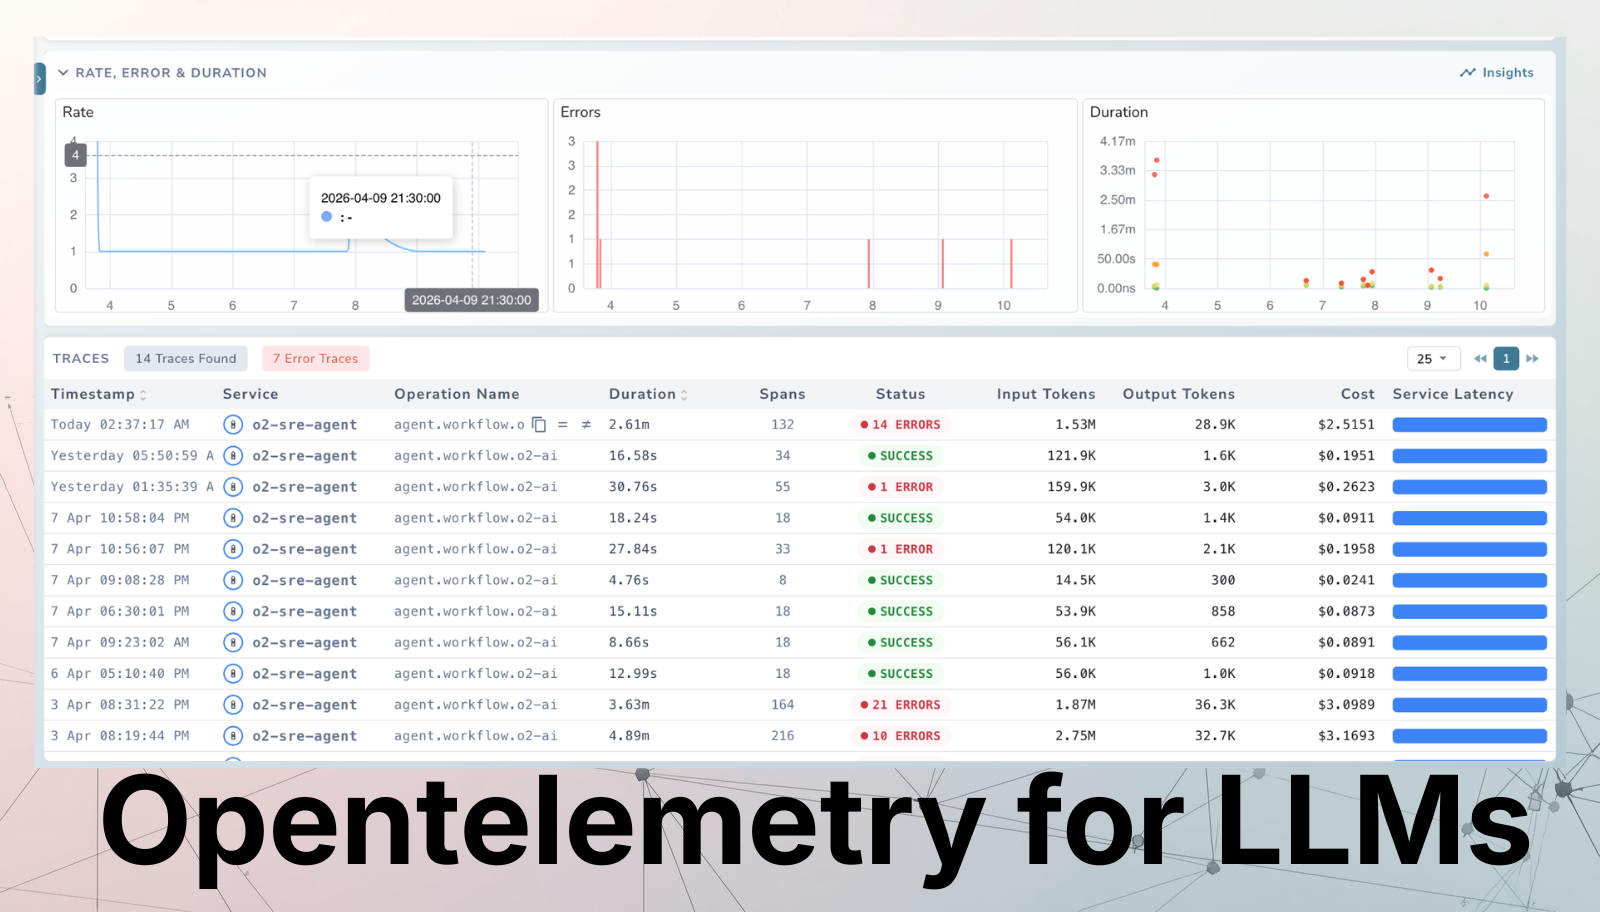
Head over to http://localhost:5080 and explore your logs. You can filter, search, and dive deep into the data to see how your application is performing.
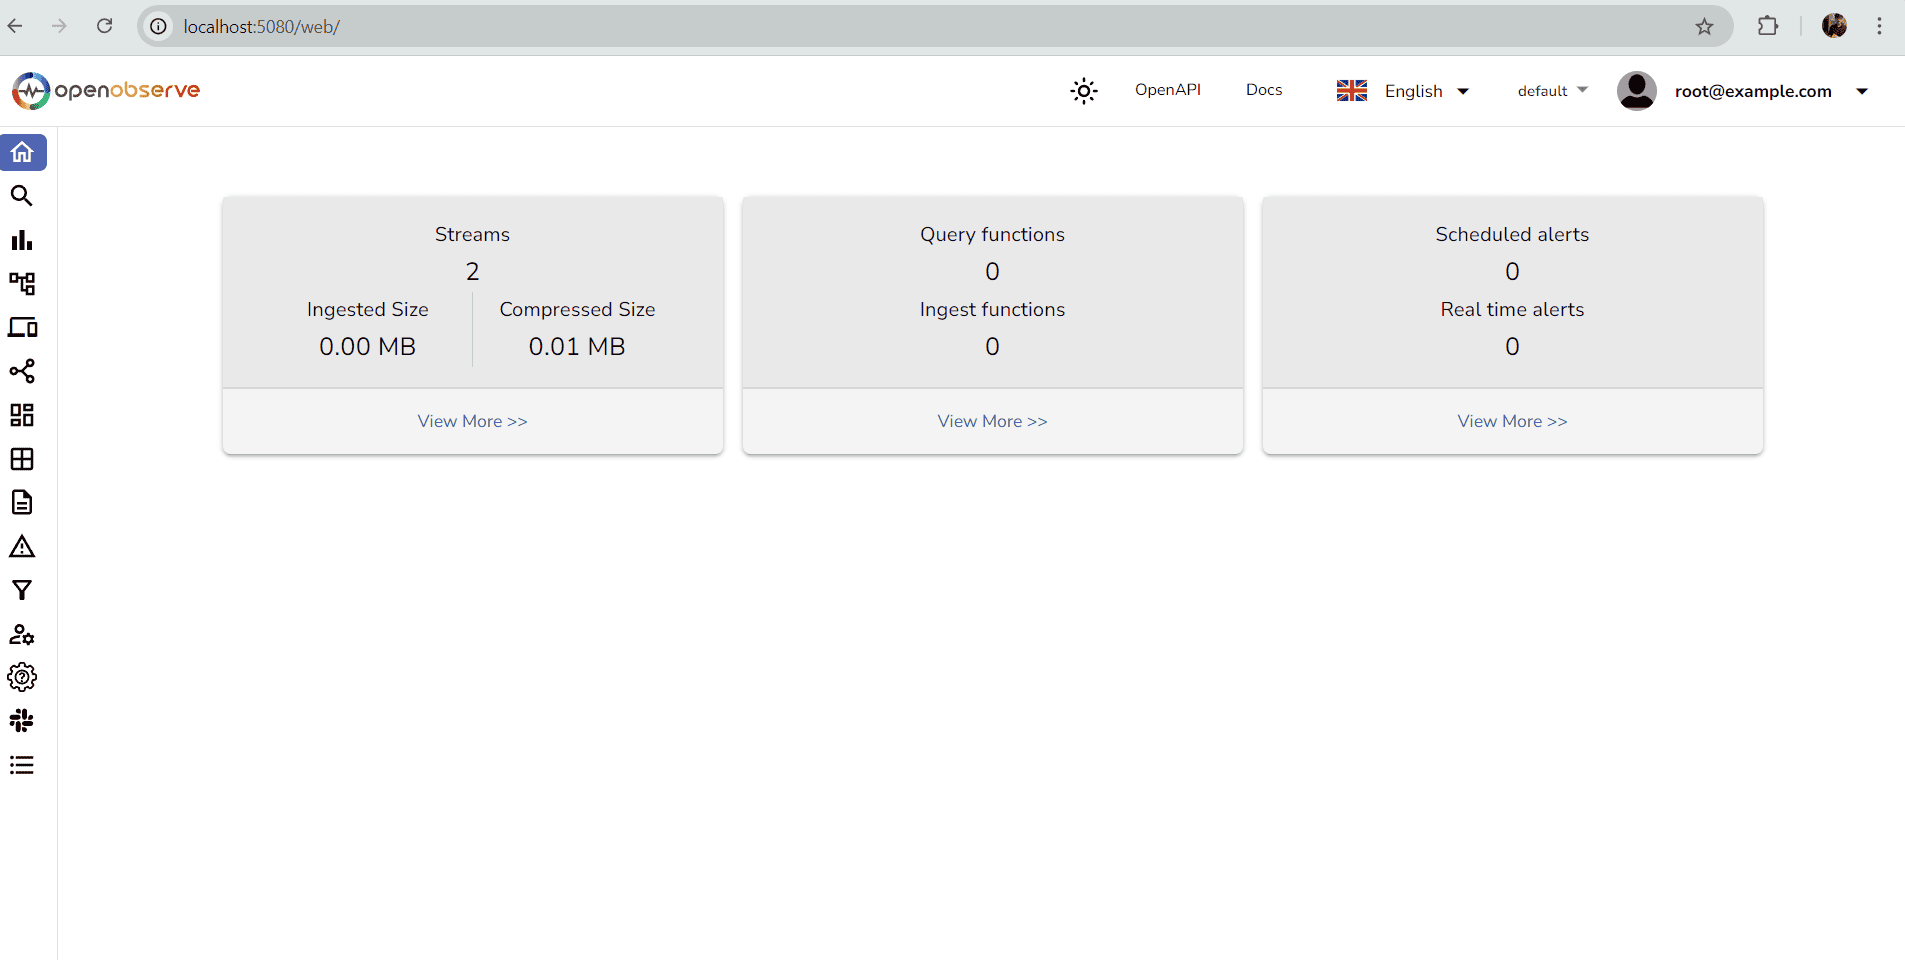 OpenObserve Dashboard
 Logs-Spans
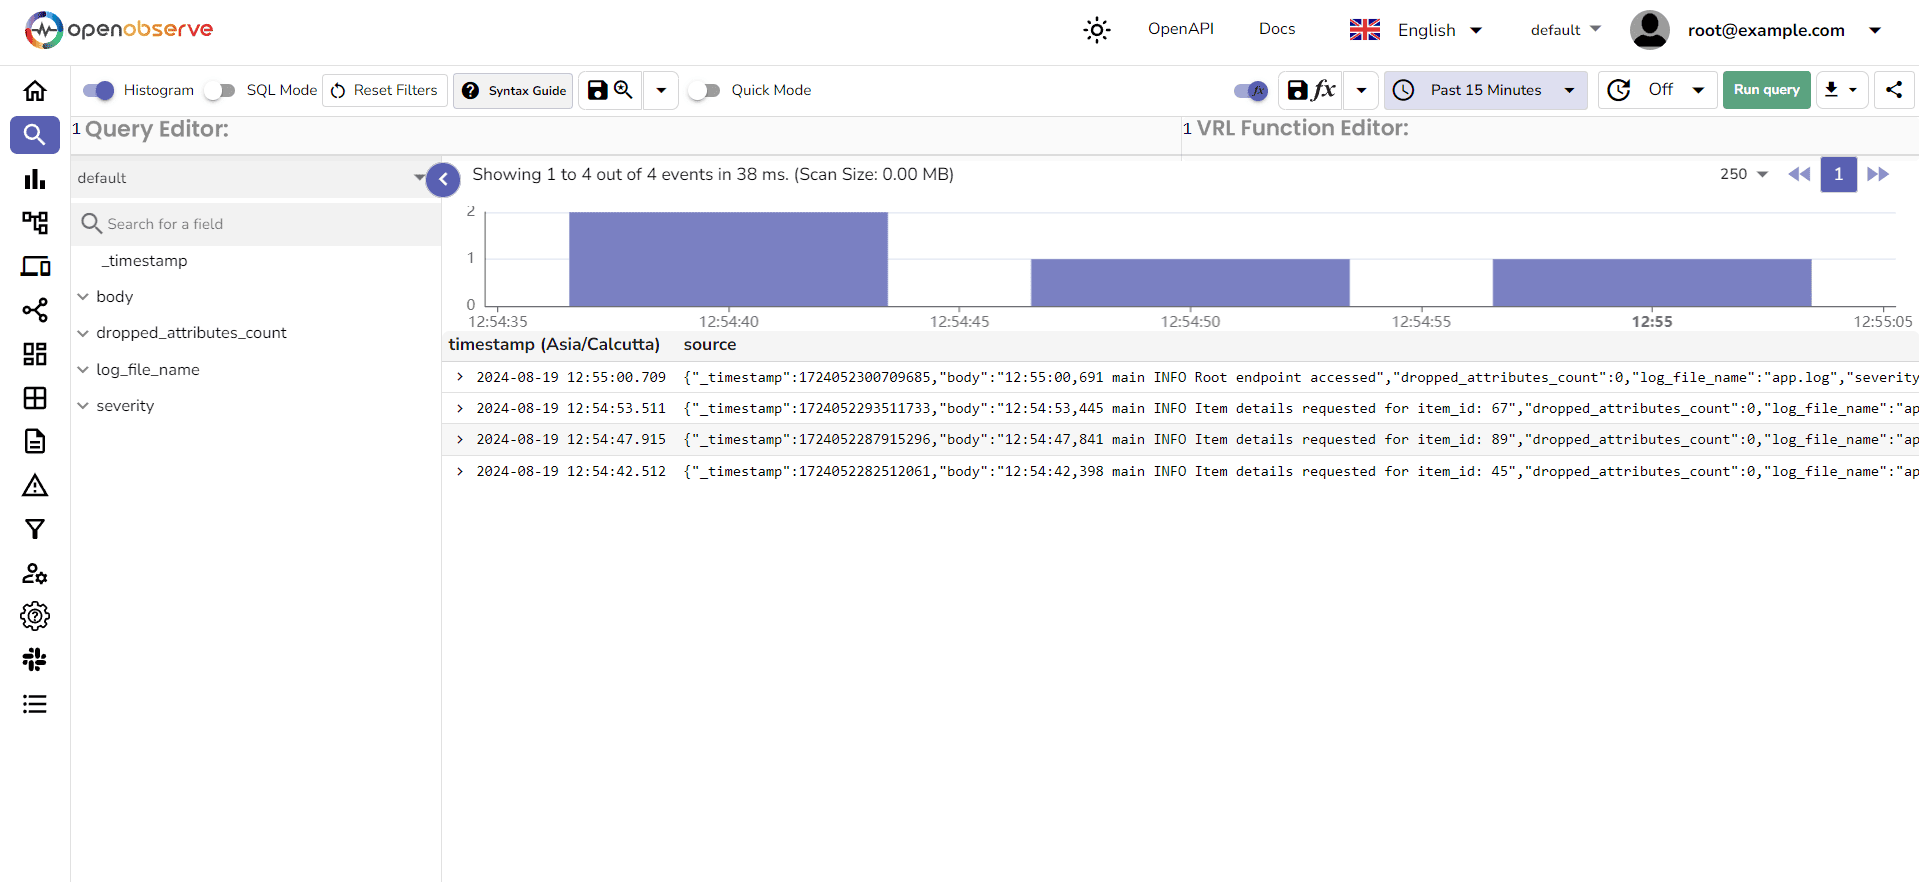
Detailed view of Logs and Traces in OpenObserve:
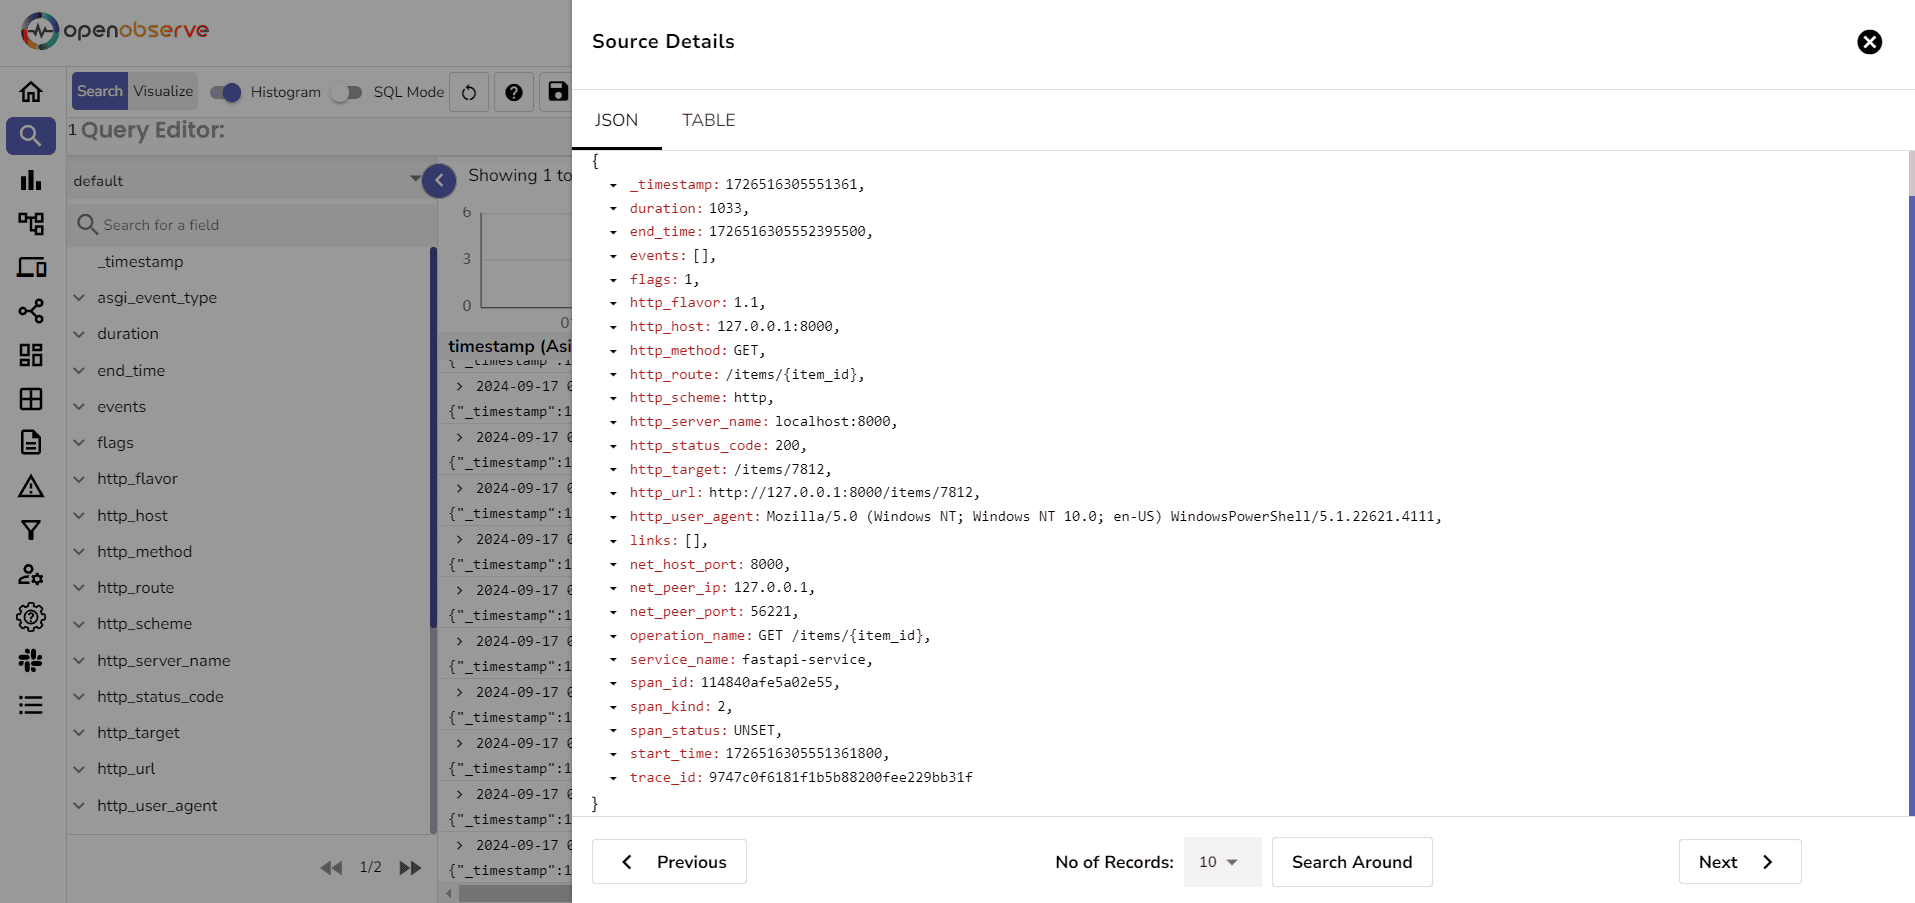 Logs
Logs
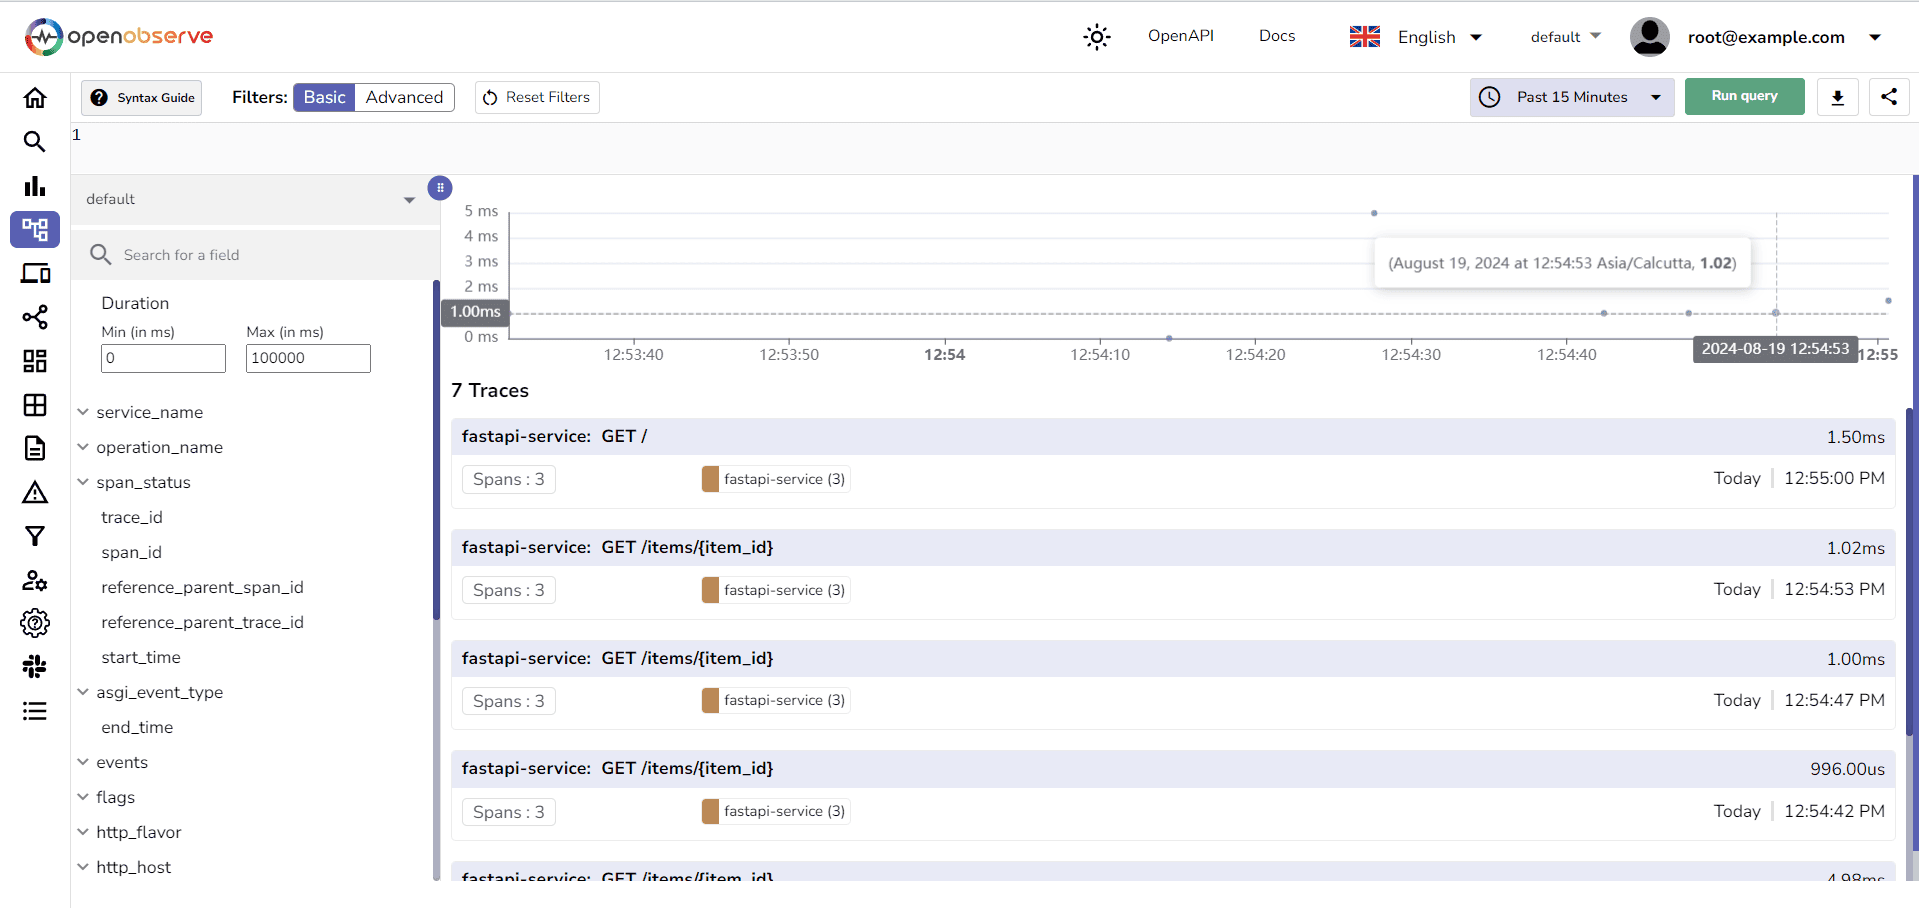
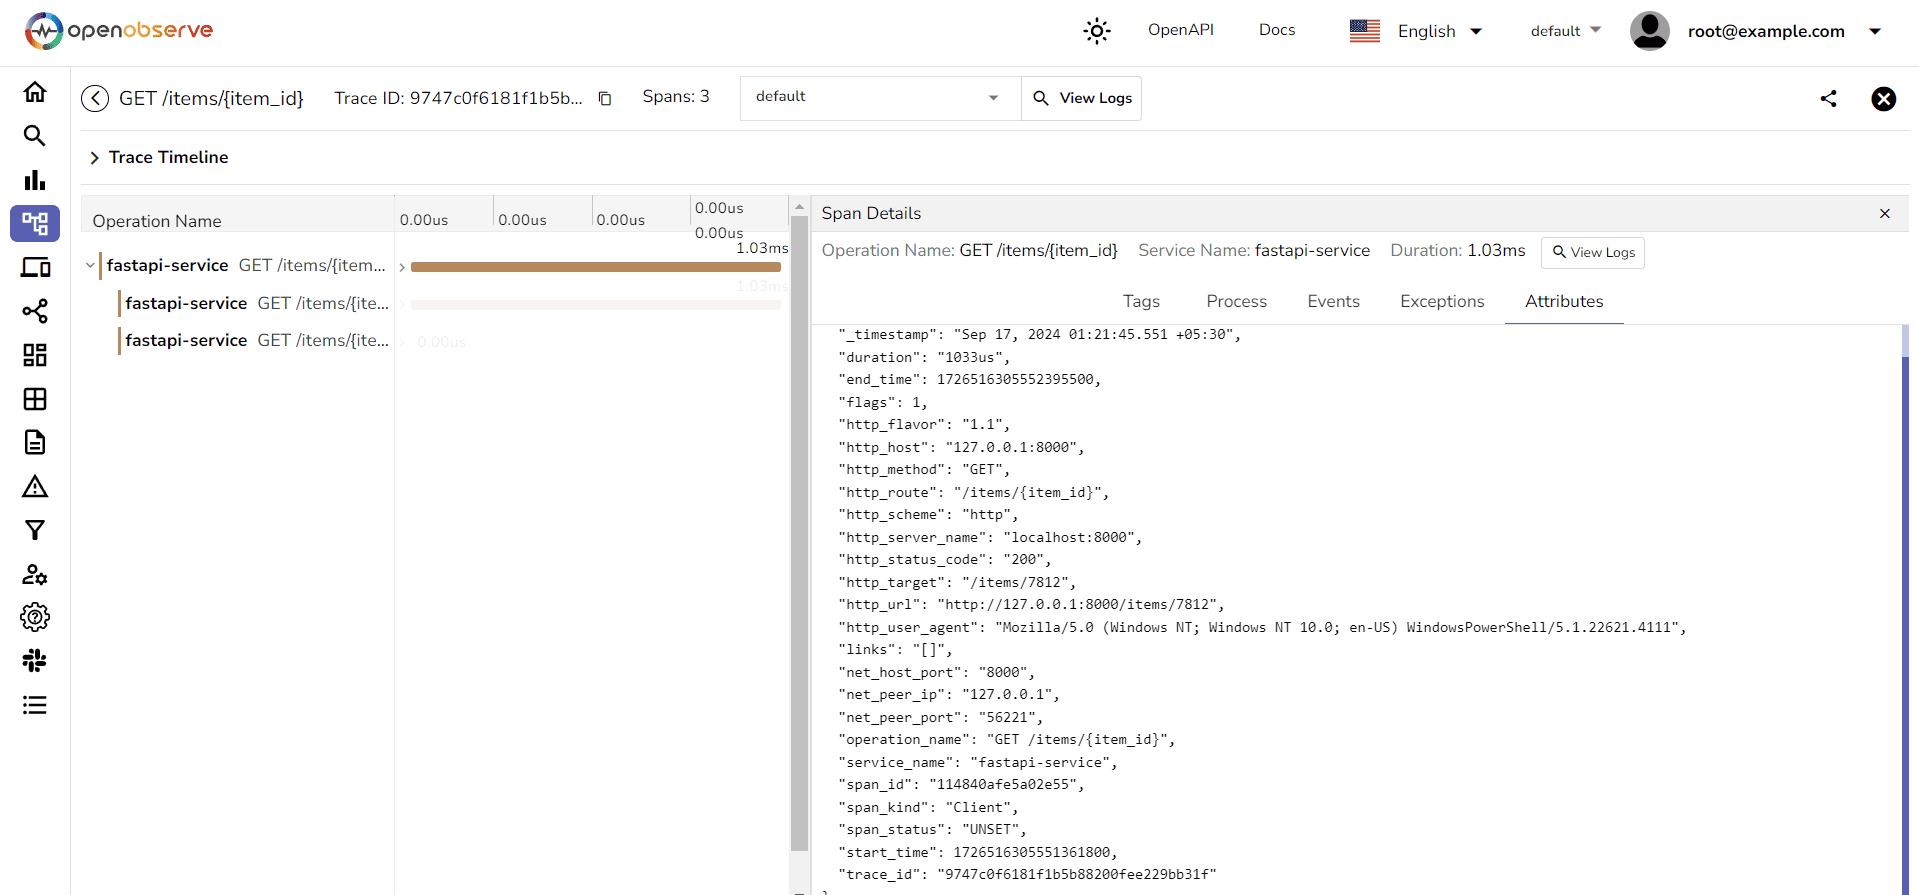 Traces
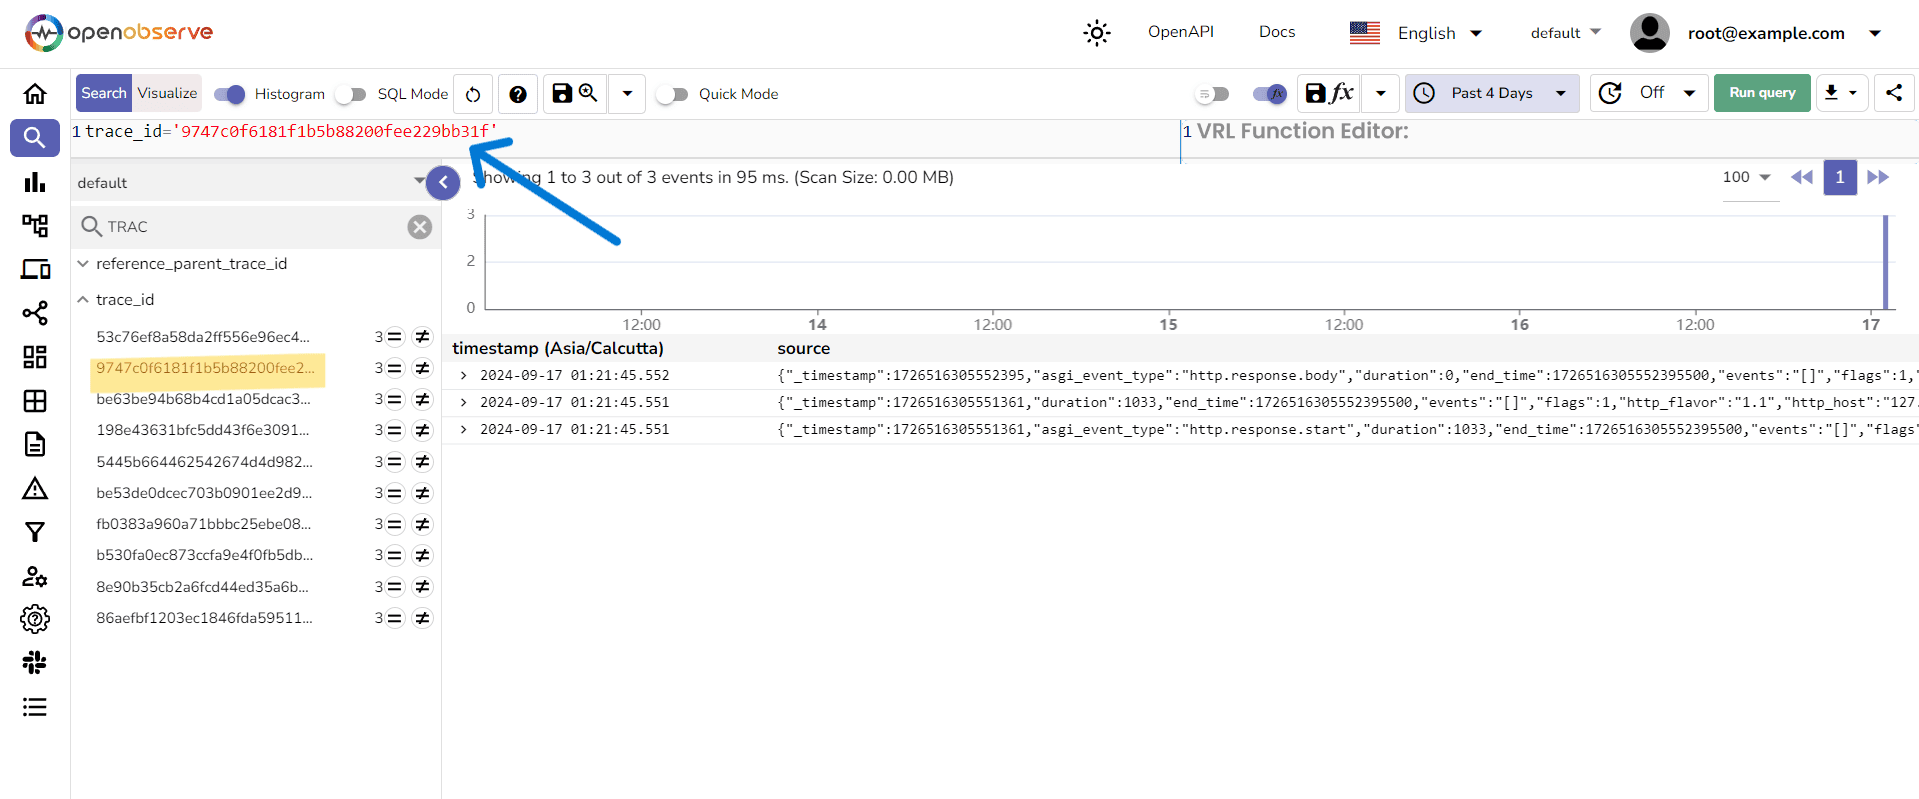
Use a query with the specific trace_id to search and filter through all logs associated with that trace, ensuring full visibility of the request flow.
Similarly, when viewing a trace, we can easily identify related logs by the same trace_id, allowing user to correlate logs with traces.
Misconfigured Logging
Setting up OpenTelemetry logging can often present challenges, particularly when it comes to ensuring that all components are correctly configured. In our architecture, it is crucial to ensure that the config.yaml file is properly structured and that all necessary receiver, processor, and exporter components are configured accurately.
To avoid configuration issues, consider the following best practices:
config.yaml for accuracy, ensuring that all paths, endpoints, and tokens are correct.If you encounter issues with logs not being ingested or exported, double-check your configuration and consult the OpenTelemetry Discussions forum for help and insights from the community.
Observability? Check!
By combining OpenTelemetry with OpenObserve, you’ve set up a powerful monitoring solution for your FastAPI application. This setup ensures that you have all the tools you need to keep a close eye on your application’s performance, from logging to tracing, all in one place.
Now go forth and monitor like a pro! 🚀
Manas is a passionate Dev and Cloud Advocate with a strong focus on cloud-native technologies, including observability, cloud, kubernetes, and opensource. building bridges between tech and community.