LLM Observability for AI Applications with OpenObserve and OpenLIT


Don’t forget to share!
Try OpenObserve Cloud today for more efficient and performant observability.
AI systems are evolving rapidly, with complex interactions between language models, web browsers, databases, and more. To ensure these systems perform reliably and efficiently, robust observability is crucial. In this guide, we'll walk you through the essential steps to integrate OpenObserve and OpenLIT, unlocking comprehensive monitoring solutions using OpenTelemetry metrics and traces.
AI agents perform intricate tasks involving Large Language Models (LLMs), web interactions, and database queries. Understanding how these systems operate is vital for:
As AI agents become more complex and autonomous, robust observability is indispensable for deploying trustworthy and understandable systems.
OpenLIT is an open-source Python library that simplifies AI development, especially for Generative AI and LLMs. With OpenLIT, you can:
With just a single line of code, OpenLIT provides full-stack monitoring for LLMs, vector databases, and GPUs, empowering developers to build and deploy AI applications with confidence.
To directly send OpenTelemetry metrics and traces generated by OpenLIT from your AI application to OpenObserve, follow these steps:
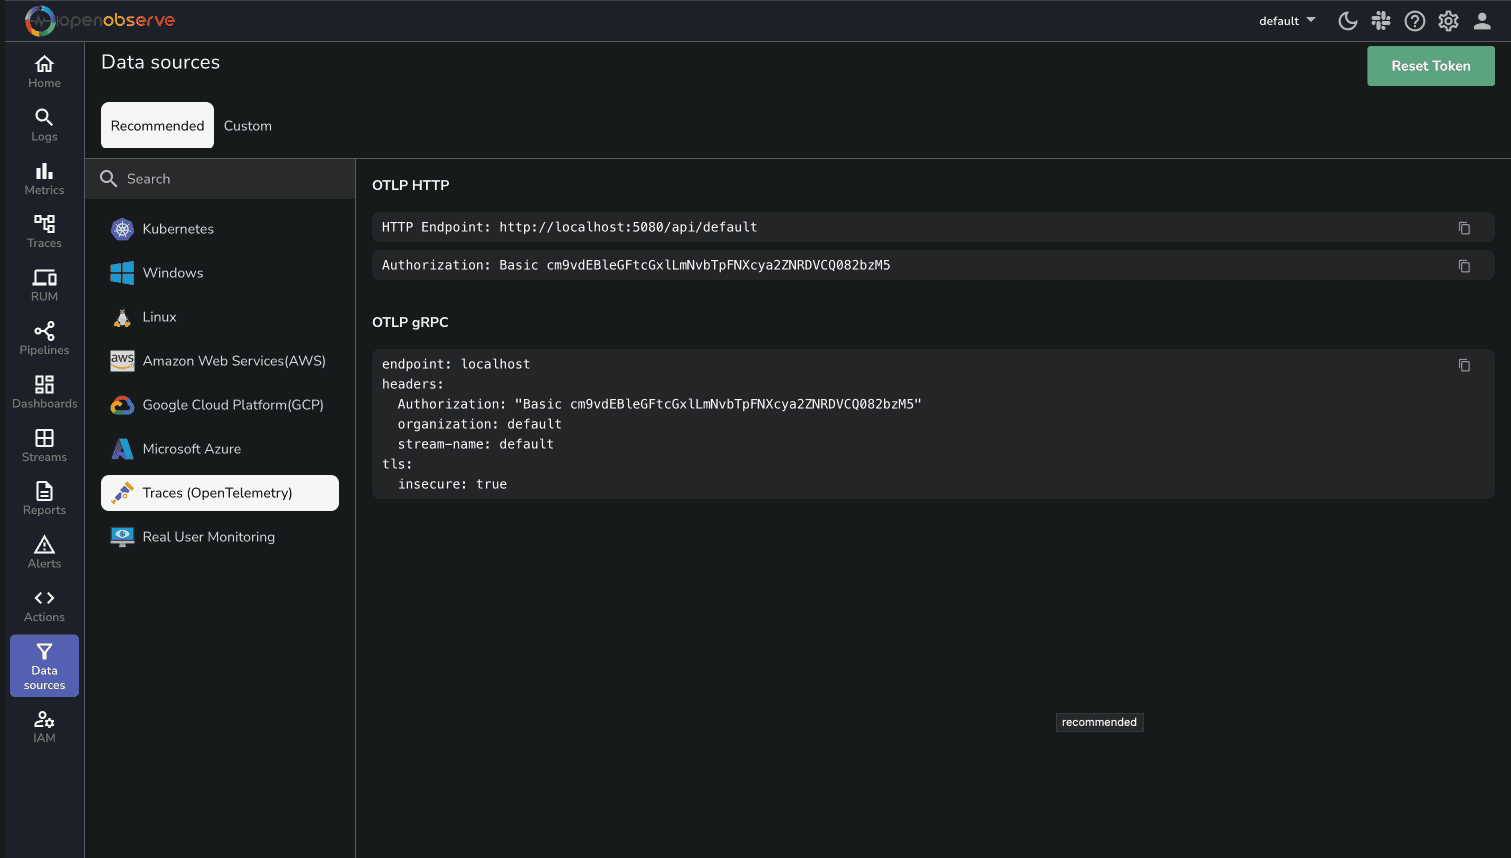
In this example, we'll demonstrate how to integrate OpenLIT with an OpenAI API client. This will allow you to monitor and observe the interactions between your application and the OpenAI API.
"""
python3 -m venv ./venv   &&  source ./venv/bin/activate &&  pip install opentelemetry-api opentelemetry-sdk opentelemetry-exporter-otlp opentelemetry-instrumentation botocore boto3 gpustat tiktoken pydantic openai openlit
"""
import openlit
import time
from openai import OpenAI

# Initialize OpenLIT with your OpenObserve credentials
openlit.init(
    otlp_endpoint="http://localhost:5080/api/default",  # Replace with your OpenObserve endpoint
    otlp_headers=otlp_headers="Authorization=Basic%20<REDACTED_AUTH_KEY>"  # Replace with your authorization key
)

questions = [
    "What is LLM Observability?",
    "Explain machine learning in simple terms",
    "What are neural networks?",
    "How does natural language processing work?",
    "What is transfer learning?",
    "Explain the concept of fine-tuning",
    "What are embedding vectors?",
    "How do transformers work in AI?",
    "What is prompt engineering?",
    "Explain the difference between supervised and unsupervised learning"
]

client = OpenAI(
    api_key="YOUR_OPENAI_API_KEY"
)

for i, question in enumerate(questions, 1):
    print(f"\nProcessing Question {i}: {question}")

    chat_completion = client.chat.completions.create(
        messages=[
            {
                "role": "user",
                "content": question,
            }
        ],
        model="gpt-3.5-turbo",
        max_completion_tokens=10
    )

    print(f"Response {i}:", chat_completion)

    time.sleep(1)

print("\nAll questions processed!")
This example configuration initializes OpenLIT with your OpenObserve credentials using the openlit.init() function, and sets up an OpenAI client with your API key to interact with the OpenAI API. Make sure to replace the placeholders with your actual credentials and API keys.
For advanced configurations, refer to the OpenLIT Python SDK repository.
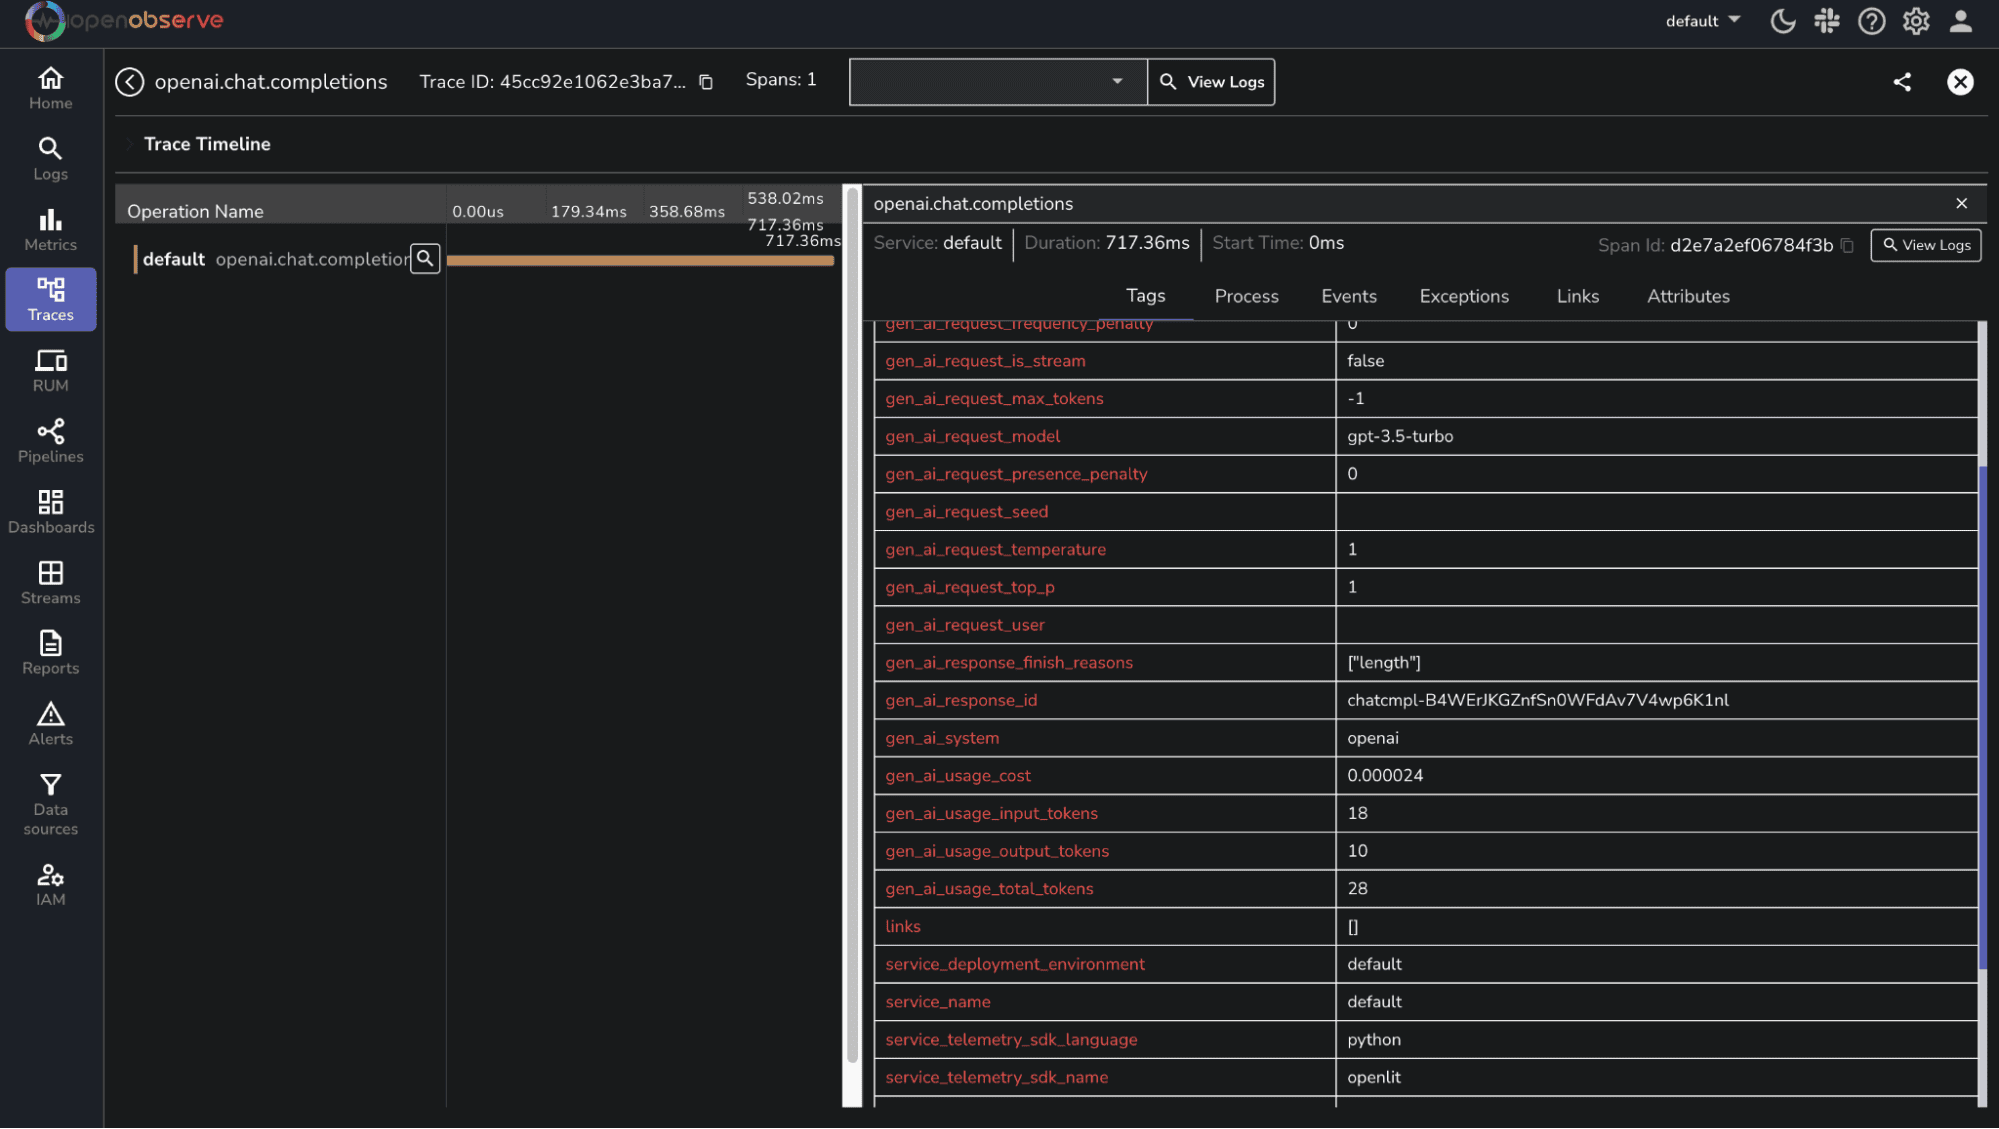
After running your application, verify that the metrics and traces are being sent to OpenObserve. Log into your OpenObserve instance and navigate to the metrics and traces sections to see the data being ingested.
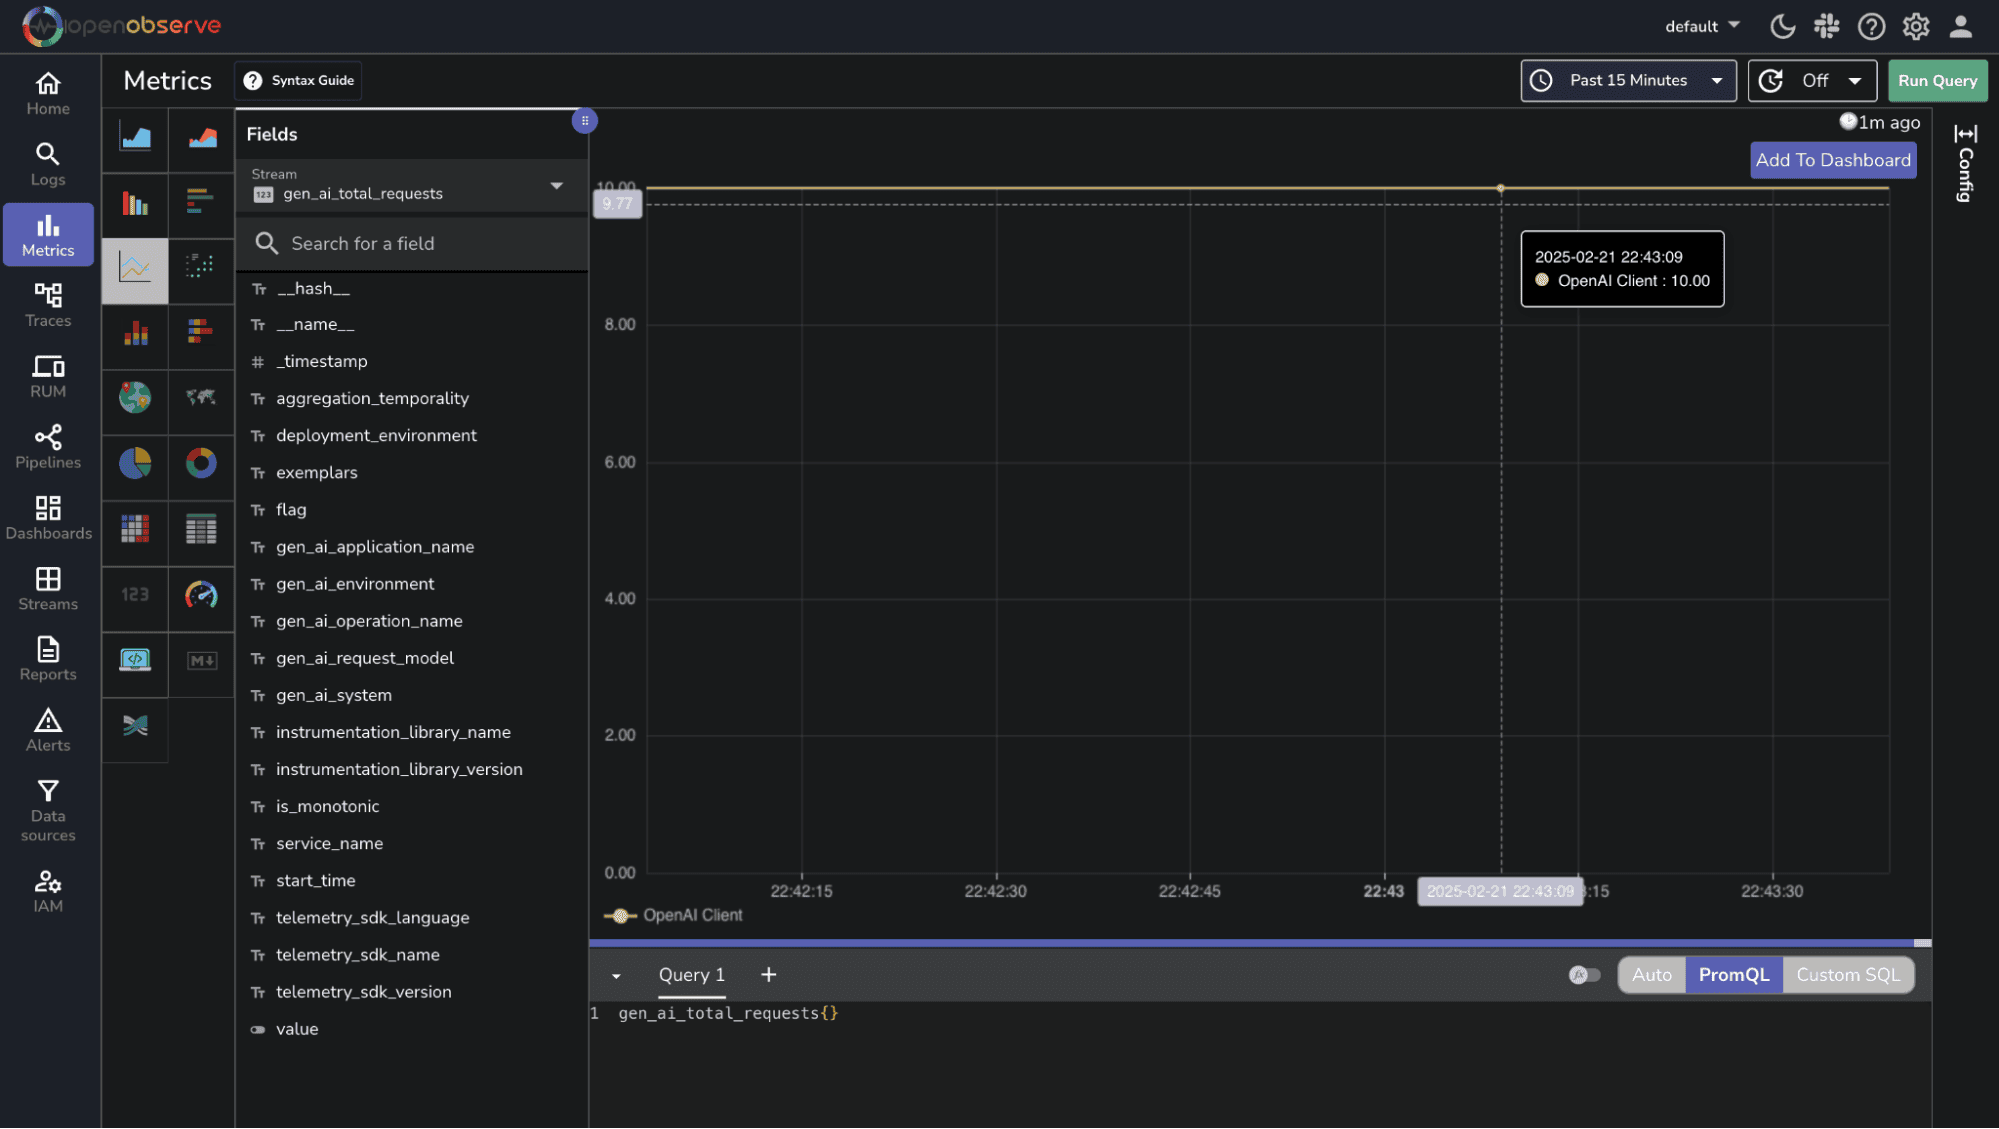
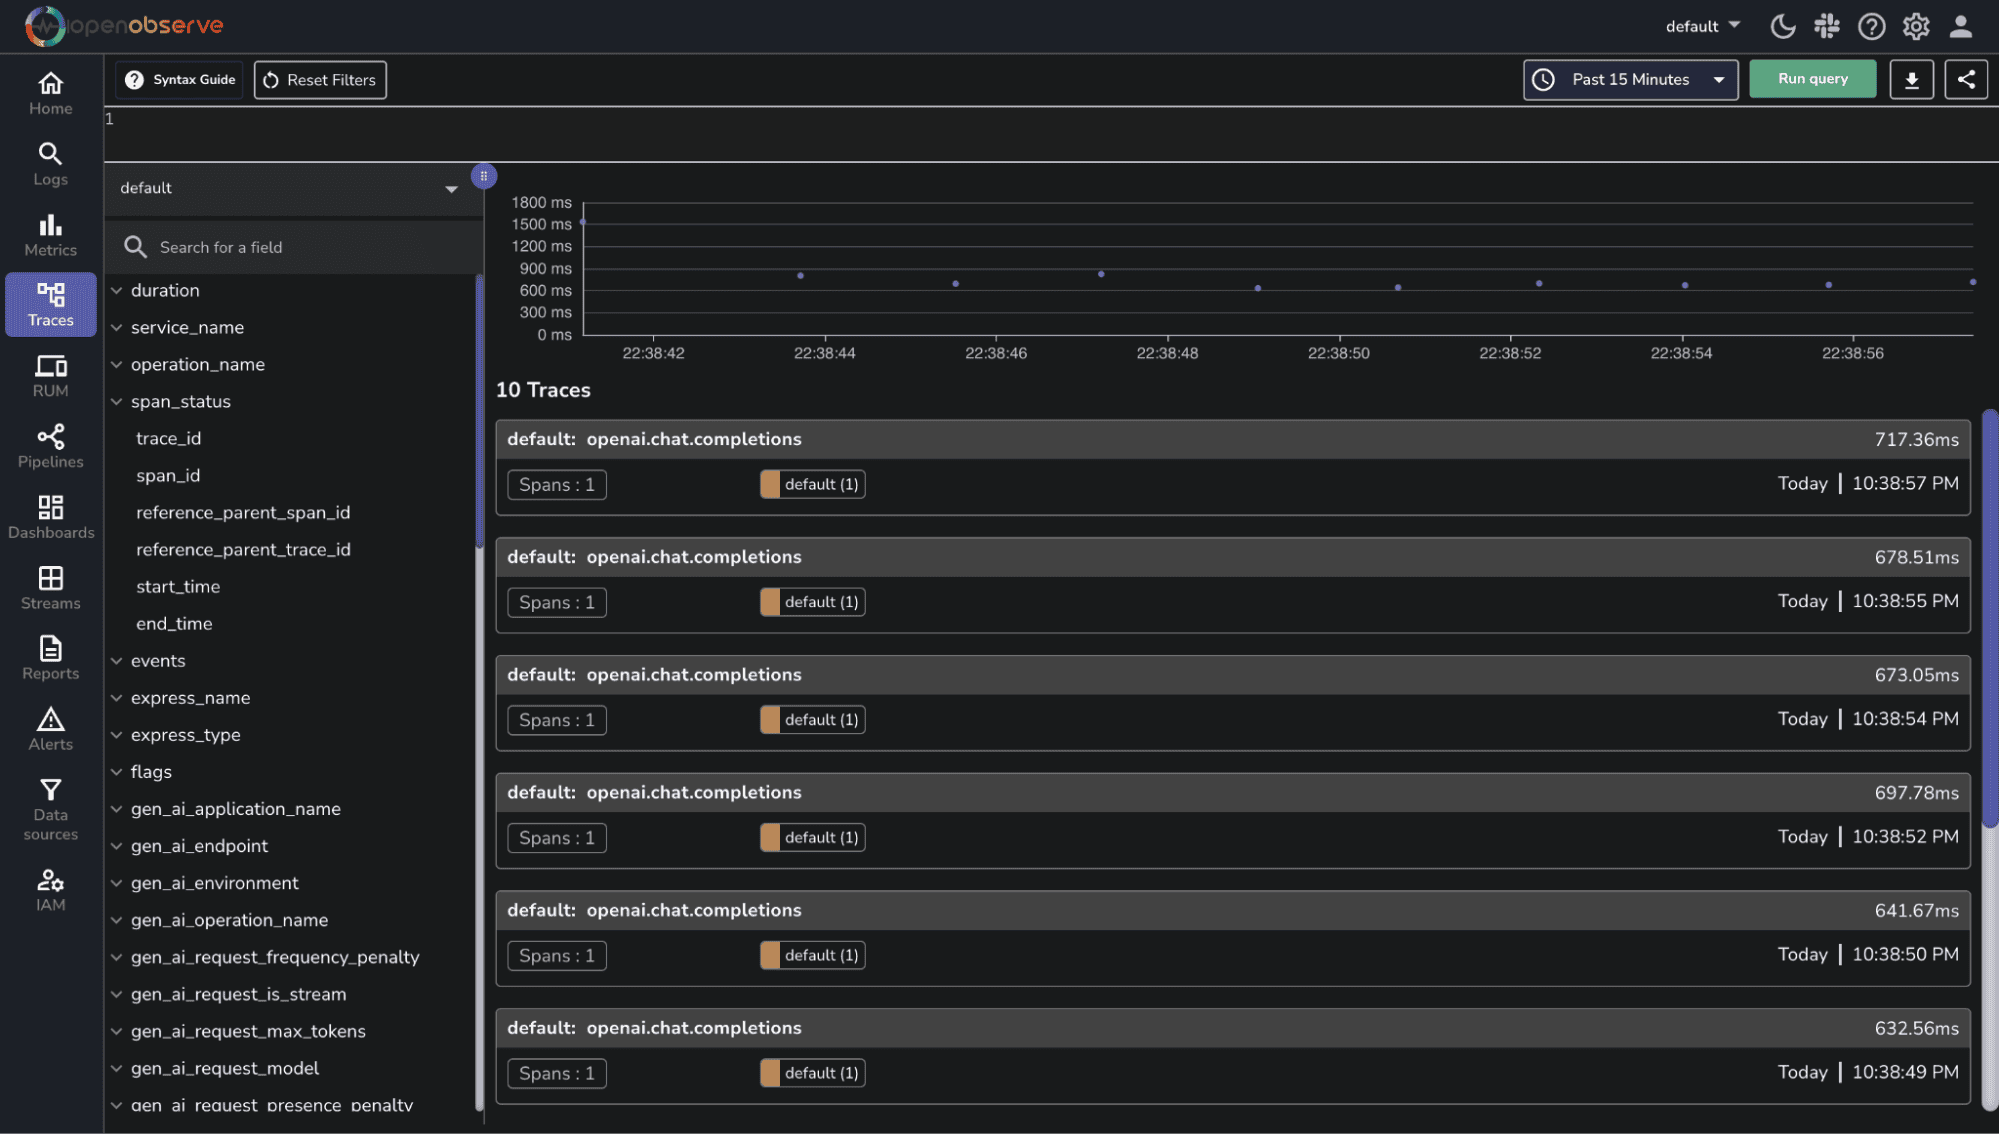
To effectively visualize and monitor your AI application's performance, import a pre-built dashboard into your OpenObserve instance. This dashboard provides a comprehensive overview of key metrics, enabling you to pinpoint areas for improvement and optimize system performance.
To import the pre-built dashboard:
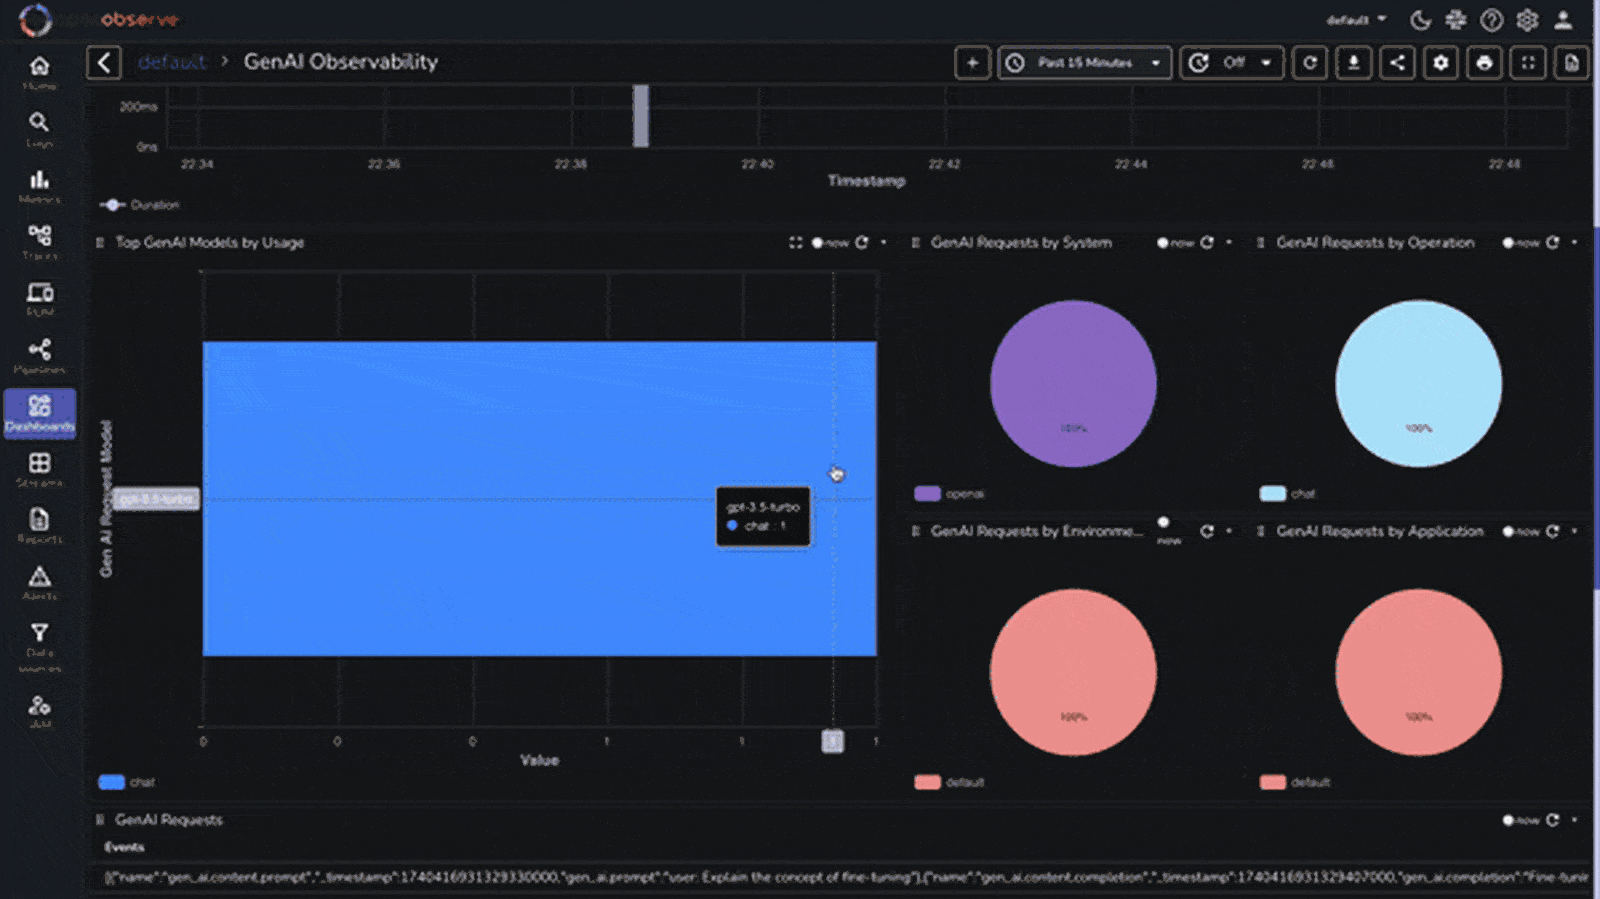
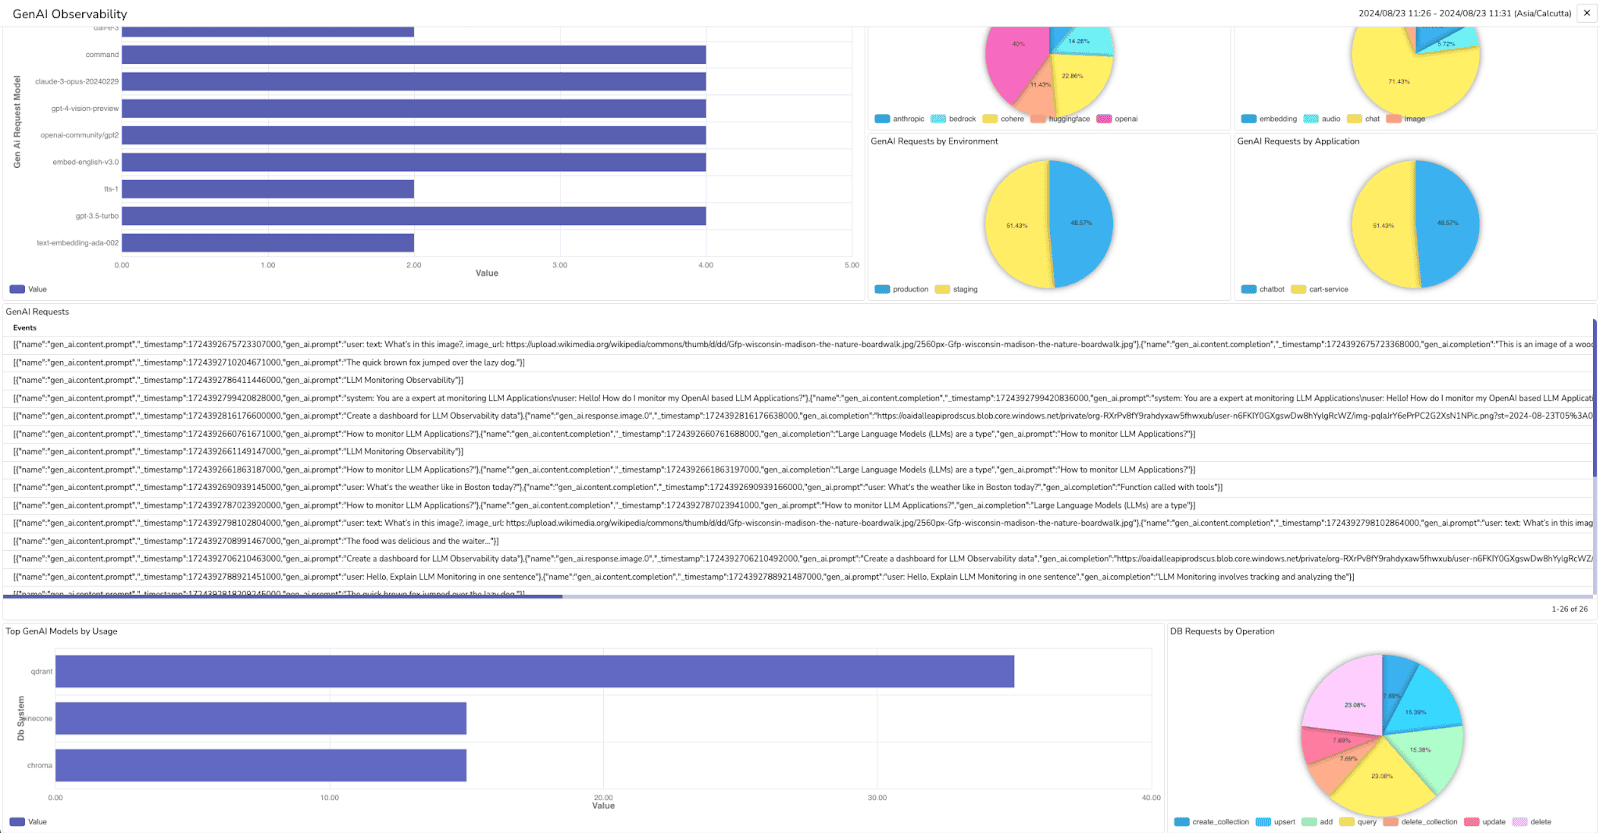
By leveraging this pre-built dashboard, you'll gain valuable insights into your AI application's performance, empowering you to optimize and refine your systems for enhanced user satisfaction.
With OpenObserve and OpenLIT seamlessly integrated, you'll possess a robust framework for monitoring, managing, and optimizing your AI systems. Begin implementing today and elevate the operational excellence of your AI-powered applications.
Sign up for a free account of OpenObserve cloud (200 GB free ingestion per month) Want to self-host or contribute? Check out our GitHub repository to explore self-hosting options and help grow the community.
Happy monitoring! 🚀
Manas is a passionate Dev and Cloud Advocate with a strong focus on cloud-native technologies, including observability, cloud, kubernetes, and opensource. building bridges between tech and community.
Passionate about crafting seamless user experiences and overcoming coding challenges. Let's build something amazing together!


