Parsing Syslog Messages

Prabhat Sharma
March 10, 2024
8 min read
Don’t forget to share!
Try OpenObserve Cloud today for more efficient and performant observability.

In the world of information technology and cybersecurity, the ability to collect, analyze, and understand log data is crucial for maintaining the health and security of IT environments. Syslog is a standard for message logging that allows a computer system to send event notification messages across IP networks to event message collectors – also known as syslog servers or syslog daemons. Parsing these syslog messages is vital for several reasons, including security monitoring, troubleshooting, and compliance with regulatory standards. This blog will explore the importance of syslog parsing, how to use the parse_syslog function in OpenObserve, address challenges with non-RFC compliant syslog messages from devices like MikroTik routers, and demonstrate parsing them using the parse_regex function. syslog messages can be ingested into OpenObserve using syslog-ng, otel-collector, fluentbit or vector.
Syslog parsing is important for several reasons:
Security Monitoring: By analyzing syslog messages, organizations can detect suspicious activities and potential security threats in real-time. This allows for immediate response to mitigate risks.
Troubleshooting: Syslog messages provide valuable insights into system behaviors and errors. Parsing these logs can help in quickly identifying and resolving issues affecting system performance and availability.
Compliance: Many regulatory standards require the collection, analysis, and archiving of logs to ensure data integrity and security. Proper syslog parsing aids in meeting these compliance requirements.
Operational Efficiency: Through the systematic analysis of syslog data, organizations can optimize their operations, improve system performance, and reduce downtime.
Let's take an example syslog message:
<34>1 2024-03-09T14:55:22.123Z mymachine.example.com evntslog - ID47 [exampleSDID@32473 iut="3" eventSource="Application" eventID="1011"] An application event occurred.
This can be broken down into the following components:
OpenObserve offers the parse_syslog function through Vector Remap Language (VRL), enabling users to extract structured data from syslog messages easily. This function automatically parses the priority, facility, severity, timestamp, hostname, and message from a syslog string, according to the RFC 6587, RFC 5424 and RFC 3164 standards.
Consider a syslog example message discussed earlier:
{
"event": "<34>1 2024-03-09T14:55:22.123Z mymachine.example.com evntslog - ID47 [exampleSDID@32473 iut=\"3\" eventSource=\"Application\" eventID=\"1011\"] An application event occurred."
}
To parse this message using the parse_syslog function in OpenObserve, you would simply apply the function to the message:
.event = parse_syslog!(.event)
will result in:
{
	"event": {
		"appname": "evntslog",
		"exampleSDID@32473": {
			"eventID": "1011",
			"eventSource": "Application",
			"iut": "3"
		},
		"facility": "auth",
		"hostname": "mymachine.example.com",
		"message": "An application event occurred.",
		"msgid": "ID47",
		"severity": "crit",
		"timestamp": "2024-03-09T14:55:22.123Z",
		"version": 1
	}
}
There are cases where the built-in parse_syslog function may not be effective in parsing syslog messages, especially when the messages are not RFC compliant. In such cases, the parse_regex function can be used to extract meaningful data from syslog messages.
Some deices like MikroTik routers are known to generate non-RFC compliant syslog messages. These messages do not adhere to the standard syslog format and require custom parsing to extract meaningful data. Let's consider the following syslog messages generated by a MikroTik router:
2024-03-04T21:58:06.625318+00:00 testing-router firewall,info input: in:ether5-S2S out:(unknown 0), connection-mark:to_ether5 connection-state:established src-mac 00:01:5c:9f:f0:46, proto 50, xxx.yyy.zzz.www->aaa.bbb.ccc.ddd, len 140
2024-03-04T22:58:13+00:00 testing-router input: in:ether5-S2S out:(unknown 0), connection-mark:to_ether5 connection-state:established src-mac 00:01:5c:9f:f0:46, proto 50, xxx.yyy.zzz.www->aaa.bbb.ccc.ddd, len 156
2024-03-04T22:58:13+00:00 testing-router input: in:ether5-S2S out:(unknown 0), connection-mark:to_ether5 connection-state:established proto 47, xxx.yyy.zzz.www->aaa.bbb.ccc.ddd, len 100
Once ingested into OpenObserve, they may appear as JSON objects like this:
{
    "log": "2024-03-04T22:58:13+00:00 testing-router input: in:ether5-S2S out:(unknown 0), connection-mark:to_ether5 connection-state:established proto 47, xxx.yyy.zzz.www->aaa.bbb.ccc.ddd, len 100"
}
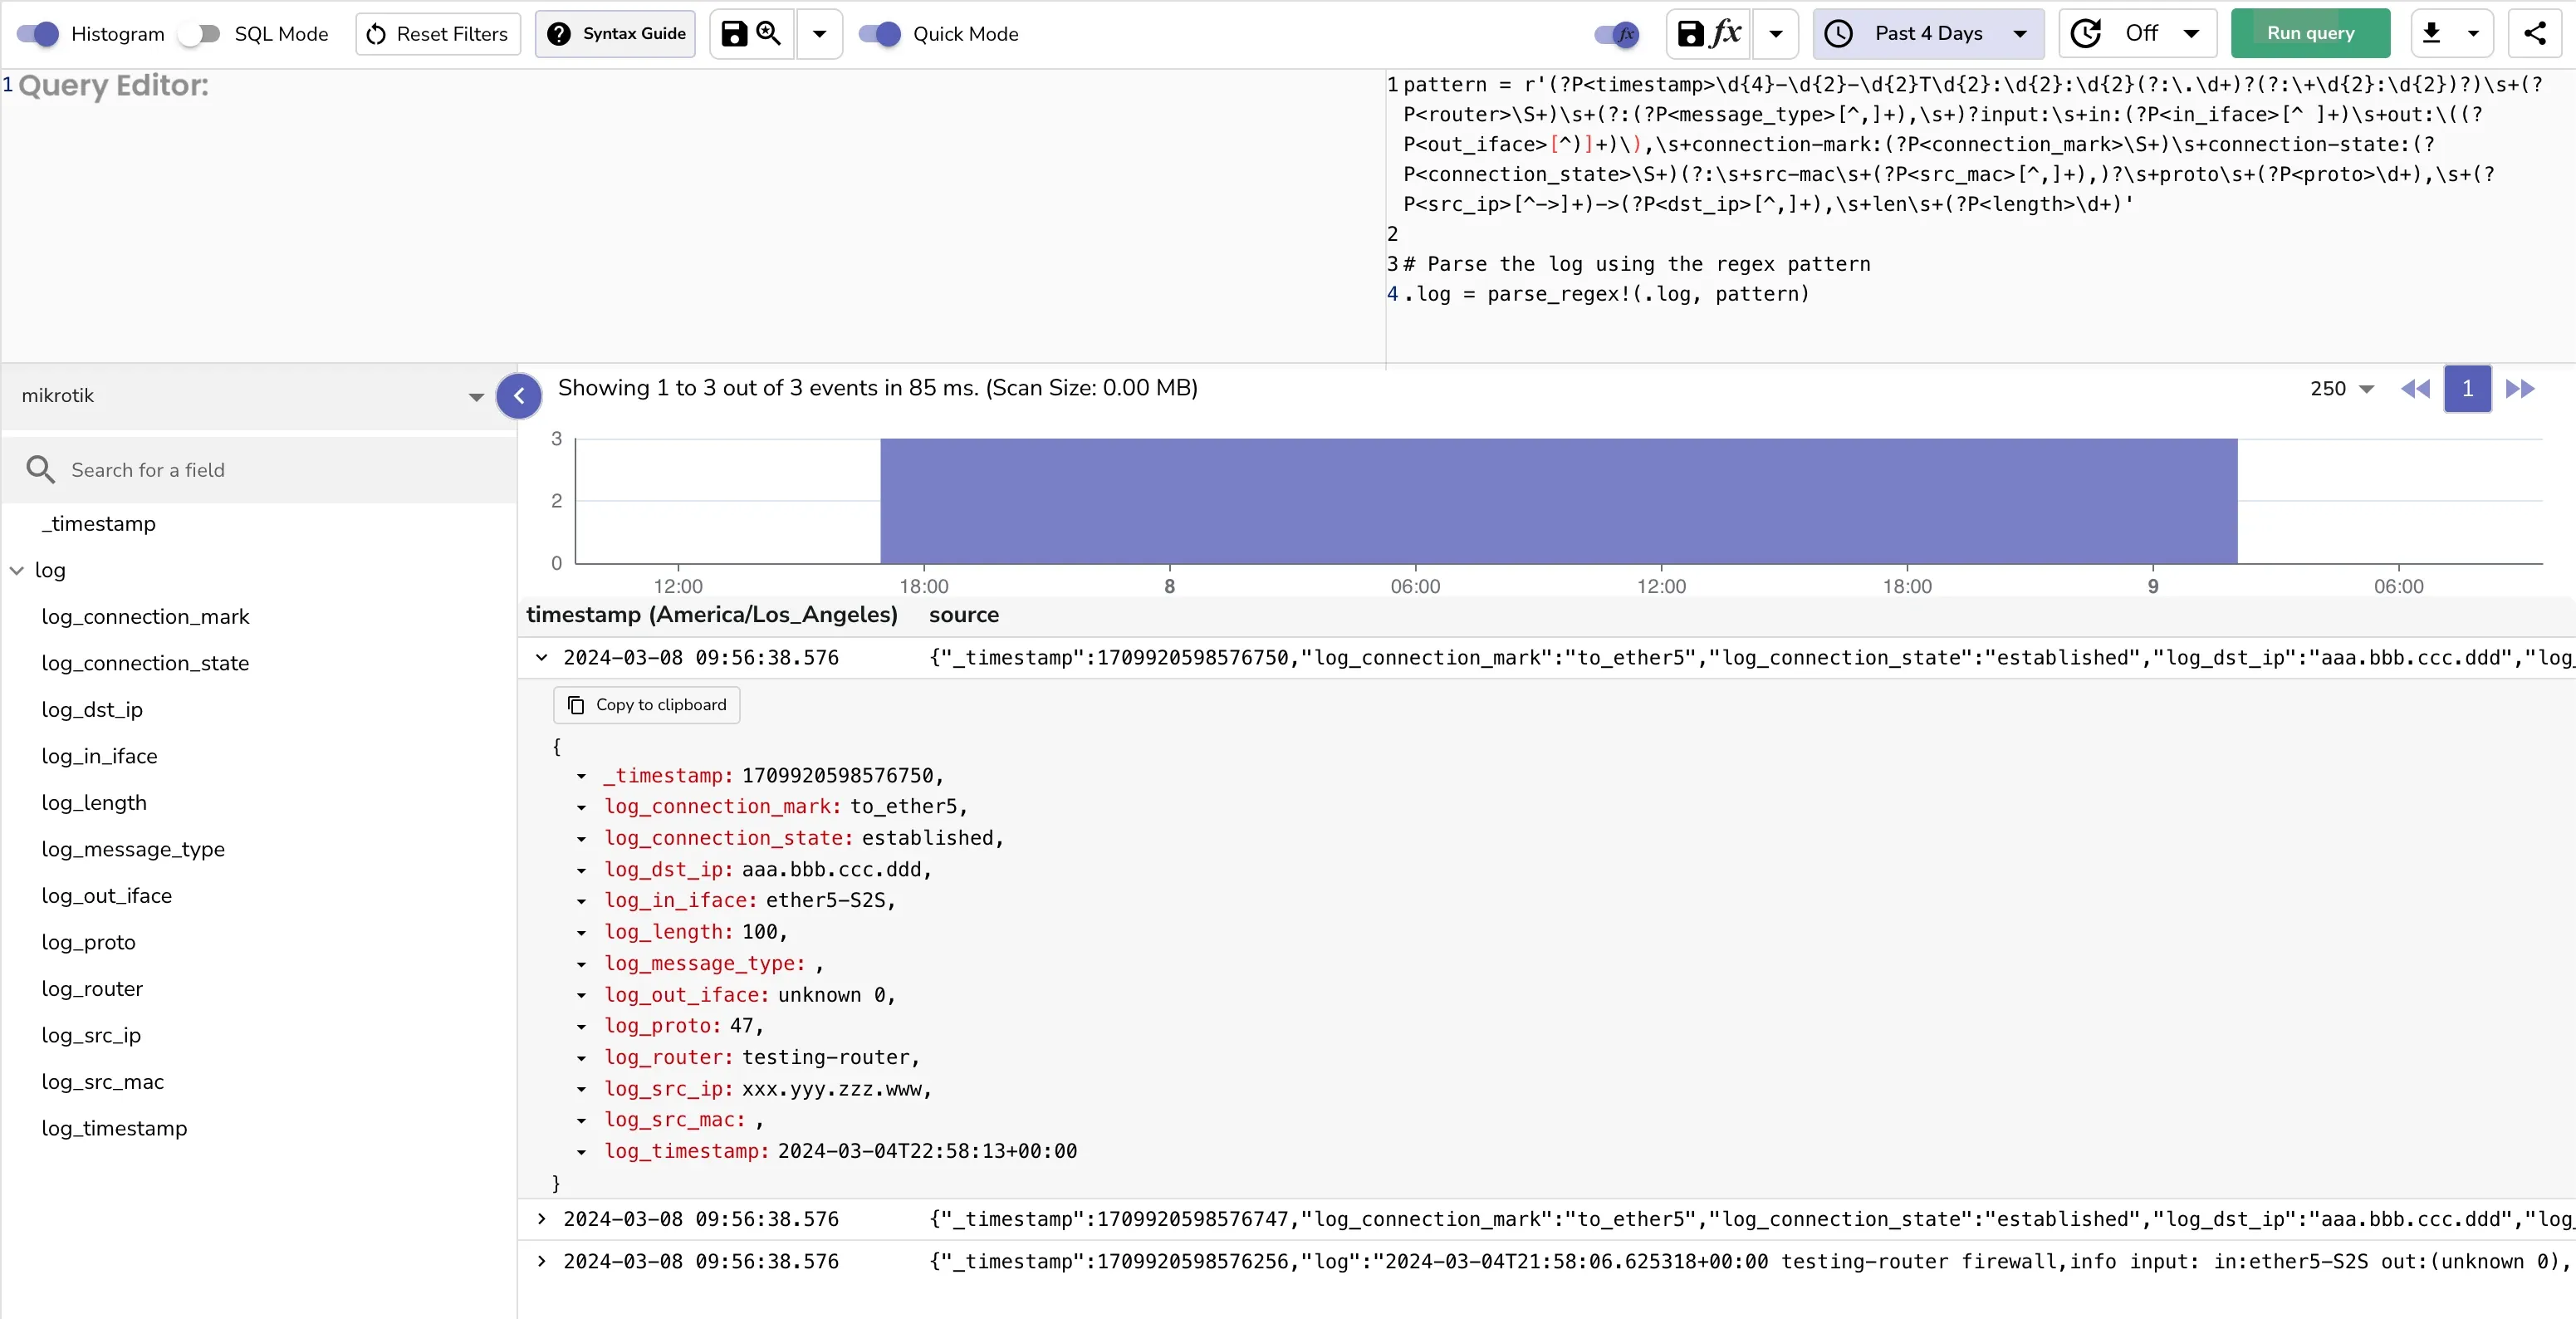
parse_regex in VRLYou can create a regular expression pattern and use it for parsing the sample logs. The parse_regex function then applies this pattern to the .log field of the incoming JSON object:
pattern = r'(?P<timestamp>\d{4}-\d{2}-\d{2}T\d{2}:\d{2}:\d{2}(?:\.\d+)?(?:\+\d{2}:\d{2})?)\s+(?P<router>\S+)\s+(?:(?P<message_type>[^,]+),\s+)?input:\s+in:(?P<in_iface>[^ ]+)\s+out:\((?P<out_iface>[^)]+)\),\s+connection-mark:(?P<connection_mark>\S+)\s+connection-state:(?P<connection_state>\S+)(?:\s+src-mac\s+(?P<src_mac>[^,]+),)?\s+proto\s+(?P<proto>\d+),\s+(?P<src_ip>[^->]+)->(?P<dst_ip>[^,]+),\s+len\s+(?P<length>\d+)'

# Parse the log using the regex pattern
.log = parse_regex!(.log, pattern)
The regex pattern is a sequence of named groups that correspond to the different parts of the syslog message we want to extract:
When the parse_regex function is applied to the syslog message, the output is a structured JSON object that clearly delineates the extracted data:
{
    "log": {
        "timestamp": "2024-03-04T22:58:13+00:00",
        "router": "testing-router",
        "message_type": null,
        "in_iface": "ether5-S2S",
        "out_iface": "unknown 0",
        "connection_mark": "to_ether5",
        "connection_state": "established",
        "src_mac": null,
        "proto": "47",
        "src_ip": "xxx.yyy.zzz.www",
        "dst_ip": "aaa.bbb.ccc.ddd",
        "length": "100"
    }
}
This structured data is now ready for further analysis or alerting within OpenObserve. By leveraging the parse_regex function, network administrators can transform MikroTik's complex syslog messages into actionable insights, contributing to more effective network monitoring and management.
You should save the VRL function and associate it to the stream. This will ensure that the logs are parsed and structured as they are ingested into OpenObserve.
Syslog parsing is a critical aspect of network monitoring and security. By effectively parsing syslog messages, organizations can gain valuable insights into system behaviors, security events, and operational issues. OpenObserve provides powerful tools like parse_syslog and parse_regex to facilitate the extraction of structured data from syslog messages, enabling network administrators to make informed decisions and take proactive measures to ensure the health and security of their IT environments. By leveraging these parsing capabilities, organizations can enhance their security posture, improve operational efficiency, and meet compliance requirements effectively.
Prabhat Sharma is the founder of OpenObserve, bringing extensive expertise in cloud computing, Kubernetes, and observability. His interests also encompass machine learning, liberal arts, economics, and systems architecture. Outside of work, Prabhat enjoys spending quality time playing with his children.