Parsing windows IIS logs
Prabhat Sharma
March 10, 2024
6 min read
Don’t forget to share!
Try OpenObserve Cloud today for more efficient and performant observability.

Internet Information Services (IIS) is a flexible, secure and manageable Web server for hosting anything on the Web. Monitoring and analyzing IIS logs can provide valuable insights into the performance and health of your web applications. In this blog, we will walk through the process of capturing IIS logs using the OpenTelemetry Collector (otel-collector) and parsing them using VRL functions in OpenObserve for analysis. You could use fluentbit or vector as well to capture the logs and send them to OpenObserve.
The OpenTelemetry Collector offers a vendor-agnostic implementation on how to receive, process, and export telemetry data. In our case, we want to capture IIS logs and send them for analysis. Here's how you can set it up:
Ingestion page.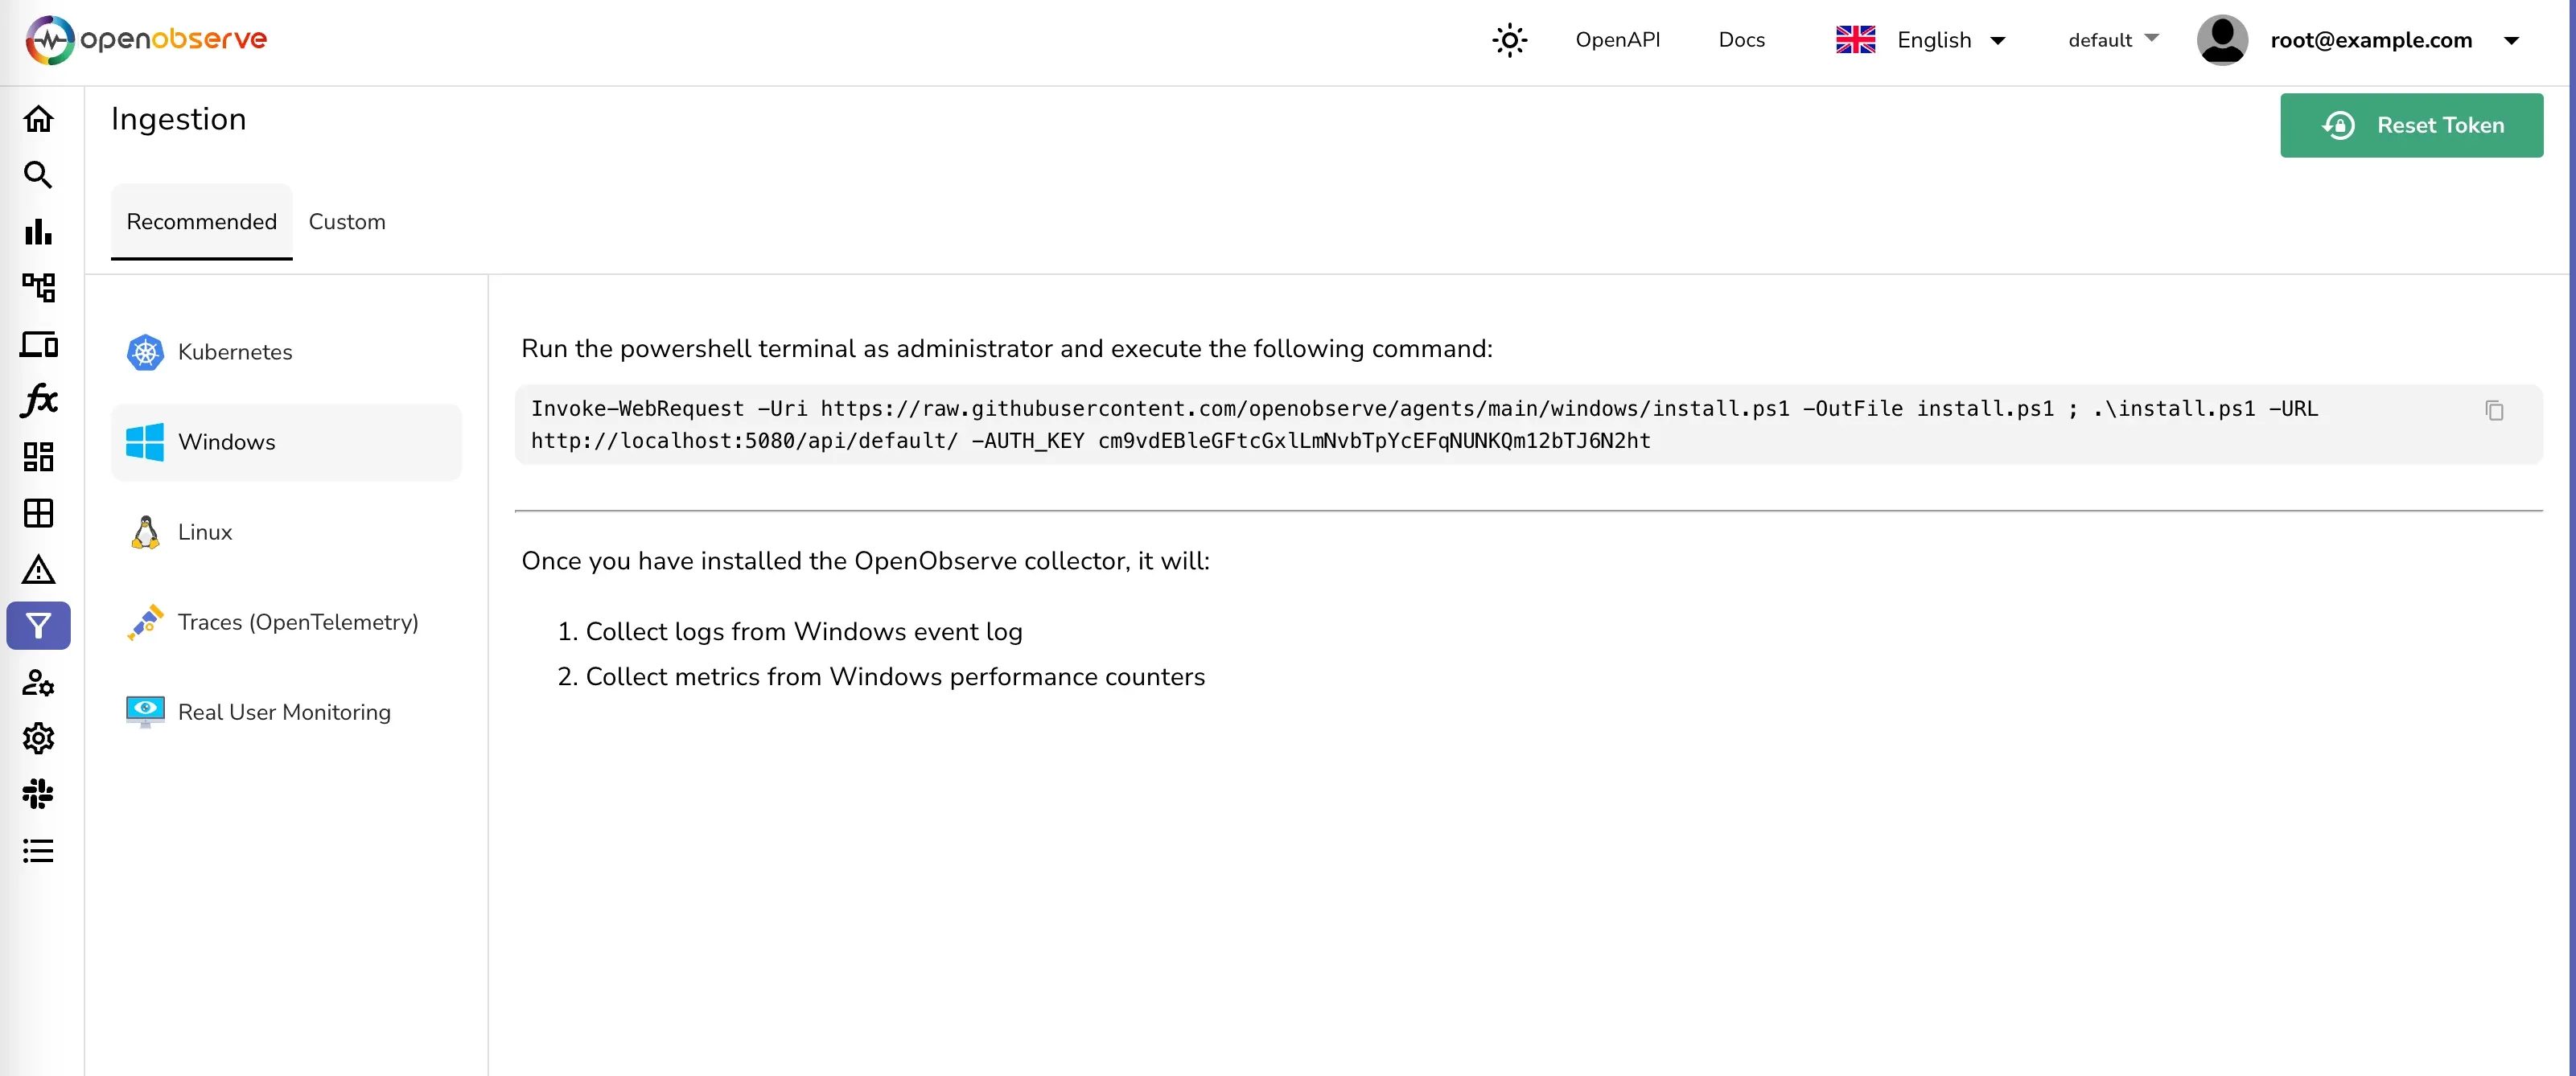
This will install the otel-collector as a Windows service with the binary and the configuration file in c:\otel-collector
filelog receiver. This receiver will watch for log files in the specified directory and read new log entries as they are written.Open the configuration file c:\otel-collector\otel-config.yaml and add the following configuration snippet:
receivers:
  filelog/iis:
    include: ['c:\\inetpub\\logs\\LogFiles\\**\\*']
    start_at: beginning
exporters:
  otlphttp/openobserve_iis:
    endpoint: http://localhost:5080/api/default/
    headers:
      stream-name: iis
      Authorization: "Basic cm9vdEBleGFtcGxlLmNvbTpXbTNtdTFaS2Vma3pCa1p1"
filelog/iis receiver and the appropriate exporter.Example configuration snippet for the service:
service:
  pipelines:
    logs/iis:
      receivers: [filelog/iis]
      processors: [resourcedetection/system, memory_limiter, batch]
      exporters: [otlphttp/openobserve_iis]
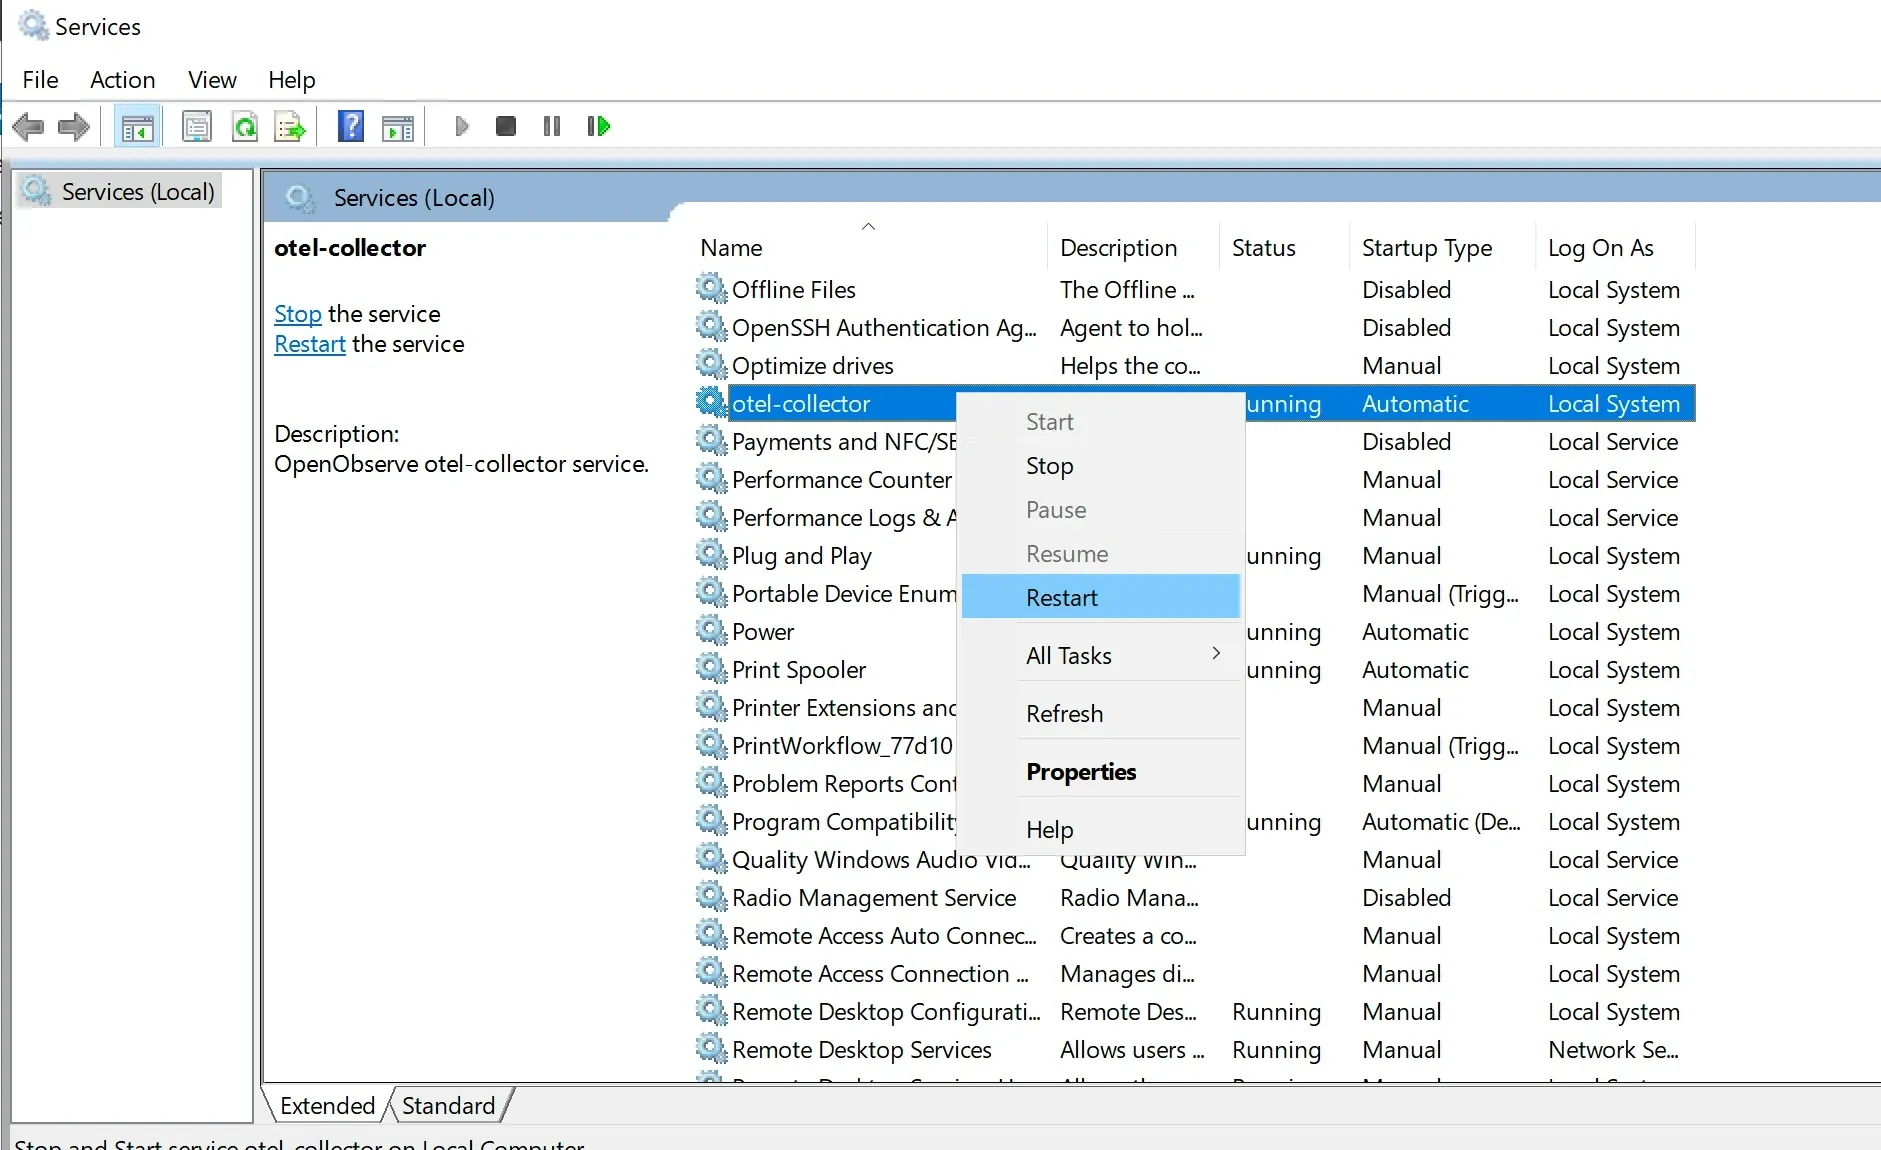
At this point, the otel-collector is set up to capture IIS logs and send them to OpenObserve for analysis. For the changes to take effect, restart the otel-collector service.
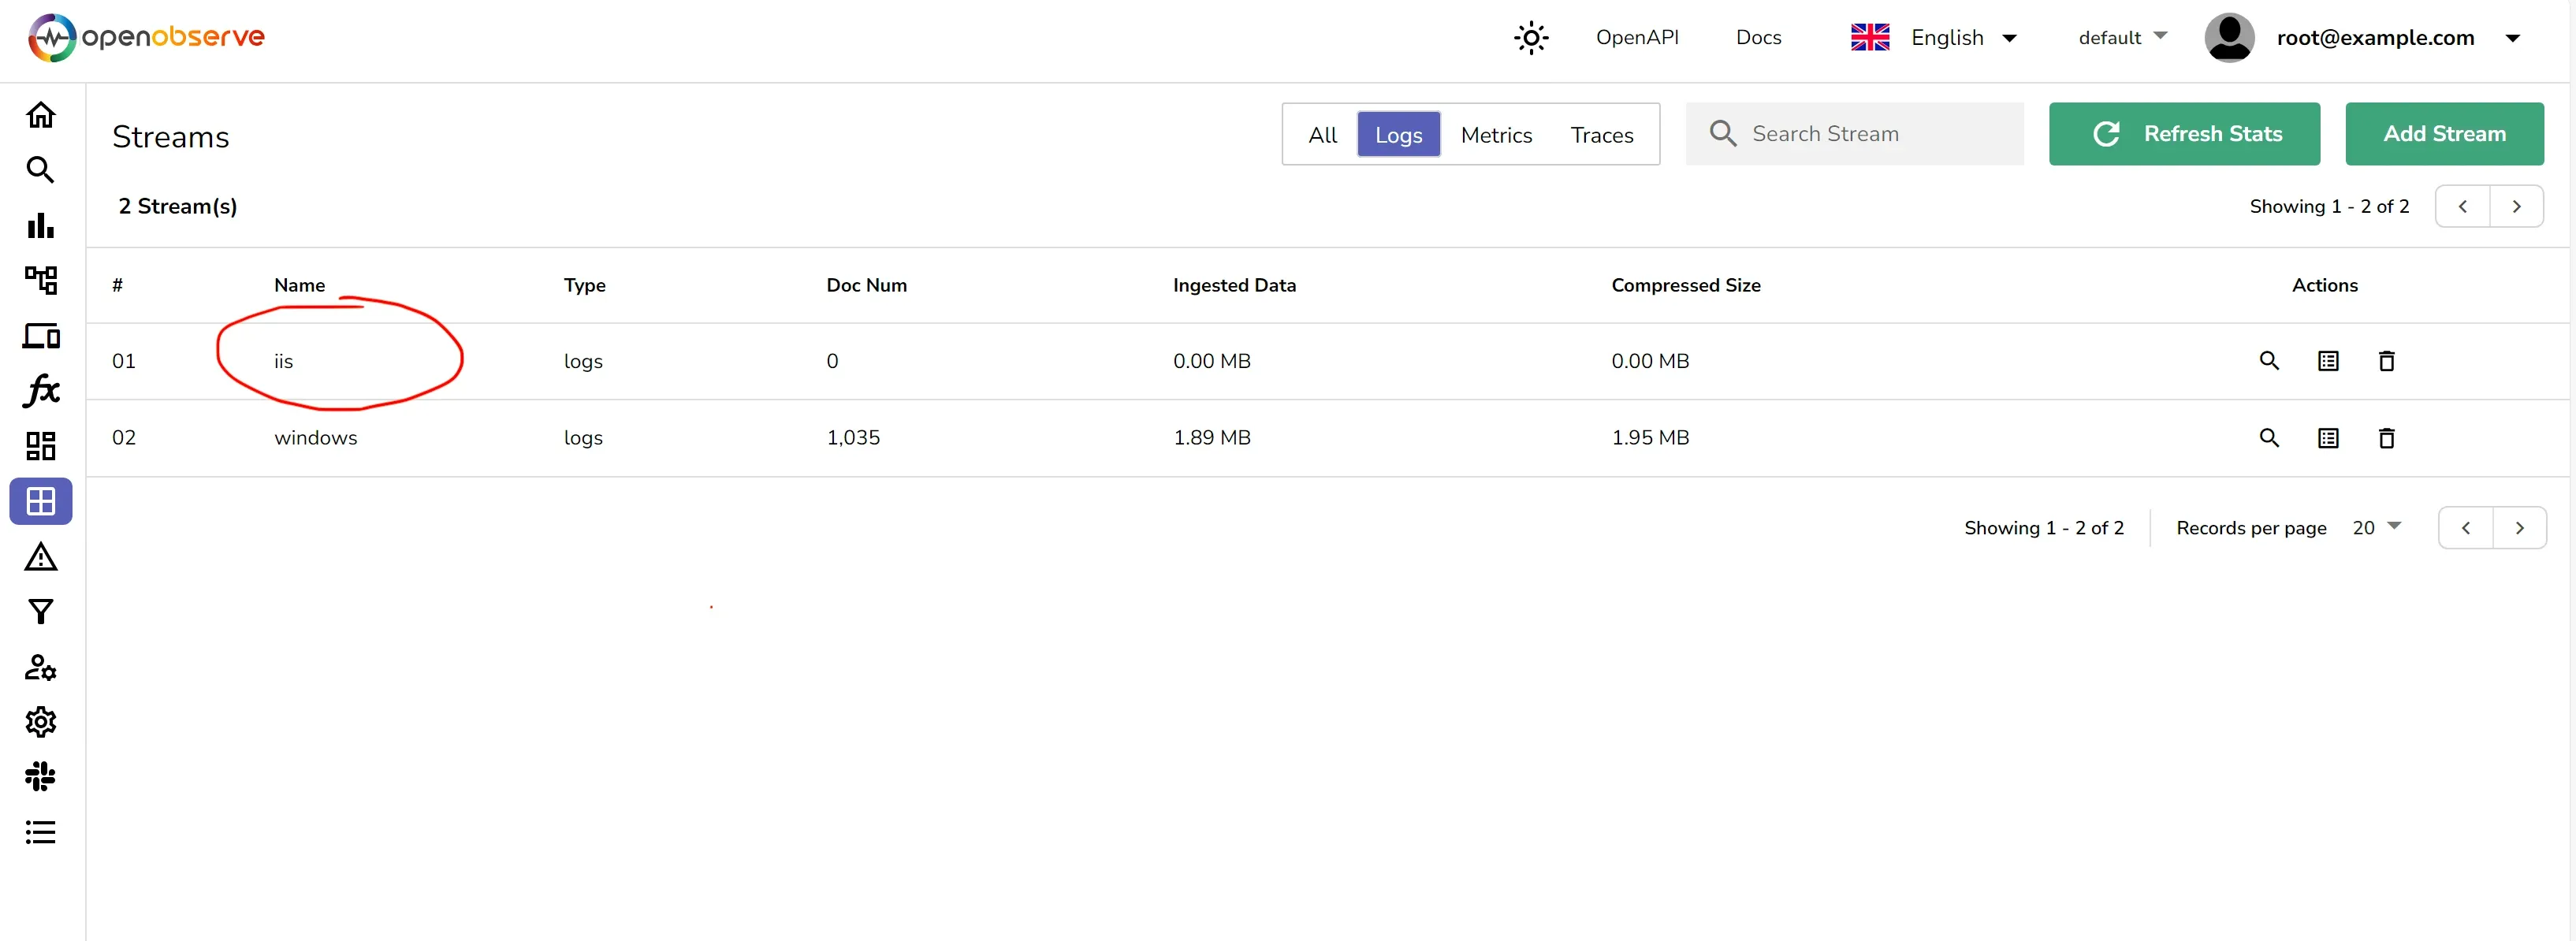
Once the otel-collector is running, it will start capturing IIS logs and sending them to OpenObserve. You should see a new stream iis under streams/logs menu
After setting up the otel-collector to capture the IIS logs, the next step is to parse these logs into a structured format that can be easily analyzed. VRL functions can be created in OpenObserve to parse the logs.
The IIS logs are typically written in a space-separated format.
Here is a sample log entry from an IIS log file:
{
  "_timestamp": 1710067224558454,
  "body": "2024-03-10 10:39:35 ::1 GET / - 80 - ::1 Mozilla/5.0+(Windows+NT+10.0;+Win64;+x64)+AppleWebKit/537.36+(KHTML,+like+Gecko)+Chrome/121.0.0.0+Safari/537.36+Edg/121.0.0.0 - 304 0 0 0",
  "dropped_attributes_count": 0,
  "host_name": "EC2AMAZ-FI57MQI",
  "log_file_name": "u_ex240310.log",
  "os_type": "windows",
  "severity": ""
}
The body contains detailed information about a single HTTP request in a common log format. Let's break down the components:
2024-03-10 10:39:35: The date and time when the request was received.::1: The source IP address of the request, which in this case is the loopback address (IPv6 format), indicating the request was made locally on the server.GET: The HTTP method used for the request./: The path of the requested resource, which in this case is the root directory.80: The port number on which the request was received.-: This dash often represents the referrer URL, which is missing here, indicating the request was not made through a link on another page.::1: Again, the source IP address, also indicating a local request.Mozilla/5.0 ... Edg/121.0.0.0: The user agent string, which provides information about the client making the request, including the operating system, browser version, and rendering engine.304: The HTTP status code sent in response, indicating that the resource was not modified and the client can use the cached version.0: Substatus code (specific to the server software) which sometimes provides more detail on the response.0: Win32 status code, which can provide information about the status of the request at the operating system level.0: The time taken to serve the request, in milliseconds.This structured logging is useful for automated processing and analysis, allowing systems and administrators to filter, search, and analyze log data efficiently.
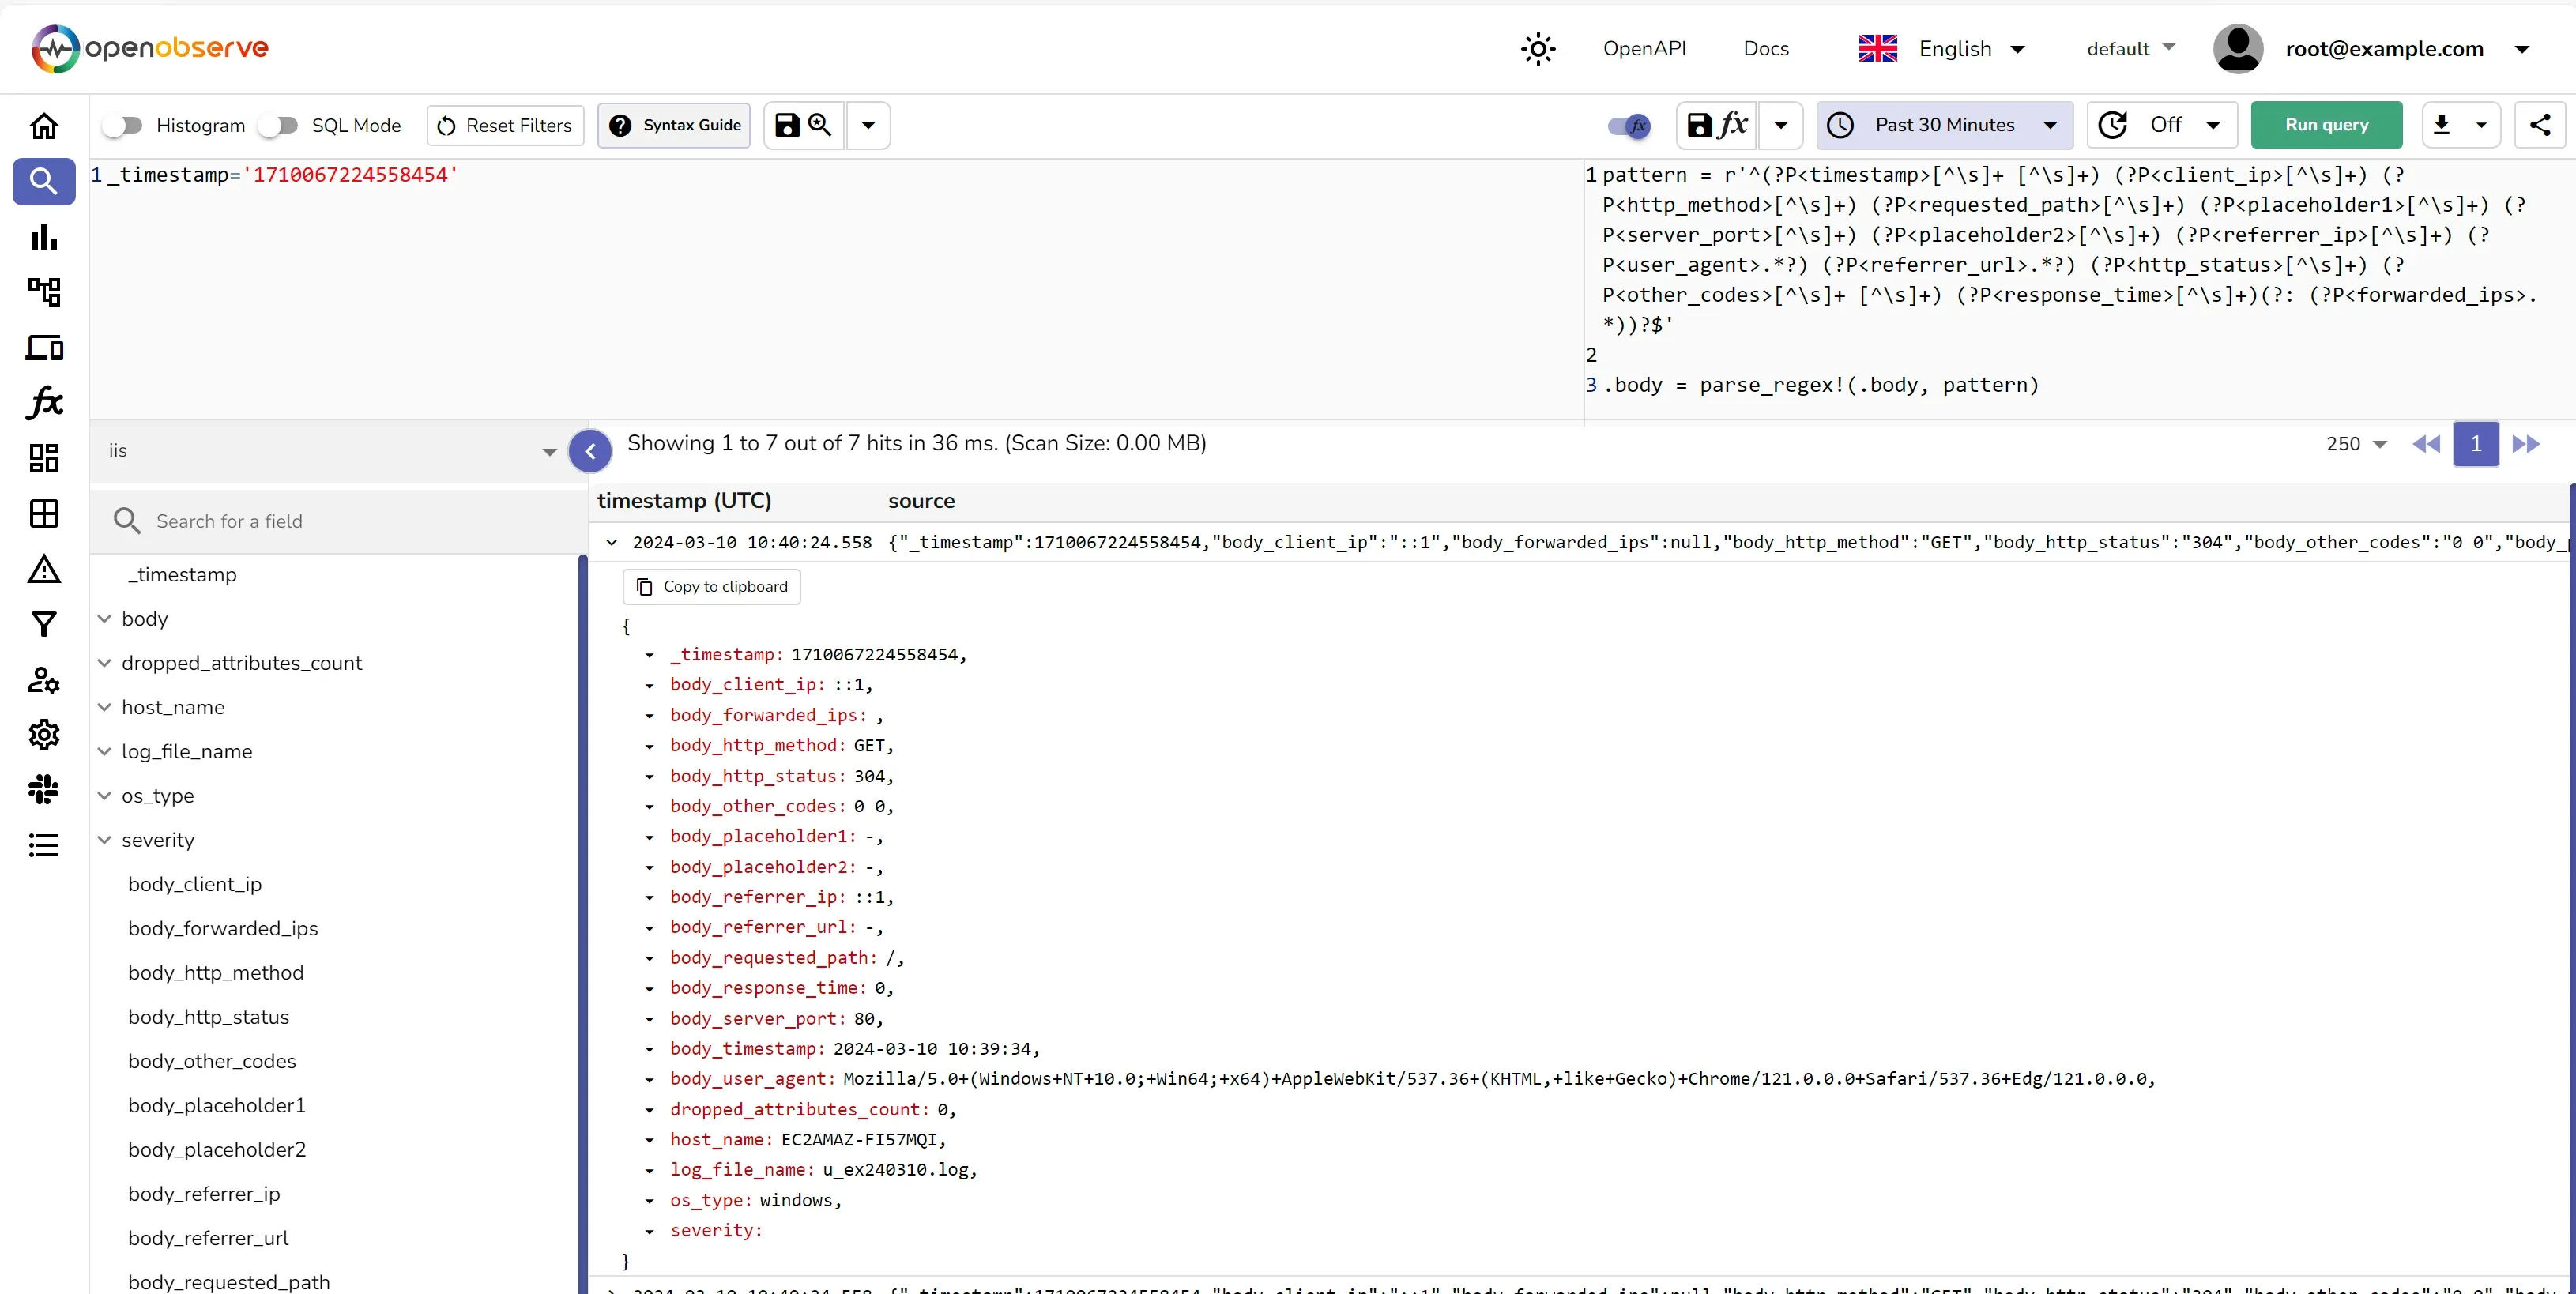
Here's an example of how you can parse the logs using VRL:
pattern = r'^(?P<timestamp>[^\s]+ [^\s]+) (?P<client_ip>[^\s]+) (?P<http_method>[^\s]+) (?P<requested_path>[^\s]+) (?P<placeholder1>[^\s]+) (?P<server_port>[^\s]+) (?P<placeholder2>[^\s]+) (?P<referrer_ip>[^\s]+) (?P<user_agent>.*?) (?P<referrer_url>.*?) (?P<http_status>[^\s]+) (?P<other_codes>[^\s]+ [^\s]+) (?P<response_time>[^\s]+)(?: (?P<forwarded_ips>.*))?$'

.body = parse_regex!(.body, pattern)
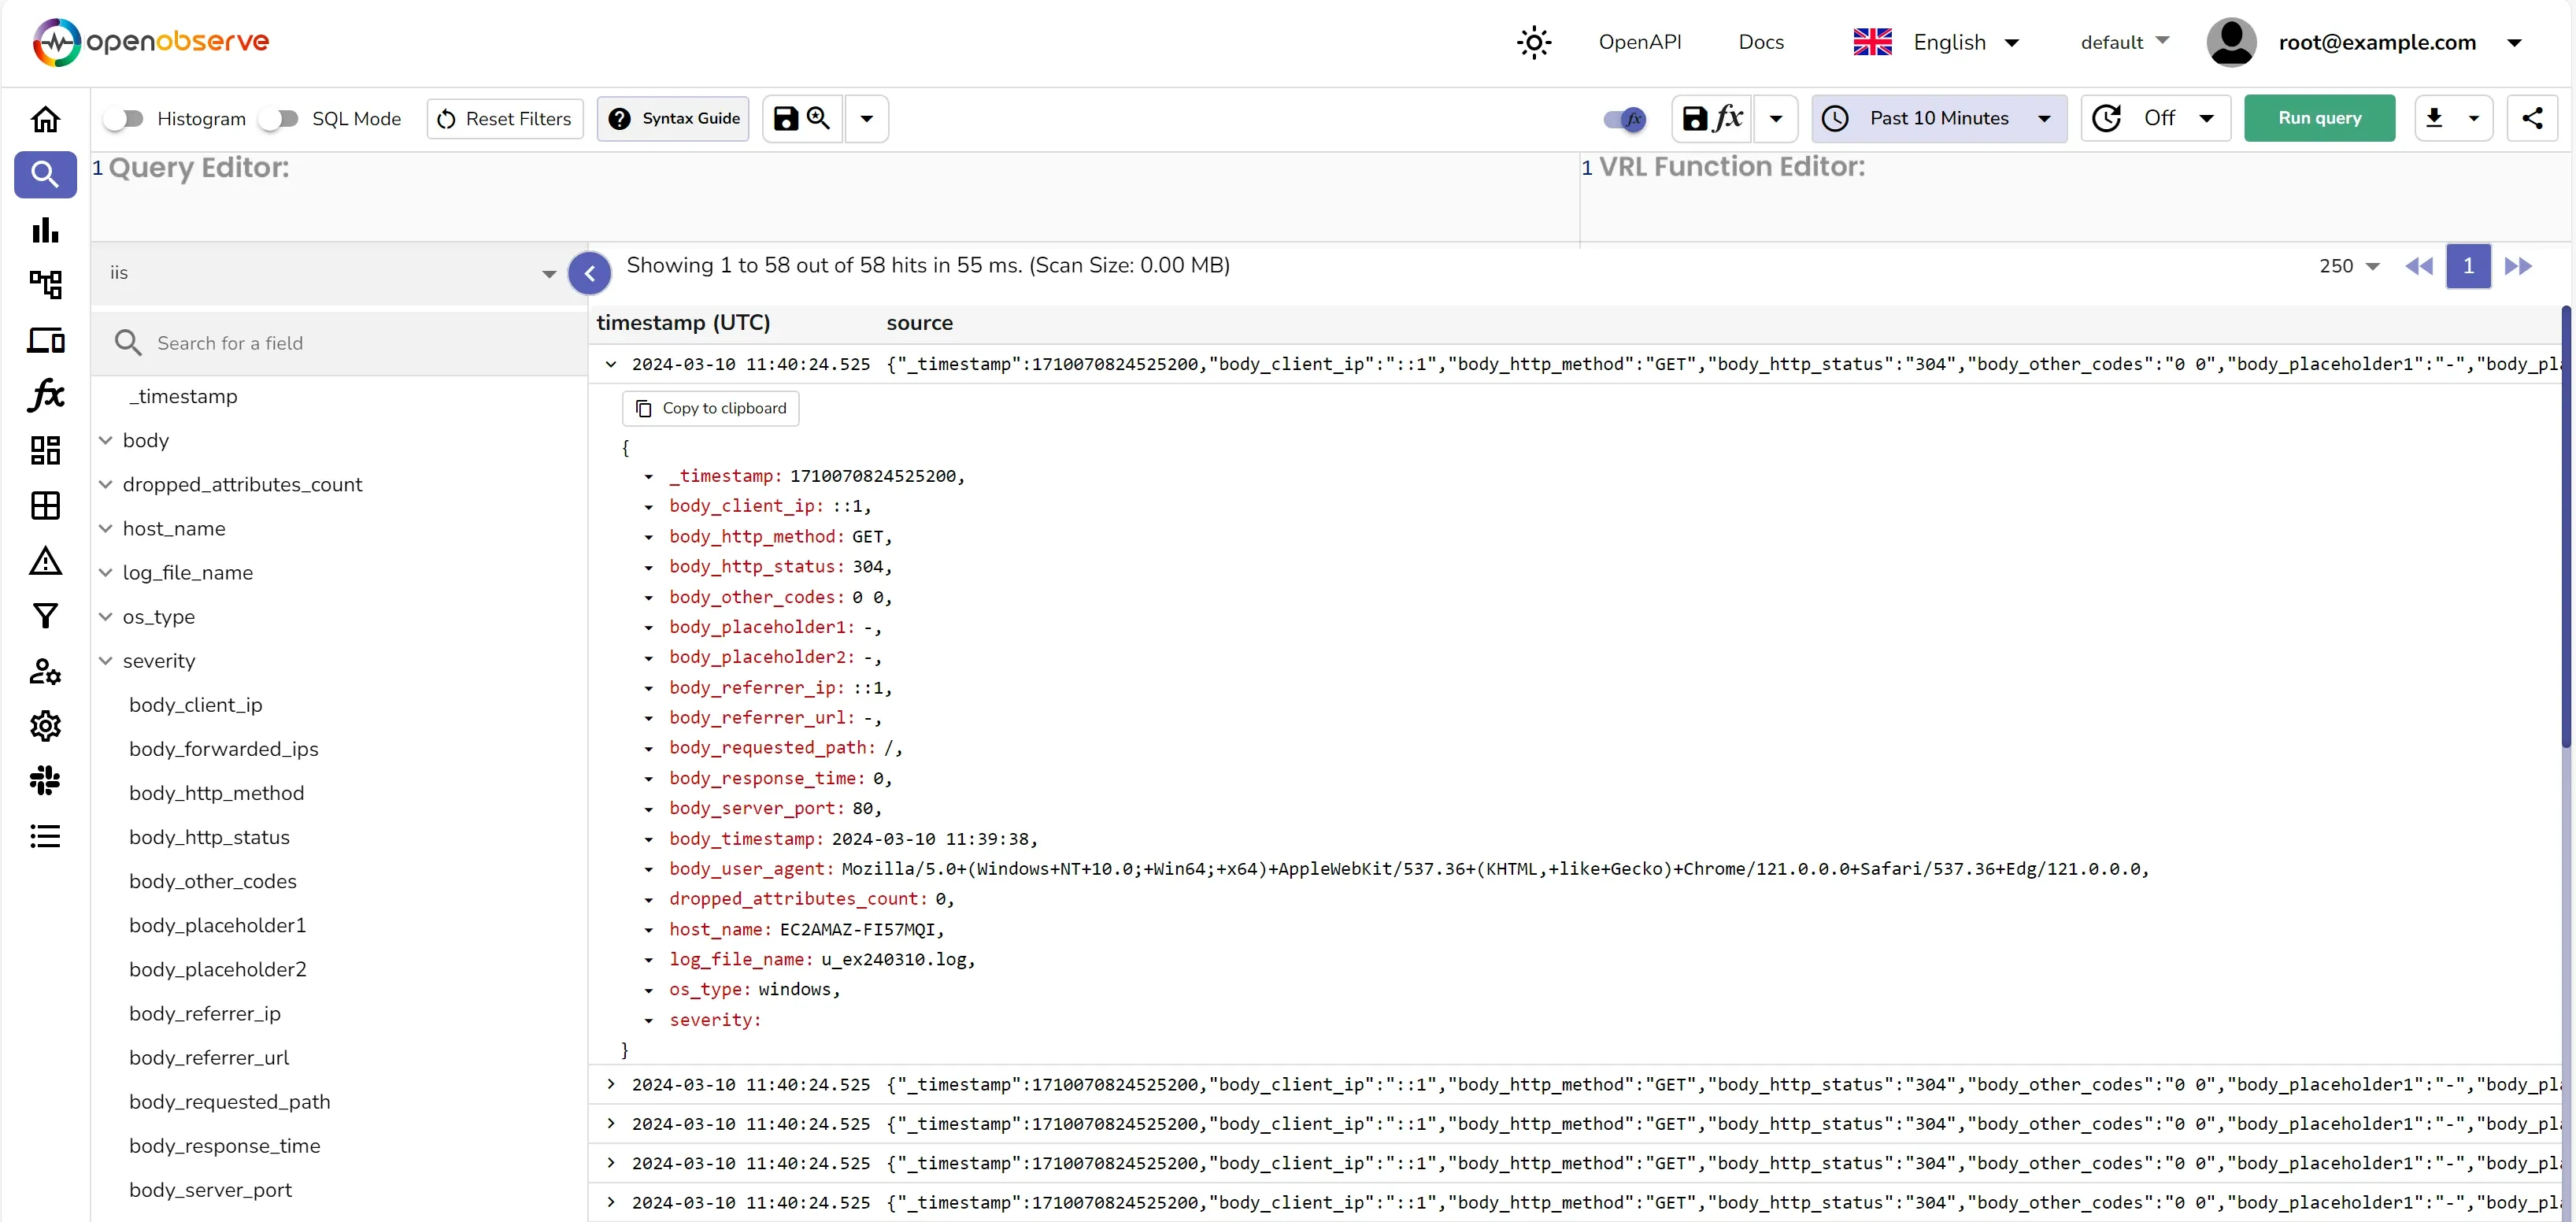
Once the logs are parsed, they should look like below:
{
  "_timestamp": 1710067224558454,
  "body_client_ip": "::1",
  "body_forwarded_ips": null,
  "body_http_method": "GET",
  "body_http_status": "304",
  "body_other_codes": "0 0",
  "body_placeholder1": "-",
  "body_placeholder2": "-",
  "body_referrer_ip": "::1",
  "body_referrer_url": "-",
  "body_requested_path": "/",
  "body_response_time": "0",
  "body_server_port": "80",
  "body_timestamp": "2024-03-10 10:39:34",
  "body_user_agent": "Mozilla/5.0+(Windows+NT+10.0;+Win64;+x64)+AppleWebKit/537.36+(KHTML,+like+Gecko)+Chrome/121.0.0.0+Safari/537.36+Edg/121.0.0.0",
  "dropped_attributes_count": 0,
  "host_name": "EC2AMAZ-FI57MQI",
  "log_file_name": "u_ex240310.log",
  "os_type": "windows",
  "severity": ""
}
You should save the VRL function and associate it to the stream. This will ensure that the logs are parsed and structured as they are ingested into OpenObserve.
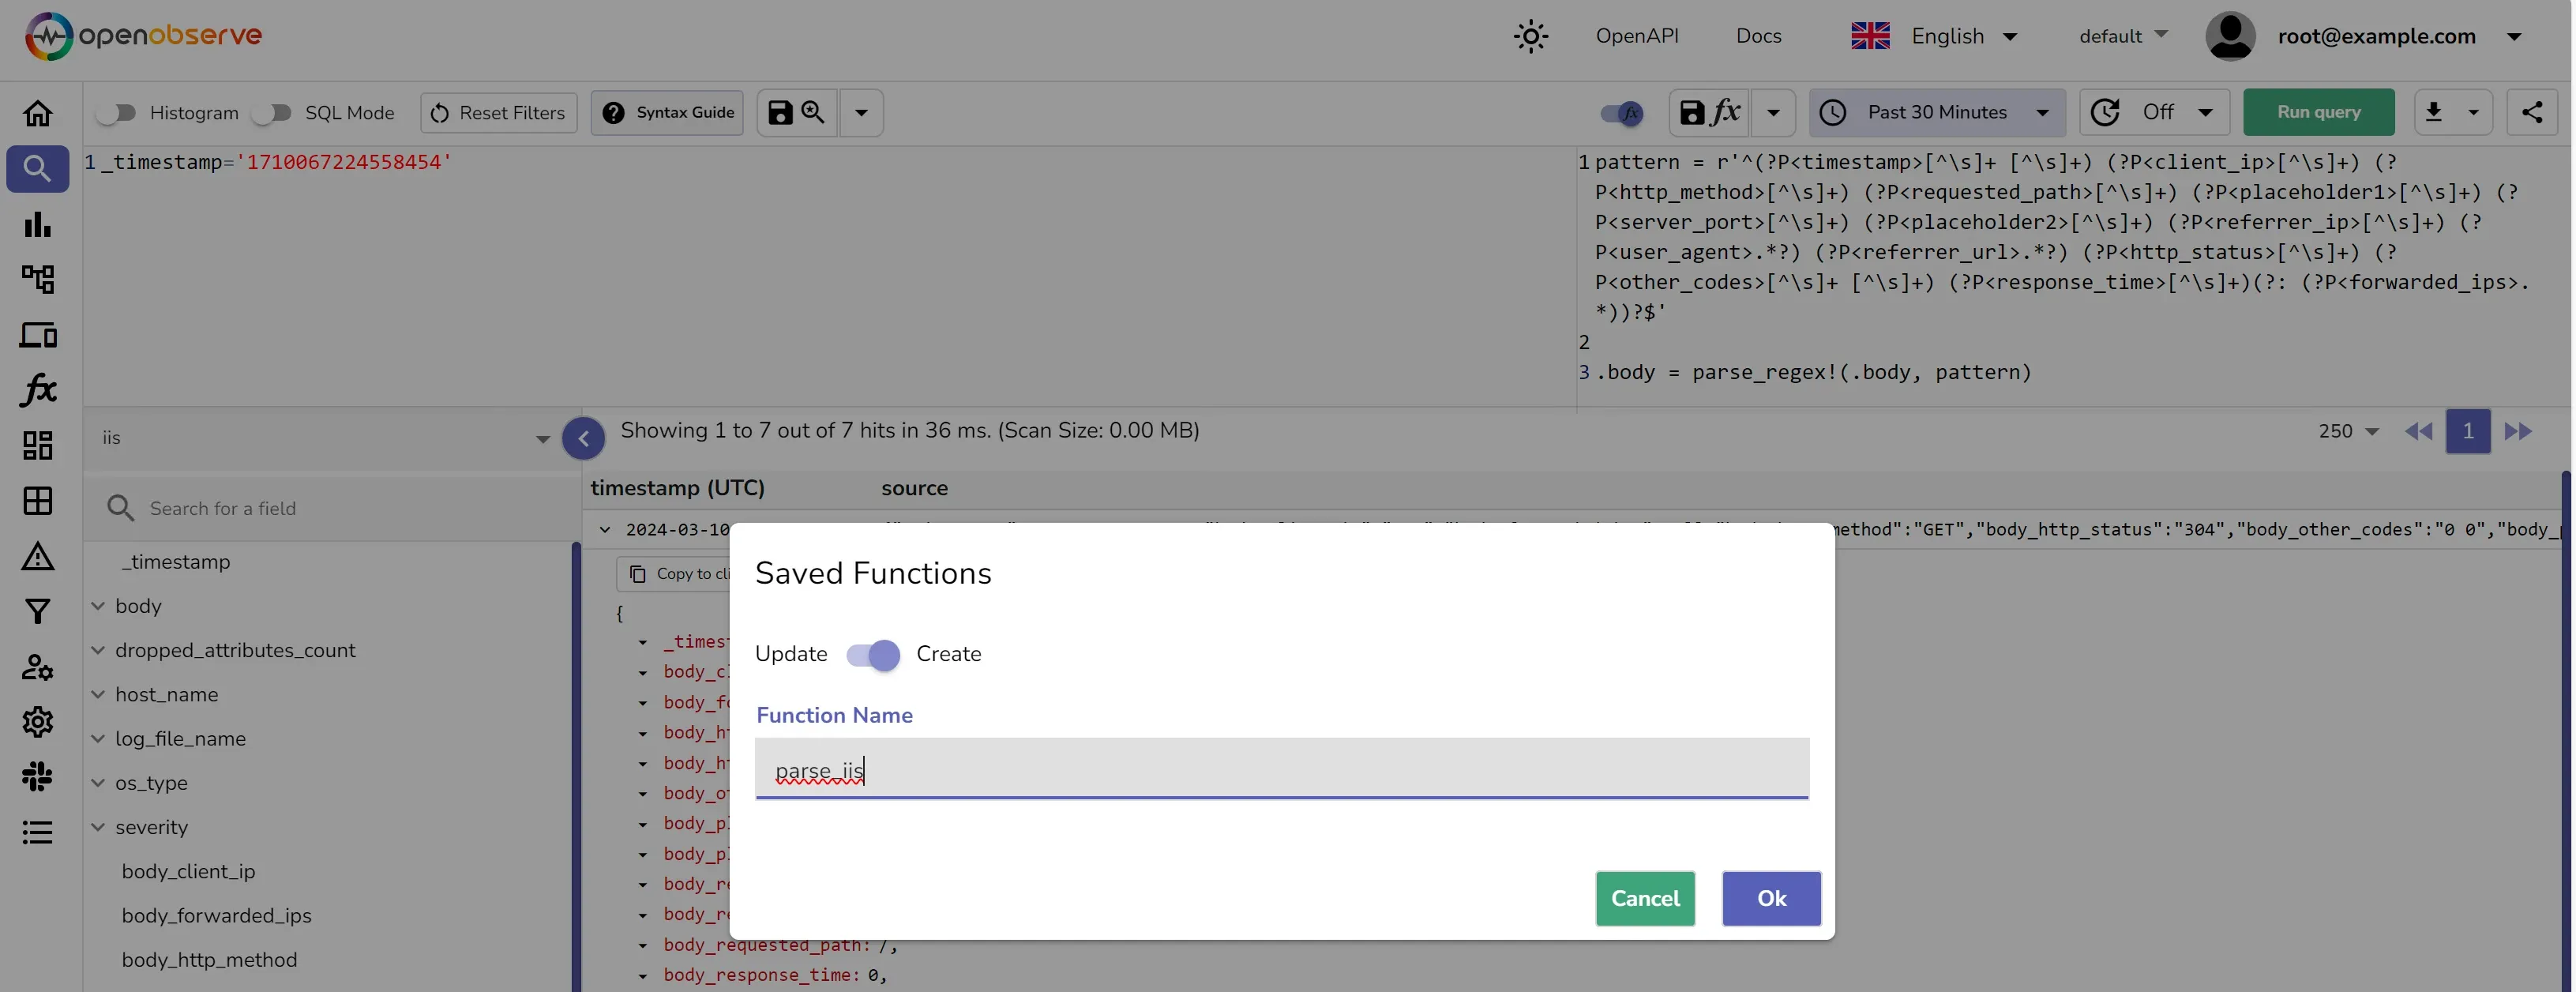
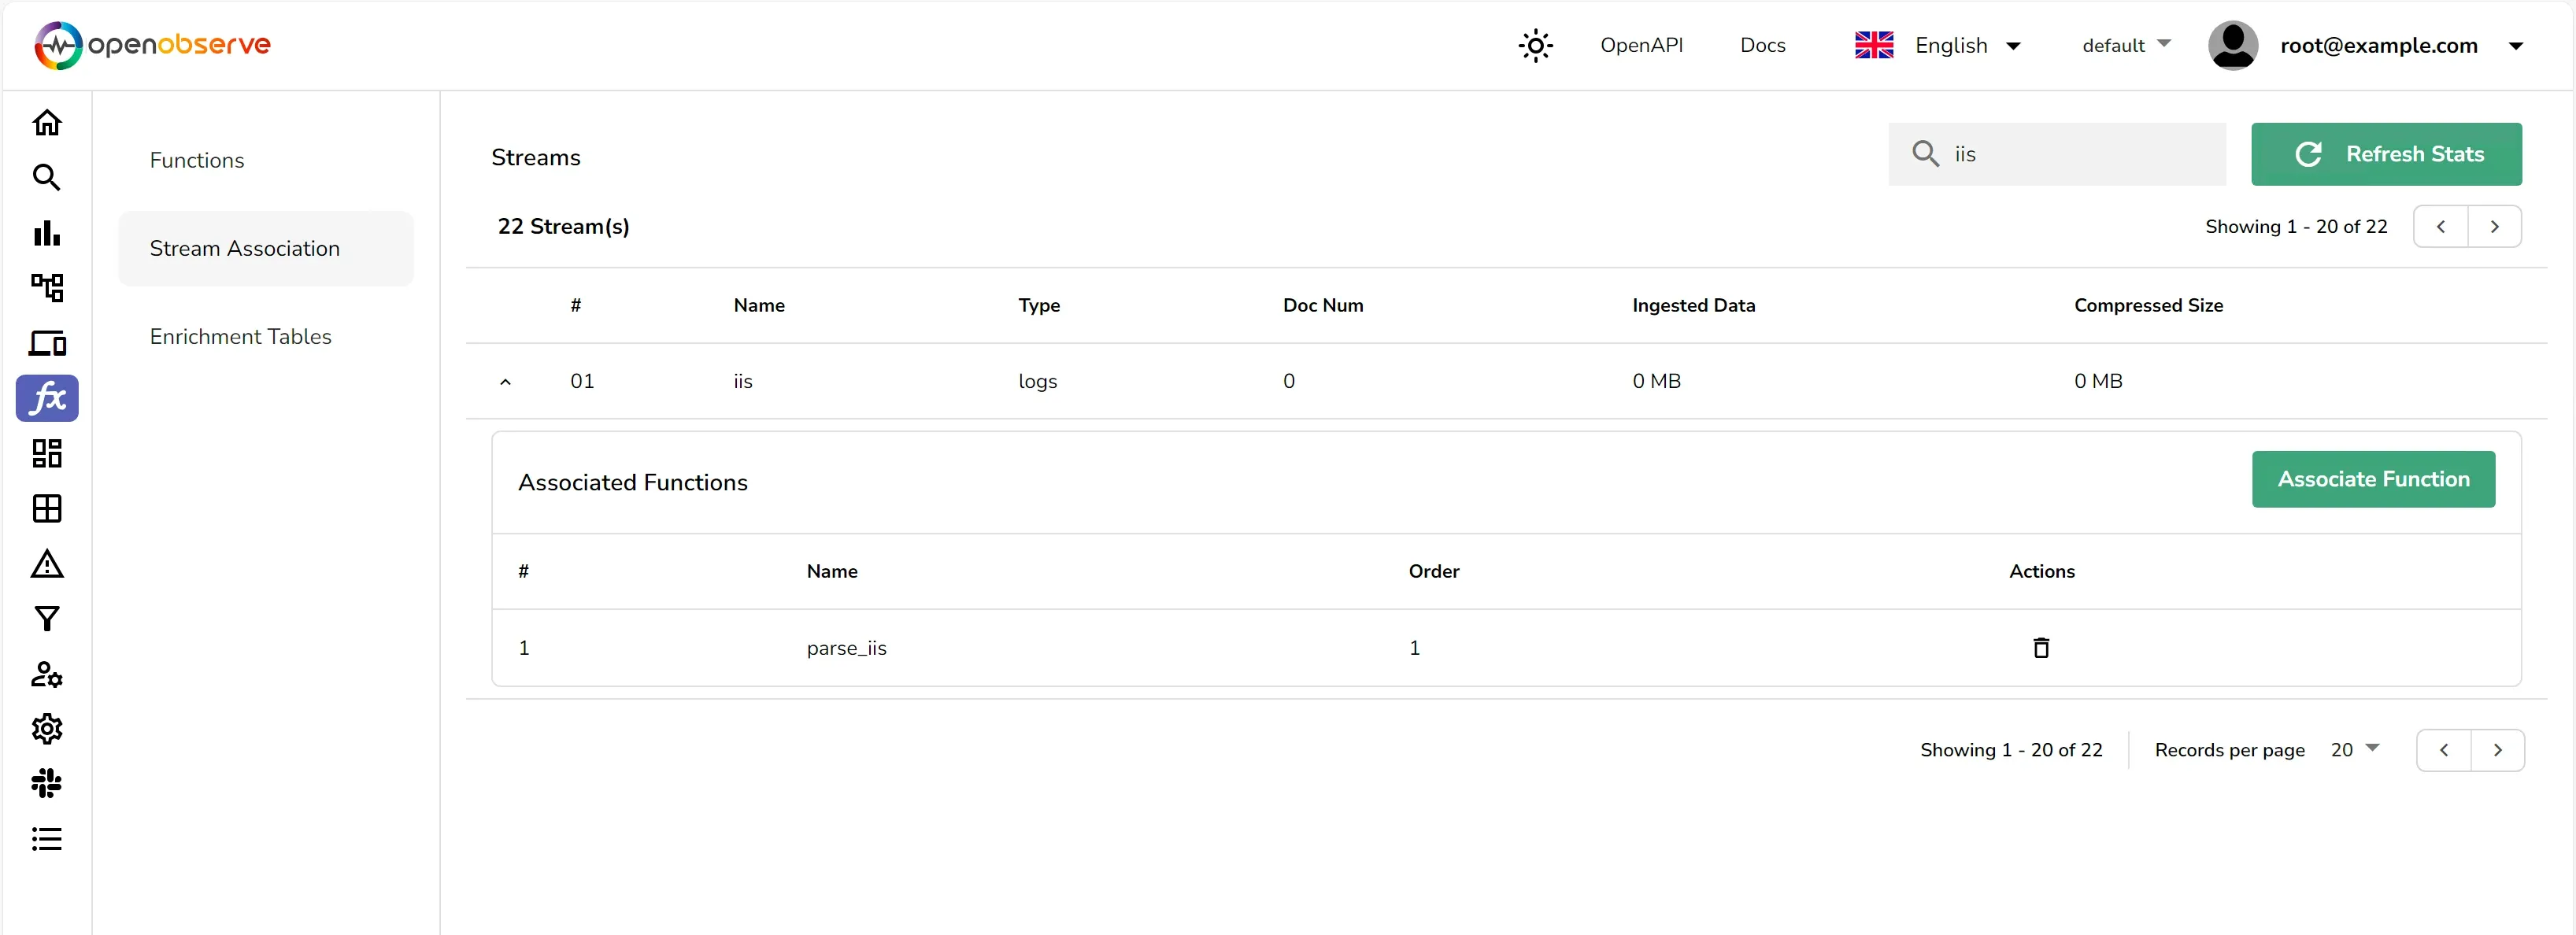
Once you have associated the function with the stream, the logs will be parsed and structured as they are ingested into OpenObserve.
With the logs now in OpenObserve, you can use dashboards and alerts to:
By leveraging the power of otel-collector and VRL, you can efficiently capture and send IIS logs to OpenObserve and parse them for comprehensive analysis. This approach allows you to gain deeper insights into your web applications, helping you to maintain performance and reliability. Remember to check the OpenTelemetry and Vector documentation for the most up-to-date instructions and configurations.
Prabhat Sharma is the founder of OpenObserve, bringing extensive expertise in cloud computing, Kubernetes, and observability. His interests also encompass machine learning, liberal arts, economics, and systems architecture. Outside of work, Prabhat enjoys spending quality time playing with his children.


