PHP Logging: Ingesting Monolog Data into OpenObserve for Better Monitoring

Chaitanya Sistla
March 26, 2025
7 min read
Don’t forget to share!
Try OpenObserve Cloud today for more efficient and performant observability.
This comprehensive guide demonstrates how to implement effective logging in PHP applications by integrating Monolog with OpenObserve. We'll explore a practical approach to structured logging that enhances application observability and simplifies troubleshooting.
The complete code for this tutorial is available on GitHub: openobserve/php-monolog
Let's walk through the key components of the repository:
Before we begin, make sure you have:
The project has a simple structure:
php-monolog/
├── src/
│   ├── index.php              # Main application entry point
│   └── config/
│       └── logging.php        # Logger configuration
├── logs/                      # Directory for local log files
├── composer.json              # Dependencies
└── .env                       # Environment configuration
The composer.json file defines our dependencies:
{
    "name": "openobserve/php-monolog",
    "description": "PHP OpenObserve Integration Example",
    "type": "project",
    "autoload": {
        "psr-4": {
            "App\\": "src/"
        }
    },
    "require": {
        "php": ">=8.0",
        "monolog/monolog": "^3.0",
        "guzzlehttp/guzzle": "^7.0",
        "vlucas/phpdotenv": "^5.5"
    }
}
The key packages we're using:
We use a .env file to store our OpenObserve connection details:
OPENOBSERVE_URL=https://your-openobserve-instance.com
OPENOBSERVE_USERNAME=your_username
OPENOBSERVE_PASSWORD=your_password
OPENOBSERVE_ORGANIZATION=default
OPENOBSERVE_STREAM=php_demo
This keeps our credentials separate from the code and makes it easy to configure different environments.
The heart of our project is the custom logging setup in src/config/logging.php:
<?php

require_once __DIR__ . '/../../vendor/autoload.php';

use Dotenv\Dotenv;
use Monolog\Logger;
use Monolog\Handler\StreamHandler;
use Monolog\Formatter\JsonFormatter;
use Monolog\Processor\IntrospectionProcessor;
use Monolog\Processor\WebProcessor;
use GuzzleHttp\Client;

// Load environment variables
$dotenv = Dotenv::createImmutable(dirname(__DIR__, 2));
$dotenv->load();

// Create a logger instance
$logger = new Logger('php-app');

// Add processors for additional context
$logger->pushProcessor(new IntrospectionProcessor());
$logger->pushProcessor(new WebProcessor());
$logger->pushProcessor(function ($record) {
    // Add a unique request ID to track requests across log entries
    $record->extra['request_id'] = $_SERVER['HTTP_X_REQUEST_ID'] ?? uniqid();
    return $record;
});

// Add local file handler (for backup)
$fileHandler = new StreamHandler(__DIR__ . '/../../logs/app.log', Logger::DEBUG);
$fileHandler->setFormatter(new JsonFormatter());
$logger->pushHandler($fileHandler);

// Custom handler for OpenObserve
class OpenObserveHandler extends \Monolog\Handler\AbstractProcessingHandler
{
    private $client;
    private $url;
    private $auth;
    private $organization;
    private $stream;

    public function __construct($level = Logger::DEBUG, $bubble = true)
    {
        parent::__construct($level, $bubble);

        $this->client = new Client();
        $this->url = $_ENV['OPENOBSERVE_URL'];
        $this->organization = $_ENV['OPENOBSERVE_ORGANIZATION'];
        $this->stream = $_ENV['OPENOBSERVE_STREAM'];
        $this->auth = base64_encode($_ENV['OPENOBSERVE_USERNAME'] . ':' . $_ENV['OPENOBSERVE_PASSWORD']);
    }

    // Monolog 3.x compatible write method
    protected function write(\Monolog\LogRecord $record): void
    {
        $endpoint = "{$this->url}/api/{$this->organization}/{$this->stream}/_json";

        // Create a properly structured log object
        $logData = [
            'timestamp' => $record->datetime->format(\DateTimeInterface::ISO8601),
            'level' => $record->level->name,
            'message' => $record->message,
            'channel' => $record->channel,
            'context' => $record->context,
            'extra' => $record->extra
        ];

        try {
            $this->client->post($endpoint, [
                'headers' => [
                    'Authorization' => 'Basic ' . $this->auth,
                    'Content-Type' => 'application/json'
                ],
                'json' => $logData  // Send as a single object
            ]);
        } catch (\Exception $e) {
            // Write to error log if sending to OpenObserve fails
            error_log('Failed to send log to OpenObserve: ' . $e->getMessage());
        }
    }
}

// Add OpenObserve handler
$openObserveHandler = new OpenObserveHandler();
$logger->pushHandler($openObserveHandler);

return $logger;
Our index.php file demonstrates different logging scenarios:
<?php
require_once __DIR__ . '/../vendor/autoload.php';
// Get the logger
$logger = require_once __DIR__ . '/config/logging.php';
function simulateApiCall($logger) {
$startTime = microtime(true);
$logger->info('Starting API call');
// Simulate some work
usleep(rand(100000, 500000));
$endTime = microtime(true);
$duration = ($endTime - $startTime) * 1000; // Convert to milliseconds
$logger->info('API call completed', [
'duration_ms' => $duration,
'endpoint' => '/api/example',
'method' => 'GET'
]);
return $duration;
}
function processUserData($logger, $userId) {
$logger->info('Processing user data', ['user_id' => $userId]);
try {
// Simulate potential error
if (rand(1, 10) > 8) {
throw new \Exception("Unable to retrieve user data for ID: $userId");
}
// Simulate database operation
usleep(rand(50000, 200000));
$logger->info('User data processed successfully', [
'user_id' => $userId,
'process_time_ms' => rand(20, 100)
]);
return true;
} catch (\Exception $e) {
$logger->error('Error processing user data', [
'exception' => $e->getMessage(),
'user_id' => $userId,
'trace' => $e->getTraceAsString()
]);
return false;
}
}
// Start application processing
$logger->info('Application started', [
'php_version' => PHP_VERSION,
'environment' => $_ENV['APP_ENV'] ?? 'development'
]);
// Simulate a user request
$userId = rand(1000, 9999);
$logger->info('User request received', [
'user_id' => $userId,
'request_path' => $_SERVER['REQUEST_URI'] ?? '/',
'ip_address' => $_SERVER['REMOTE_ADDR'] ?? '127.0.0.1'
]);
// Execute some business logic with logging
$apiCallDuration = simulateApiCall($logger);
$userDataProcessed = processUserData($logger, $userId);
// Log overall request performance
$logger->info('Request processing completed', [
'success' => $userDataProcessed,
'total_api_time_ms' => $apiCallDuration,
'memory_usage' => memory_get_usage(true),
'peak_memory' => memory_get_peak_usage(true)
]);
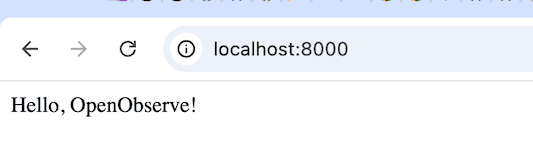
// Output a simple response to the browser
echo "Request processed. Check logs for details.";
To try it out yourself:
git clone https://github.com/openobserve/php-monolog.gitcomposer install.env file with your OpenObserve credentialsphp -S localhost:8000 -t src/
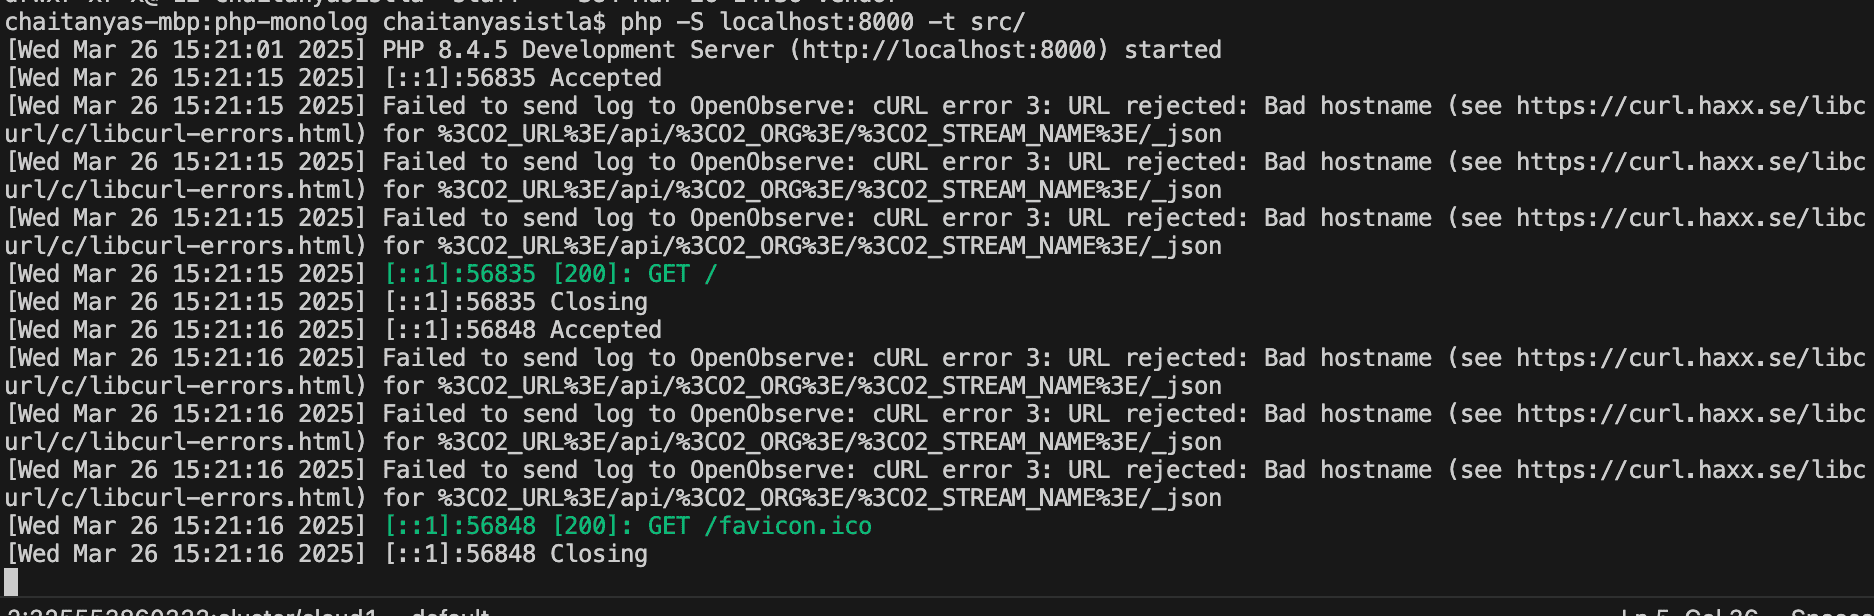
Once you've generated some logs, you can see them in your OpenObserve logs console under the stream you configured.
The most interesting part of this project is the custom OpenObserveHandler class that sends logs to OpenObserve:
class OpenObserveHandler extends \Monolog\Handler\AbstractProcessingHandler
{
    // Properties and constructor...

    protected function write(\Monolog\LogRecord $record): void
    {
        $endpoint = "{$this->url}/api/{$this->organization}/{$this->stream}/_json";

        // Create a properly structured log object
        $logData = [
            'timestamp' => $record->datetime->format(\DateTimeInterface::ISO8601),
            'level' => $record->level->name,
            'message' => $record->message,
            // ...
        ];

        // Send to OpenObserve
        $this->client->post($endpoint, [
            'headers' => [
                'Authorization' => 'Basic ' . $this->auth,
                'Content-Type' => 'application/json'
            ],
            'json' => $logData
        ]);
    }
}
This handler:
AbstractProcessingHandlerWe use Monolog processors to add extra context to our logs:
// Add processors for additional context
$logger->pushProcessor(new IntrospectionProcessor());
$logger->pushProcessor(new WebProcessor());
$logger->pushProcessor(function ($record) {
    $record->extra['request_id'] = $_SERVER['HTTP_X_REQUEST_ID'] ?? uniqid();
    return $record;
});
This gives us:
When implementing this yourself, watch out for:
Dependency Issues: Make sure all packages are installed with composer install
Monolog 3.x Compatibility: The handler's write() method needs to accept \Monolog\LogRecord objects, not arrays as in older versions:
// Correct for Monolog 3.x
protected function write(\Monolog\LogRecord $record): void

// Wrong (old Monolog 2.x style)
protected function write(array $record): void
To get the most out of your logs:
| Aspect | Without OpenObserve | With OpenObserve |
|---|---|---|
| Error Detection | Limited to server logs or manual reporting | Real-time error detection with detailed context |
| Troubleshooting | Time-consuming log file searching | Instant search across all application logs |
| Performance Analysis | Difficult to identify bottlenecks | Clear visualization of slow operations and trends |
| User Experience Issues | Often discovered through user complaints | Proactively identified through log pattern analysis |
| Resource Utilization | Limited visibility into system resources | Comprehensive monitoring of memory, CPU usage patterns |
| Security Monitoring | Basic error logs with limited context | Enhanced detection of unusual access patterns and potential breaches |
| Deployment Validation | Manual verification | Immediate visibility into post-deployment issues |
| Root Cause Analysis | Time-intensive log correlation | Rapid identification through connected request tracing |
Get Started with OpenObserve Today!
Sign up for a free trial of OpenObserve on our website. Check out our GitHub repository for self-hosting and contribution opportunities.
Happy logging!
Chaitanya Sistla is a Principal Solutions Architect with 17X certifications across Cloud, Data, DevOps, and Cybersecurity. Leveraging extensive startup experience and a focus on MLOps, Chaitanya excels at designing scalable, innovative solutions that drive operational excellence and business transformation.


