Learn how to implement distributed tracing in a Java Spring Boot microservices application using the OpenTelemetry Java Agent and OpenObserve. Covers zero-code auto-instrumentation, JVM metrics, cross-service trace propagation, flamegraphs, and Gantt charts , with working source code and curl examples.
Compare the best APM tools in 2026 with real pricing data, technical analysis, and use case guides. OpenObserve delivers 60-90% cost savings with unified observability for logs, metrics, traces, and APM.
Learn how to deploy OpenObserve on DigitalOcean with Kubernetes, Spaces, and managed PostgreSQL. Complete production-ready setup guide with Helm configuration.
Learn how to add complete observability to your microservices for distributed tracing without changing a single line of code. This hands-on demo shows auto-instrumentation across Go, Node.js, Java, Python, and .NET using OpenTelemetry and OpenObserve.
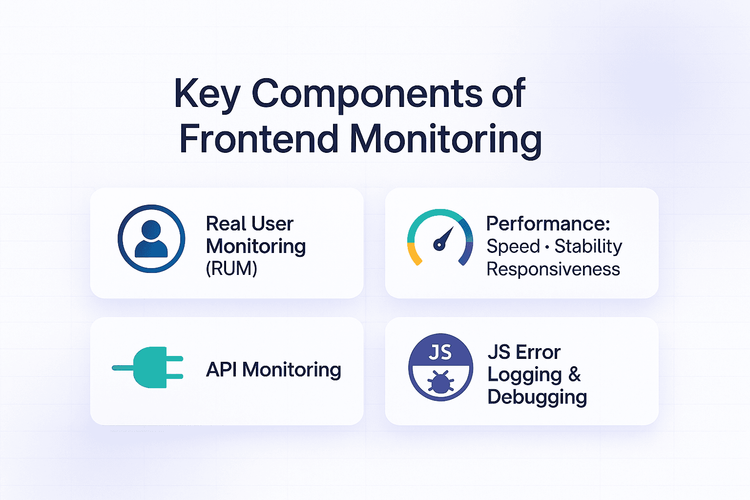
Learn frontend monitoring basics: RUM, performance metrics, error logging, and SEO impact. See how OpenObserve unifies monitoring in one platform.
Improve reliability and UX: 6 best practices for web app monitoring with OpenObserve: RED KPIs, RUM/API/infra, SQL alerts, continuous monitoring, DevOps.
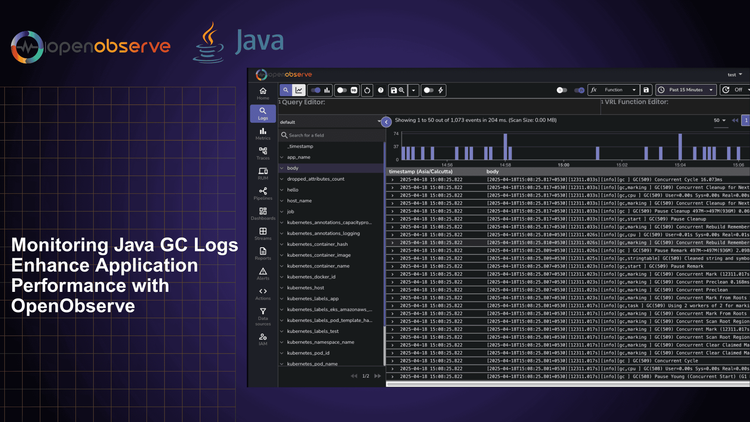
Learn how to leverage Java GC logs to diagnose memory issues, optimize application performance, and prevent production outages. This guide explains how to interpret GC log patterns and use OpenObserve for practical monitoring and analysis.
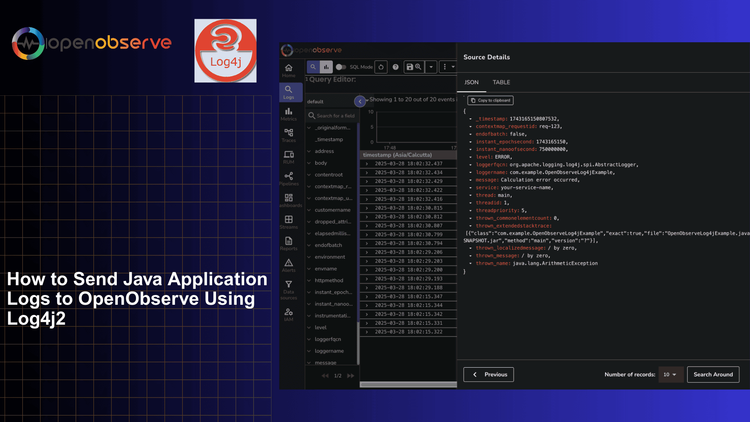
A comprehensive guide to configuring Log4j2 to send structured logs to OpenObserve for centralized logging and analysis of Java applications.
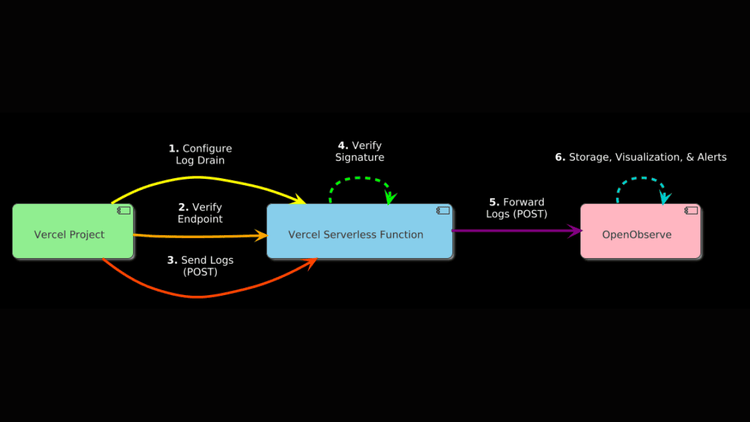
Learn how to set up Vercel Log Drains to seamlessly send logs to OpenObserve using a serverless function.
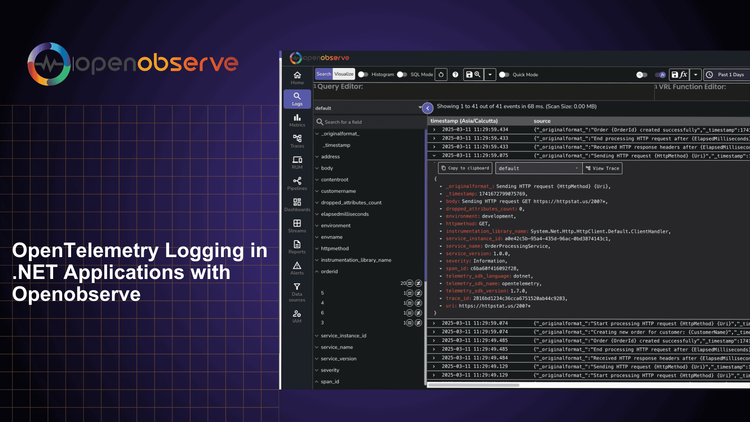
Learn how to implement OpenTelemetry logging in .NET applications using OpenObserve. Step-by-step guide to configure, collect, and analyze logs.
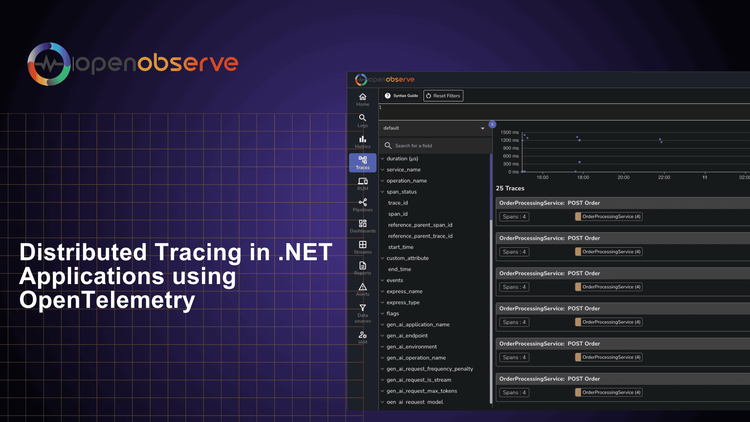
Learn how to implement distributed tracing in your .NET applications using OpenTelemetry. This guide covers the benefits of distributed tracing, how to get started with OpenTelemetry, and best practices for implementation.
Learn how to implement distributed tracing in Go applications using OpenTelemetry. This comprehensive guide covers auto and manual instrumentation, correlating traces, metrics, and logs, and visualizing data in OpenObserve for complete observability.
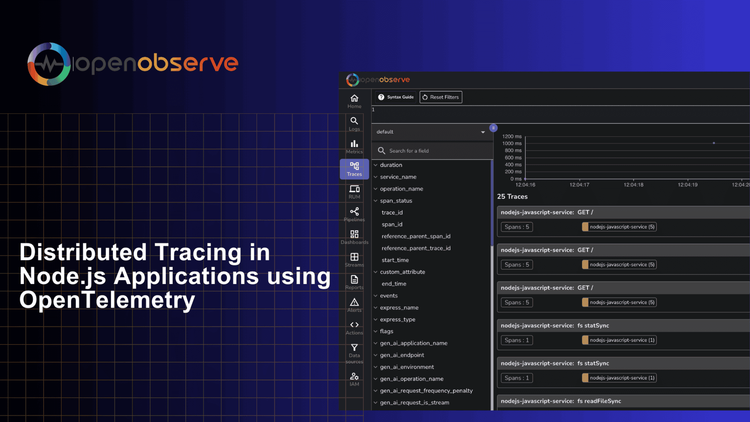
Learn how to implement distributed tracing in your Node.js applications using OpenTelemetry. Complete guide covering auto & manual instrumentation, trace visualization, and monitoring with OpenObserve.
Enhance your understanding of error handling in Python with OpenTelemetry. This detailed guide offers step-by-step instructions to use Global Error Handler in Otel Python SDK.
This blog helps you in getting started with monitoring FastAPI python application with OpenTelemetry and OpenObserve.
Learn how to send Pino logs to OpenObserve using the @openobserve/pino-openobserve npm library. This comprehensive guide provides step-by-step instructions, including setting up the project, configuring OpenObserve integration, and observing logs in OpenObserve.
Sending logs from NodeJS application to OpenObserve using Pino is easy. This blog is a step by step guide to do that.