What You Need to Know About Prometheus Metrics: Architecture, Collection, and Optimization for Scalable Observability

Chaitanya Sistla
November 12, 2024
11 min read
Don’t forget to share!
Try OpenObserve Cloud today for more efficient and performant observability.
Monitoring and observability have become critical aspects of modern DevOps and SRE practices. Prometheus, one of the most popular open-source monitoring solutions, has proven invaluable in enabling real-time monitoring, alerting, and data visualization. In this guide, we’ll explore the full workflow of Prometheus metrics, from setting up Prometheus to ingesting data, processing it, and visualizing it. By the end of this guide, you’ll have a clear understanding of how to integrate and leverage Prometheus metrics for observability in your system.
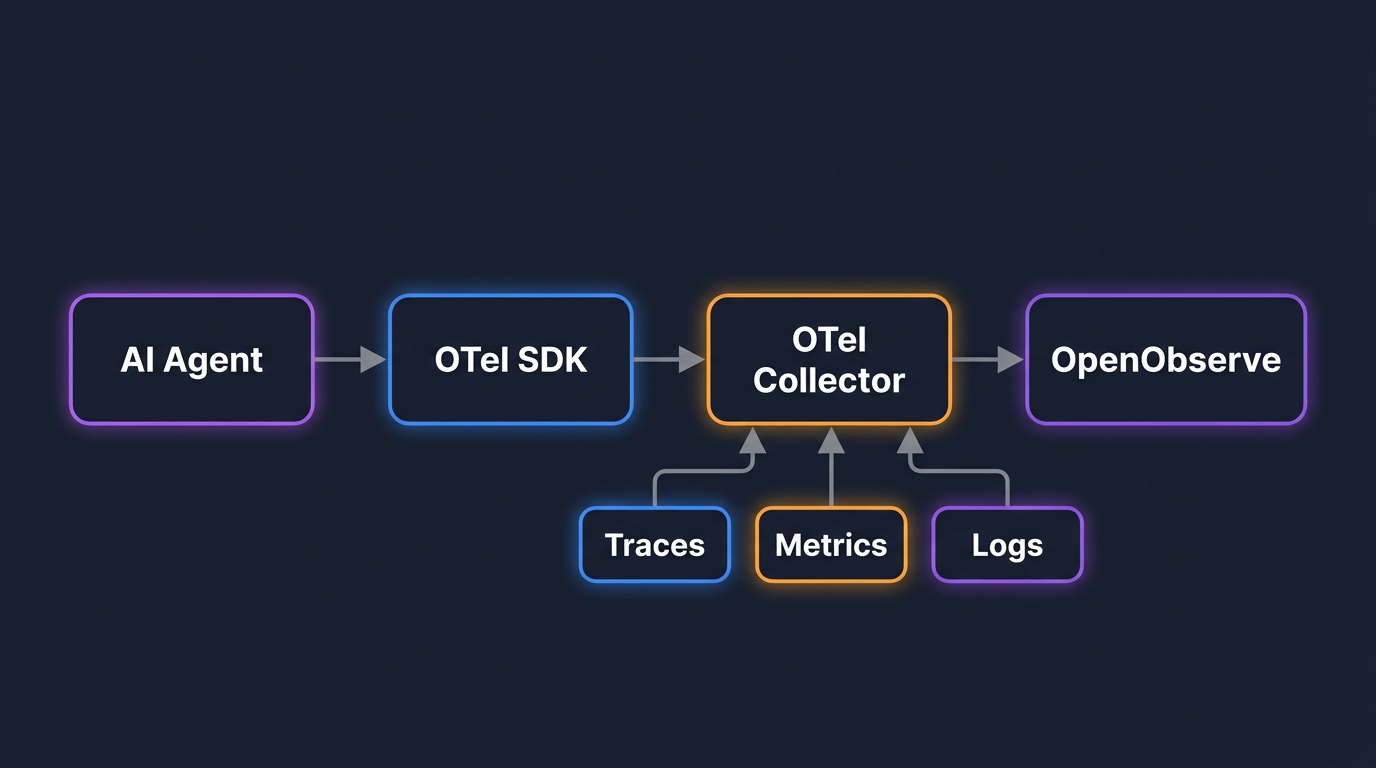
To understand Prometheus fully, it’s essential to explore its architecture and how each component contributes to its functionality.
Prometheus collects metrics by scraping endpoints at configured intervals. The data is then stored in a time-series database, which supports a variety of operations, including aggregations and mathematical computations. Prometheus uses PromQL to query stored data and analyze system performance.
In Prometheus, exporters are used to gather metrics from various sources, such as system hardware, applications, and databases, exposing them in a format that Prometheus can read and scrape.
Node Exporter is commonly used to gather system-level metrics like CPU, memory, and disk usage. Here’s how to set it up:
wget https://github.com/prometheus/node_exporter/releases/download/v1.2.2/node_exporter-1.2.2.linux-amd64.tar.gz
tar -xvf node_exporter-1.2.2.linux-amd64.tar.gz
cd node_exporter-1.2.2.linux-amd64
./node_exporter
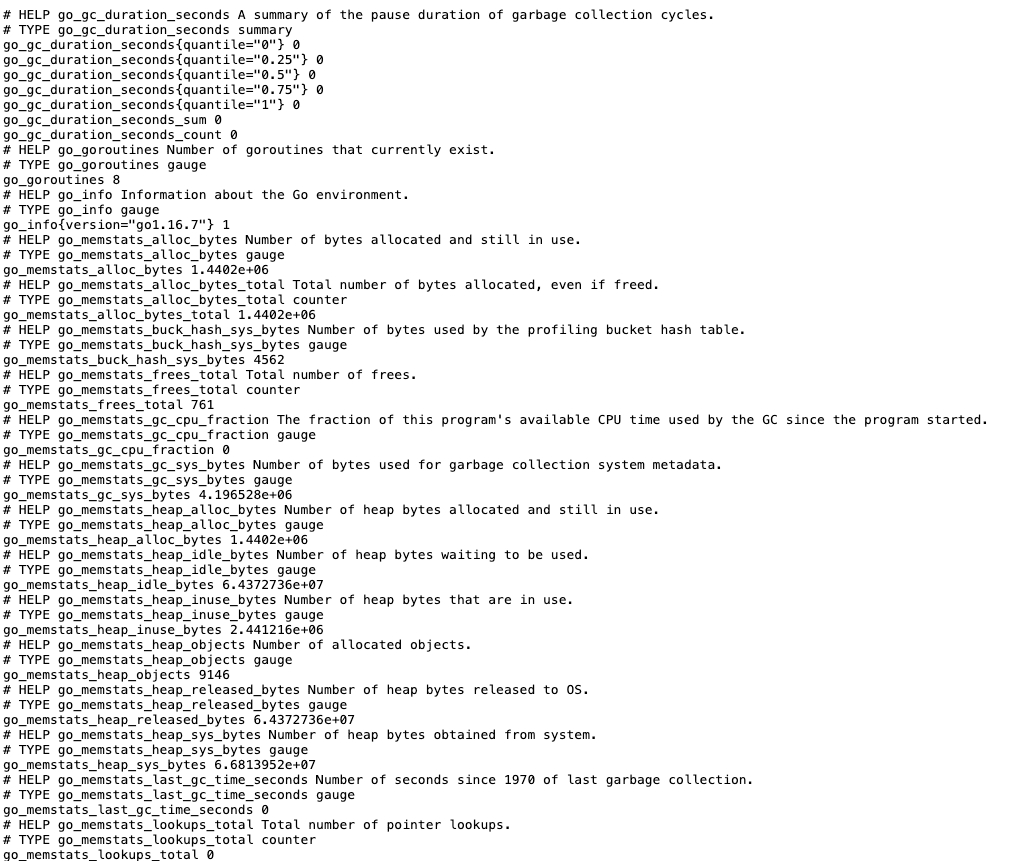
Node Exporter, by default, exposes metrics at localhost:9100/metrics
prometheus.yml to include Node Exporter as a scrape target in the same directory:global:
scrape_interval: 15s # Set the default scrape interval
scrape_configs:
- job_name: 'prometheus'
static_configs:
- targets: ['localhost:9090']
- job_name: 'node_exporter'
static_configs:
- targets: ['localhost:9100']
This configuration instructs Prometheus to scrape metrics from Node Exporter at localhost:9100.
To monitor specific aspects of an application’s performance, you can instrument custom metrics within your application. Below is an example using Python.
pip install prometheus_client
from prometheus_client import start_http_server, Counter, Gauge
import time
import random

REQUEST_COUNTER = Counter('app_request_count', 'Number of requests received')
REQUEST_LATENCY = Gauge('app_request_latency_seconds', 'Latency of requests in seconds')

def process_request():
    REQUEST_COUNTER.inc()
    with REQUEST_LATENCY.time():
        time.sleep(random.uniform(0.1, 1.0))

if __name__ == '__main__':
    start_http_server(8000)  # Start a Prometheus metrics endpoint
    while True:
        process_request()
python your_script.py
prometheus.yml to include your application as a scrape targetscrape_configs:
- job_name: 'my_python_app'
static_configs:
- targets: ['localhost:8000']
Prometheus is perfect for quick, real-time metrics, but as systems grow, storing, scaling, and analyzing long-term data becomes more challenging. OpenObserve steps in as a powerful companion, allowing you to keep Prometheus metrics over a longer period and scale effortlessly without complex setups or storage limitations. By sending metrics from Prometheus to OpenObserve, you retain the flexibility of Prometheus for instant monitoring while gaining a scalable backend for deeper, historical insights and advanced analytics.
With OpenObserve, your observability stack is ready to scale alongside your infrastructure, ensuring smooth, reliable performance as your systems grow.
Once your system and application metrics are configured, you can set up Remote Write in Prometheus to send these metrics directly to OpenObserve for centralized visualization and long-term storage.
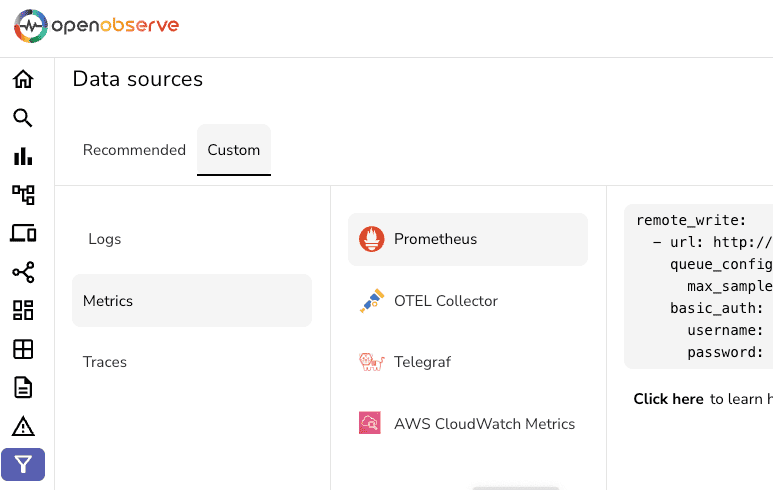
To send data to OpenObserve, add a remote_write section in prometheus.yml:
remote_write:
  - url: https://<openobserve_host>/api/<org_name>/prometheus/api/v1/write
    queue_config:
      max_samples_per_send: 10000
    basic_auth:
      username: <openobserve_user>
      password: <openobserve_password>
max_samples_per_send) of metrics sent to OpenObserve, helping manage throughput.wget https://github.com/prometheus/prometheus/releases/download/v2.30.3/prometheus-2.30.3.linux-amd64.tar.gz
tar -xvf prometheus-2.30.3.linux-amd64.tar.gz
cd prometheus-2.30.3.linux-amd64
./prometheus --config.file=prometheus.yml
With metrics ingested into OpenObserve, you can now use its visualization tools to create insightful dashboards and analyze data. Here’s a step-by-step guide for setting up and customizing these visualizations.
Here are a few examples of commonly used panels with corresponding queries.
Metric: app_request_count
Visualization: Select a line or bar chart to show the count over time.
Metric: app_request_latency_seconds
Query: Use an aggregation function to show average latency over time.
Visualization: Use a gauge or time series chart.
Metric: node_cpu_seconds_total
Query: rate(node_cpu_seconds_total[5m]) by (instance)
Visualization: Use a line chart to show CPU usage trends by instance.
Metric: node_memory_MemAvailable_bytes
Query: node_memory_MemAvailable_bytes / node_memory_MemTotal_bytes
Visualization: Display memory usage over time with a line chart.
Metric: node_filesystem_free_bytes
Query: (node_filesystem_size_bytes - node_filesystem_free_bytes) / node_filesystem_size_bytes
Description: Monitors disk usage as a percentage of the total available disk space. This is essential for tracking storage capacity and avoiding potential disk saturation.
Visualization: Use a line or area chart to track disk usage over time, with critical usage thresholds highlighted.
Metric: node_network_receive_bytes_total and node_network_transmit_bytes_total
Query:
rate(node_network_receive_bytes_total[5m])rate(node_network_transmit_bytes_total[5m])Description: Tracks network traffic, showing both incoming and outgoing data in bytes per second. This helps detect network bottlenecks and monitor bandwidth usage.
Visualization: Use a dual-axis line chart or two separate line charts to distinguish between received and transmitted data.
Metric: node_load1, node_load5, node_load15
Query: Use node_load1, node_load5, and node_load15 directly to show 1-minute, 5-minute, and 15-minute CPU load averages.
Description: Provides insight into CPU load trends over different time frames, helping to identify periods of high CPU usage and assess system load.
Visualization: Use a line chart with multiple series for each load metric to compare short-term and long-term CPU load averages.
Metric: node_memory_MemAvailable_bytes and node_memory_MemTotal_bytes
Query: (node_memory_MemTotal_bytes - node_memory_MemAvailable_bytes) / node_memory_MemTotal_bytes
Description: Tracks the percentage of memory currently in use. High memory usage over time can indicate the need for additional resources or optimizations.
Visualization: Use a line chart or gauge to show memory usage over time, with thresholds for low, moderate, and high memory usage.
Metric: node_context_switches_total
Query: rate(node_context_switches_total[5m])
Description: Counts the rate of context switches per second, which can help monitor CPU scheduling. A high rate of context switches may indicate heavy multitasking or performance bottlenecks.
Visualization: Use a line chart to track context switches over time, identifying any unusual spikes that could signify performance issues.
Metric: node_time_seconds and node_boot_time_seconds
Query: node_time_seconds - node_boot_time_seconds
Description: Calculates the node's uptime by subtracting the boot time from the current system time. Useful for tracking system reliability and uptime compliance.
Visualization: Use a single-value chart showing total uptime in hours, days, or weeks, depending on the length of operation.
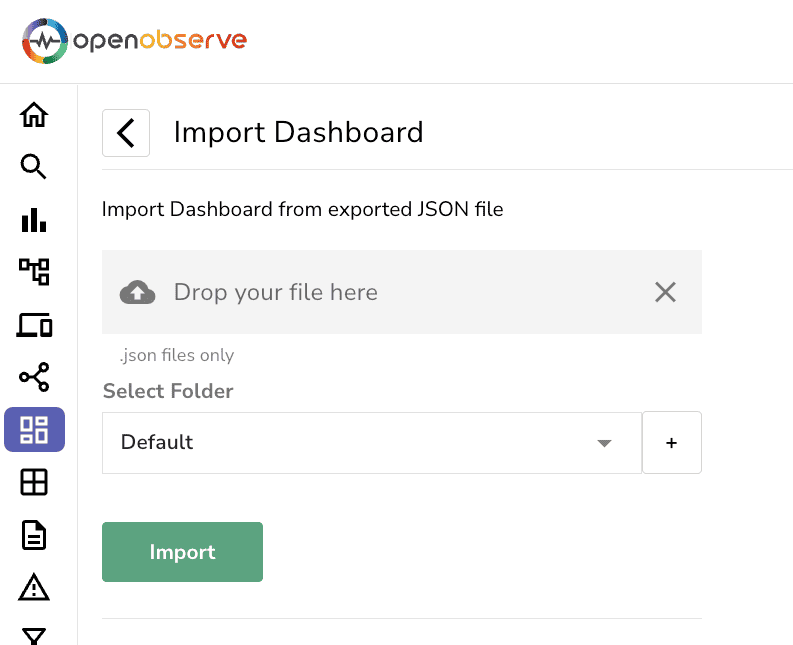
To make it easier to set up, here is an attached JSON file that you can import directly into your OpenObserve dashboard. This file includes pre-configured panels for each of the metrics described above, allowing you to get started with node-level monitoring quickly and efficiently.
This will set up a complete node-level monitoring dashboard with metrics ready to go! Let me know if you need the JSON file tailored further.
OpenObserve supports alerts, enabling you to set thresholds on critical metrics. For example, you can set an alert for high memory usage:
node_memory_MemAvailable_bytes metric to monitor available memory.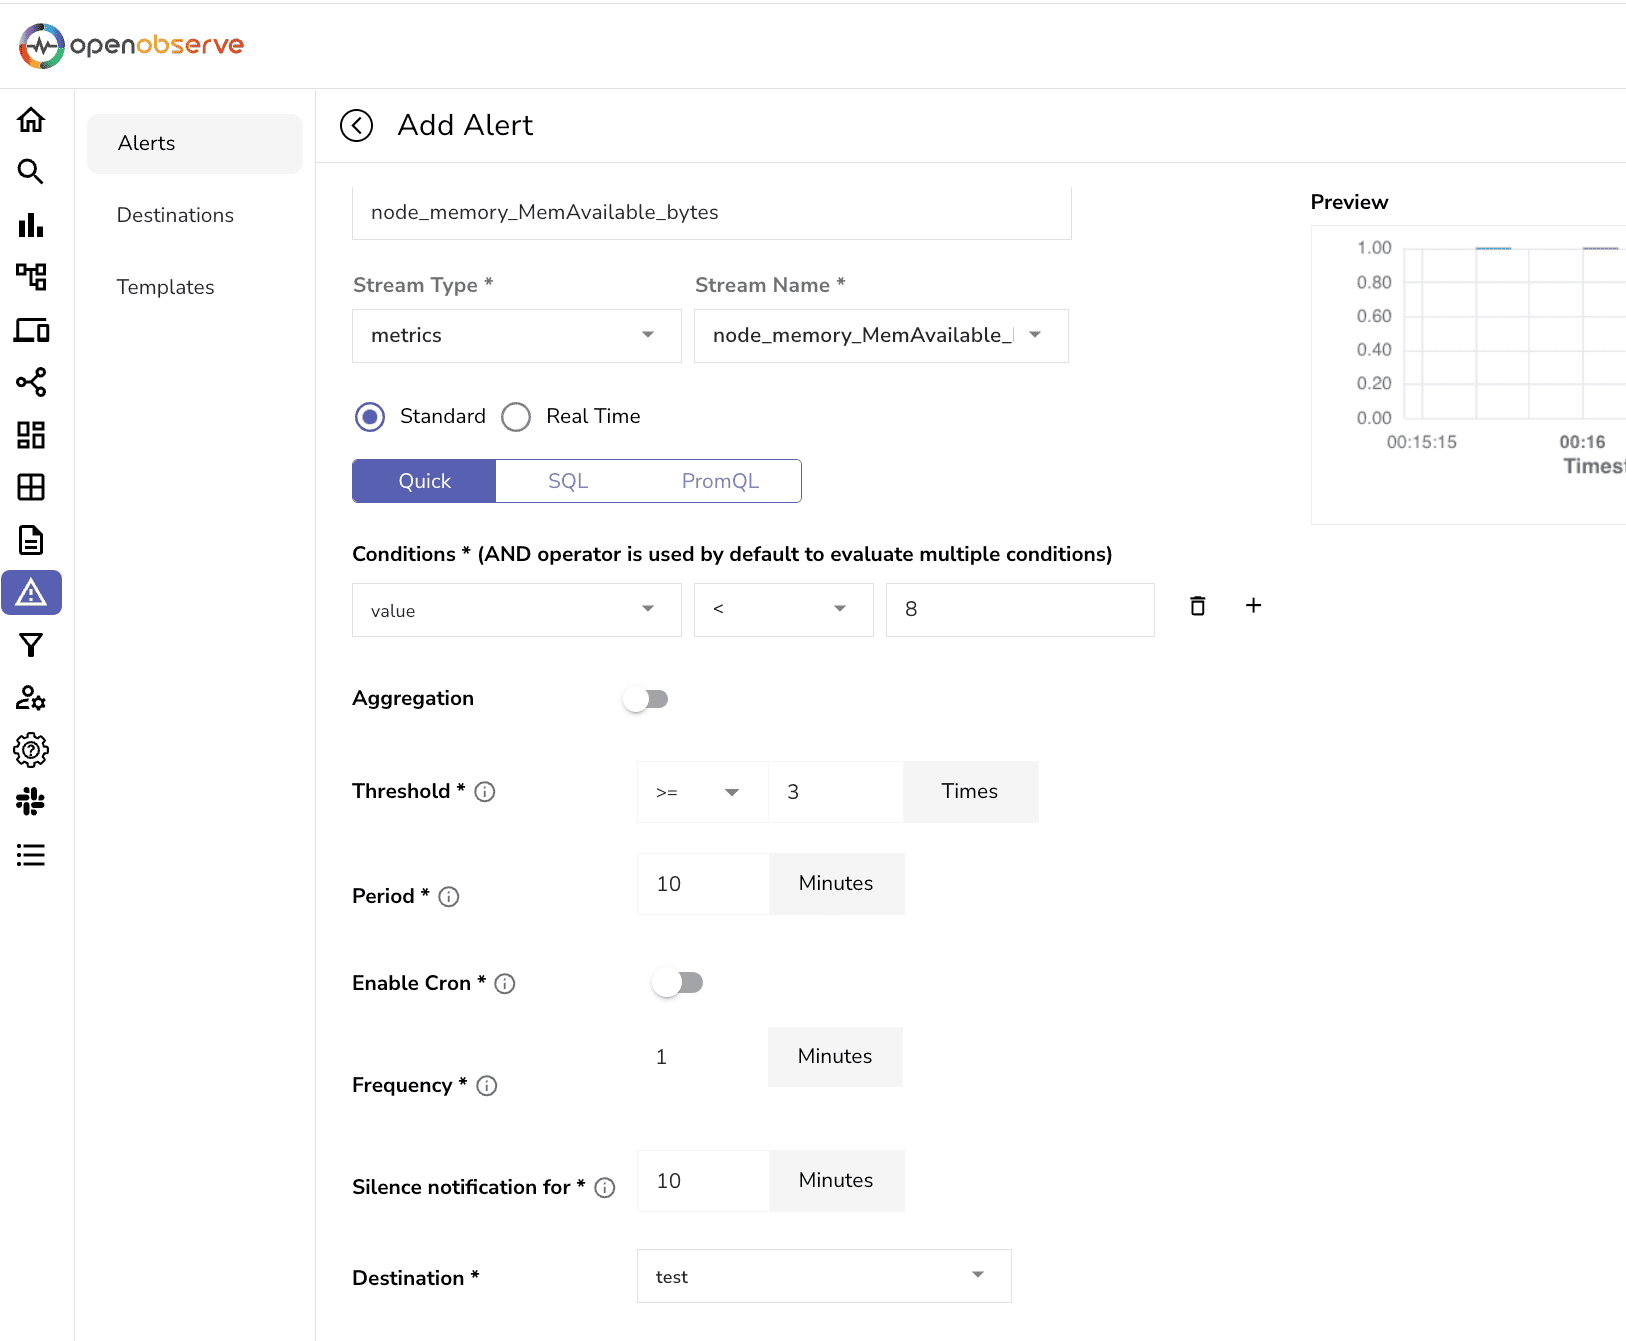
Optimizing your Prometheus setup is essential for efficient metrics management and powerful monitoring of application and infrastructure health. By implementing best practices like tuning scrape intervals, managing label cardinality, and tracking Prometheus health metrics, you ensure scalable and insightful observability. This approach helps maintain system stability and supports proactive improvements, making your Prometheus monitoring both effective and future-ready.
| Best Practice | Description | Benefit |
|---|---|---|
| Optimize Scrape Intervals | Set appropriate scrape intervals to balance data granularity with system load. Adjust intervals based on the metric’s importance and frequency of change. | Reduces system load, avoids data overload, and maintains relevant metrics without excessive detail. |
| Manage Label Cardinality | Limit the number of unique label combinations (cardinality) to prevent excessive memory and CPU use. Avoid using high-cardinality labels (e.g., UUIDs). | Enhances performance, reduces memory usage, and prevents excessive data ingestion costs. |
| Use Remote Write for Long-Term Storage | Configure Prometheus to send data to OpenObserve using Remote Write, ensuring that older metrics are stored efficiently outside of Prometheus’ local storage. | Extends data retention, reduces local storage pressure, and enables long-term trend analysis. |
| Implement Recording Rules | Define recording rules for frequently queried metrics, and precomputing results to avoid redundant calculations at query time. | Speeds up query performance, reduces load on Prometheus, and improves user experience. |
| Monitor Prometheus Health Metrics | Track Prometheus’s own health metrics (e.g., memory usage, CPU, scrape duration) to proactively manage and scale the Prometheus instance as needed. | Prevents performance bottlenecks, enables proactive troubleshooting, and ensures reliable monitoring. |
| Centralize Metrics in OpenObserve | Aggregate and visualize metrics in OpenObserve, allowing for enhanced analytics, dashboards, and alerting across Prometheus, Node Exporter, and other sources. | Provides a centralized observability platform, improving insights and simplifying management tasks. |
| Automate Alerts and Notifications | Set up alerts for key metrics and system performance thresholds to catch issues early, preventing downtime or degradation. | Enhances response time, prevents downtime, and supports proactive system management. |
| Balance Retention Policies with Data Needs | Adjust Prometheus data retention based on operational needs and data utility, ensuring only necessary data is retained. | Optimizes storage costs, maintains data relevancy, and reduces unnecessary data accumulation. |
Ready to take your observability to the next level? OpenObserve offers a seamless platform for visualizing and storing Prometheus metrics long-term, all in one place. Start your journey with OpenObserve today to centralize your metrics, streamline data retention, and enhance your monitoring capabilities.
Get started with OpenObserve now and unlock powerful insights into your systems!
Chaitanya Sistla is a Principal Solutions Architect with 17X certifications across Cloud, Data, DevOps, and Cybersecurity. Leveraging extensive startup experience and a focus on MLOps, Chaitanya excels at designing scalable, innovative solutions that drive operational excellence and business transformation.