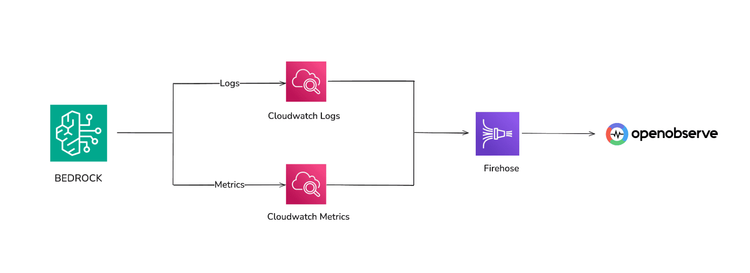
Learn how to monitor AWS Bedrock with CloudWatch, Kinesis Firehose, and OpenObserve. Track latency, errors, token usage, and model performance in real-time.
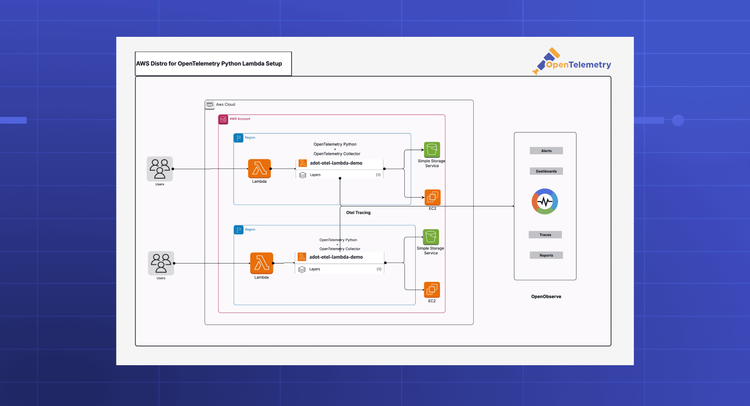
Learn how to implement distributed tracing for AWS Lambda using the AWS Distro for OpenTelemetry (ADOT) layer. This step-by-step guide shows you how to automatically capture traces from AWS SDK calls and send them to OpenObserve without writing any instrumentation code. Get full visibility into your serverless applications with open standards.
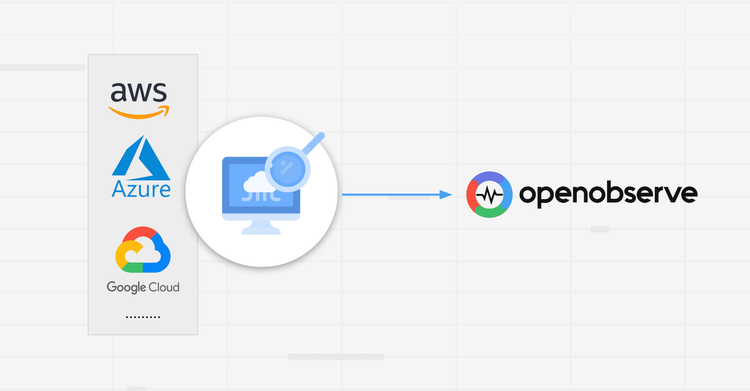
Discover how to monitor cloud resources effectively. Use OpenObserve to analyze logs, metrics, and traces for better visibility, alerts, and performance.
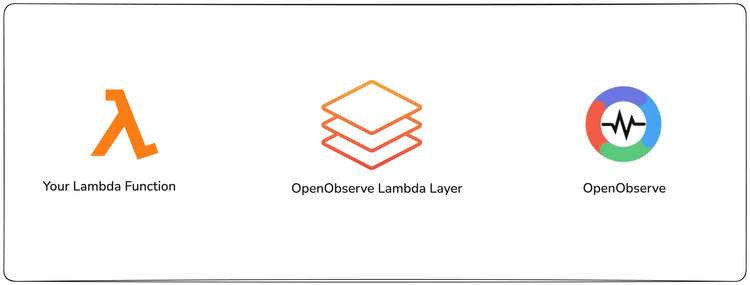
Stream AWS Lambda logs to OpenObserve without CloudWatch. See setup, env vars, ARNs for x86/arm64, SQL queries, and troubleshooting for real-time observability.
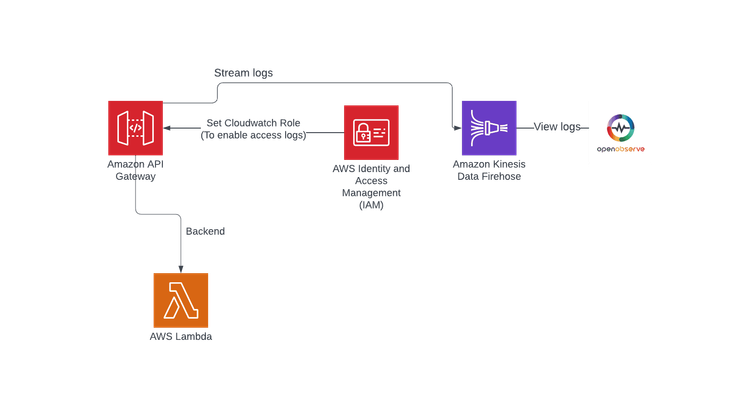
Discover the importance of log monitoring for API performance, step-by-step instructions on setting up a Lambda function, creating a REST API, and configuring Kinesis Firehose for seamless log streaming.
OpenObserve is now available on AWS Marketplace! Discover how teams can streamline observability with faster deployment, simplified billing, and seamless integration within their AWS infrastructure.
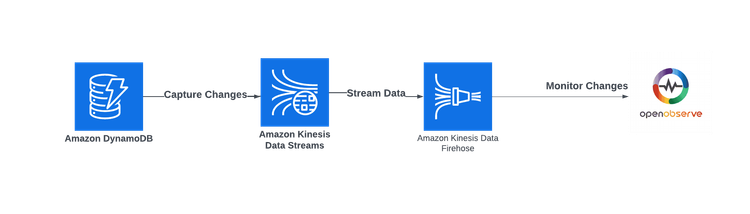
Learn effective ways to monitor DynamoDB tables using AWS Kinesis Data Streams and Firehose. Enhance your data management strategies today!
Learn how to capture and analyze Amazon EKS Fargate logs using AWS's built-in Fluent Bit log router, Kinesis Firehose, and OpenObserve for comprehensive container monitoring.
Learn how to deploy AWS RDS Oracle SE2 and monitor it with OpenObserve for superior performance visibility. Step-by-step guide with CloudFormation templates and pre-built dashboards to optimize your Oracle database monitoring.
Learn How to deploy OpenObserve on Amazon EKS with ALB ingress. Step-by-step guide on setup, for better security, performance, and compliance.
Learn how to generate AWS Cost and Usage Reports (CUR), store them in S3, configure event-driven processing with Lambda, and analyze cost data efficiently. This step-by-step guide covers IAM policies, S3 event setup, and automated cost analysis to help you optimize AWS spending.
Learn how to monitor AWS ALB logs efficiently with OpenObserve. Step-by-step guide on setup, ingestion, parsing, and visualization for better security, performance, and compliance.
Monitor AWS Cognito authentication events in real-time using OpenObserve. Learn to capture, enrich, and visualize raw logs for actionable security insights, user experience optimization, and streamlined compliance.
Learn how to secure your AWS environment with AWS Network Firewall. This comprehensive guide covers setup, configuring rules, controlling traffic, and log analysis using OpenObserve for actionable insights.
Learn how to effortlessly bring together and visualize all your AWS metrics in one place. Step-by-step guide to creating unified dashboards for AWS monitoring.
Learn how to set up AWS RDS log ingestion for detailed monitoring and observability. Compare centralized log analysis with OpenObserve vs. traditional methods for optimizing performance, enhancing security, and scaling database insights effectively.
Learn how to monitor AWS RDS metrics efficiently using AWS CloudWatch and OpenTelemetry. This guide covers end-to-end steps, including creating a CloudWatch metric stream, setting up a Kinesis data stream, and ingesting RDS metrics via OpenTelemetry for centralized monitoring. Perfect for managing multiple AWS accounts and ensuring optimal database performance.
Learn how to enable AWS Route 53 query logging, transform logs with VRL, and build dashboards for actionable insights. Unlock DNS traffic analysis and optimize performance with this step-by-step guide."
Learn how to set up real-time monitoring for CloudFront access logs using AWS Kinesis Streams and Firehose. This guide walks you through configuring CloudFront logging, creating Lambda transformations, and visualizing data in OpenObserve for performance optimization, security monitoring, and actionable insights.
Learn how to set up and monitor AWS WAF logs for enhanced security. This comprehensive guide covers AWS WAF configuration, waf logs, automated ingestion, dashboards, and best practices for visualization and insights.
Learn how to automate OpenVPN Connect or OpenVPN Client log ingestion into OpenObserve using AWS services like S3, SNS, and Lambda. Build scalable pipelines and security dashboards for real-time observability and enhanced insights.