Filter logs at source in otel collector


Try OpenObserve Cloud today for more efficient and performant observability.

There are times when you want to reduce log volume being sent to your centralized logging backend. You may want to do that for a variety of reasons:
While there are many log-forwarding agents being used by folks, we really like otel-collector here at OpenObserve. otel-collector is a vendor neutral, open source observability data collector. It can be used to collect logs, metrics and traces from your applications and send them to your observability backend. otel-collector is part of the OpenTelemetry project. You can read more about otel-collector here.
In this blog post, we will show you how to filter logs at source using otel-collector. We will show you how to do that using 2 processors - filter and attributes. While the example below is for logs, you can use the same processors for filtering metrics and traces as well which we will cover in future blog posts.
Also if you are using OpenObserve, you can use functions to filter logs, metrics and traces in OpenObserve itself before it is stored. This may sometimes provide much faster and easier feedback loop than filtering at source where you do not know what the data may look like. You can read more about functions here. Functions allow you to do much more than just filtering. You can use them to transform, enrich, sample, etc. incoming data. An example enrichment could be to convert IP address into geo location.
Processors are a way to transform incoming data. They can be used to filter, transform, enrich, sample, etc. incoming data. They can be used to transform logs, metrics and traces. You can find the list of all processors here. The 2 processors of interest to us for filtering logs are:
Let's say you have a log record that looks like this:
{
  "_timestamp": 1702059473796197,
  "body": "time=\"2023-12-08T18:17:53Z\" level=info
    msg=\"finished unary call with code OK\"
    grpc.code=OK
    grpc.method=Check
    grpc.service=grpc.health.v1.Health
    grpc.start_time=\"2023-12-08T18:17:53Z\"
    grpc.time_ms=0.02 span.kind=server system=grpc",
  "dropped_attributes_count": 0,
  "k8s_container_name": "argocd-repo-server",
  "k8s_container_restart_count": "0",
  "k8s_deployment_name": "argocd-repo-server",
  "k8s_namespace_name": "argocd",
  "k8s_node_name": "ip-10-2-147-27.us-east-2.compute.internal",
  "k8s_pod_name": "argocd-74ff5598cd-zjsxz",
  "k8s_pod_start_time": "2023-11-02 21:59:53 +0000 UTC",
  "k8s_pod_uid": "6b3f057f-c4ac-4d65-8c03-262979815daa",
  "log_file_path": "/var/log/containers/argocd-74ff5598cd-zjsxz_argocd-262979815daa.log",
  "log_iostream": "stderr",
  "logtag": "F",
  "service_name": "argocd-repo-server",
  "severity": "",
  "time": "2023-12-08T18:17:53.79619795Z"
}
You would like to filter out all logs that are from the argocd namespace. You can do that by:
using OTTL conditions:
processors:
  filter/remove_argocd_logs:
    error_mode: ignore
    logs:
      log_record:
        - resource.attributes["k8s.namespace.name"]=="argocd"
Remember that OpenObserve replaces attribute names with . to _ and hence we used k8s.namespace.name and not k8s_namespace_name
OTTL - OpenTelemetry Transformation Language allows you to transform incoming logs, metrics and traces.
or using resource_attributes:
processors:
  filter/remove_argocd_logs:
    error_mode: ignore
    logs:
      exclude:
        match_type: strict
        resource_attributes:
          - key: k8s.namespace.name
            value: argocd
Once you have any one of the above filters in place, add them to your pipeline (If you miss this step and nothing will happen)
service:
  extensions: [zpages]
  pipelines:
    logs:
      receivers: [filelog/std]
      processors: [batch, k8sattributes, filter/remove_argocd_logs]
      exporters: [otlphttp/openobserve]
and then redeploy your otel-collector. You should see that all logs from the argocd namespace are no longer being sent to your observability backend.
Let's dig a bit deeper into what all is possible with OTTL filters.
There may be times when may not want to remove the entire log record but just an attribute/field. You may find that log_file_path attribute in the above log record example is not very useful and decide to delete it. You can use below action to delete the field :
processors:
  attributes/log_file_path:
    actions:
      - key: log.file.path
        action: delete
Once you have the above filter in place, add it to your pipeline
service:
  extensions: [zpages]
  pipelines:
    logs:
      receivers: [filelog/std]
      processors: [batch, k8sattributes, attributes/log_file_path]
      exporters: [otlphttp/openobserve]
Following actions are supported that can be used for doing more than just delete a field:
| Action | Description |
|---|---|
| insert | Inserts a new attribute in input data where the key does not already exist. |
| update | Updates an attribute in input data where the key does exist. |
| upsert | Performs insert or update. Inserts a new attribute in input data where the key does not already exist and updates an attribute in input data where the key does exist. |
| delete | Deletes an attribute from the input data. |
| hash | Hashes (SHA1) an existing attribute value. |
| extract | Extracts values using a regular expression rule from the input key to target keys specified in the rule. If a target key already exists, it will be overridden. Note: It behaves similar to the Span Processor to_attributes setting with the existing attribute as the source. |
| convert | Converts an existing attribute to a specified type. |
You will be able to find some additional examples in the OTTL documentation.
While you could learn OTTL and add filters to your pipeline, there are following challenges:
In the next section we will discuss native pipelines in OpenObserve that make this easier.
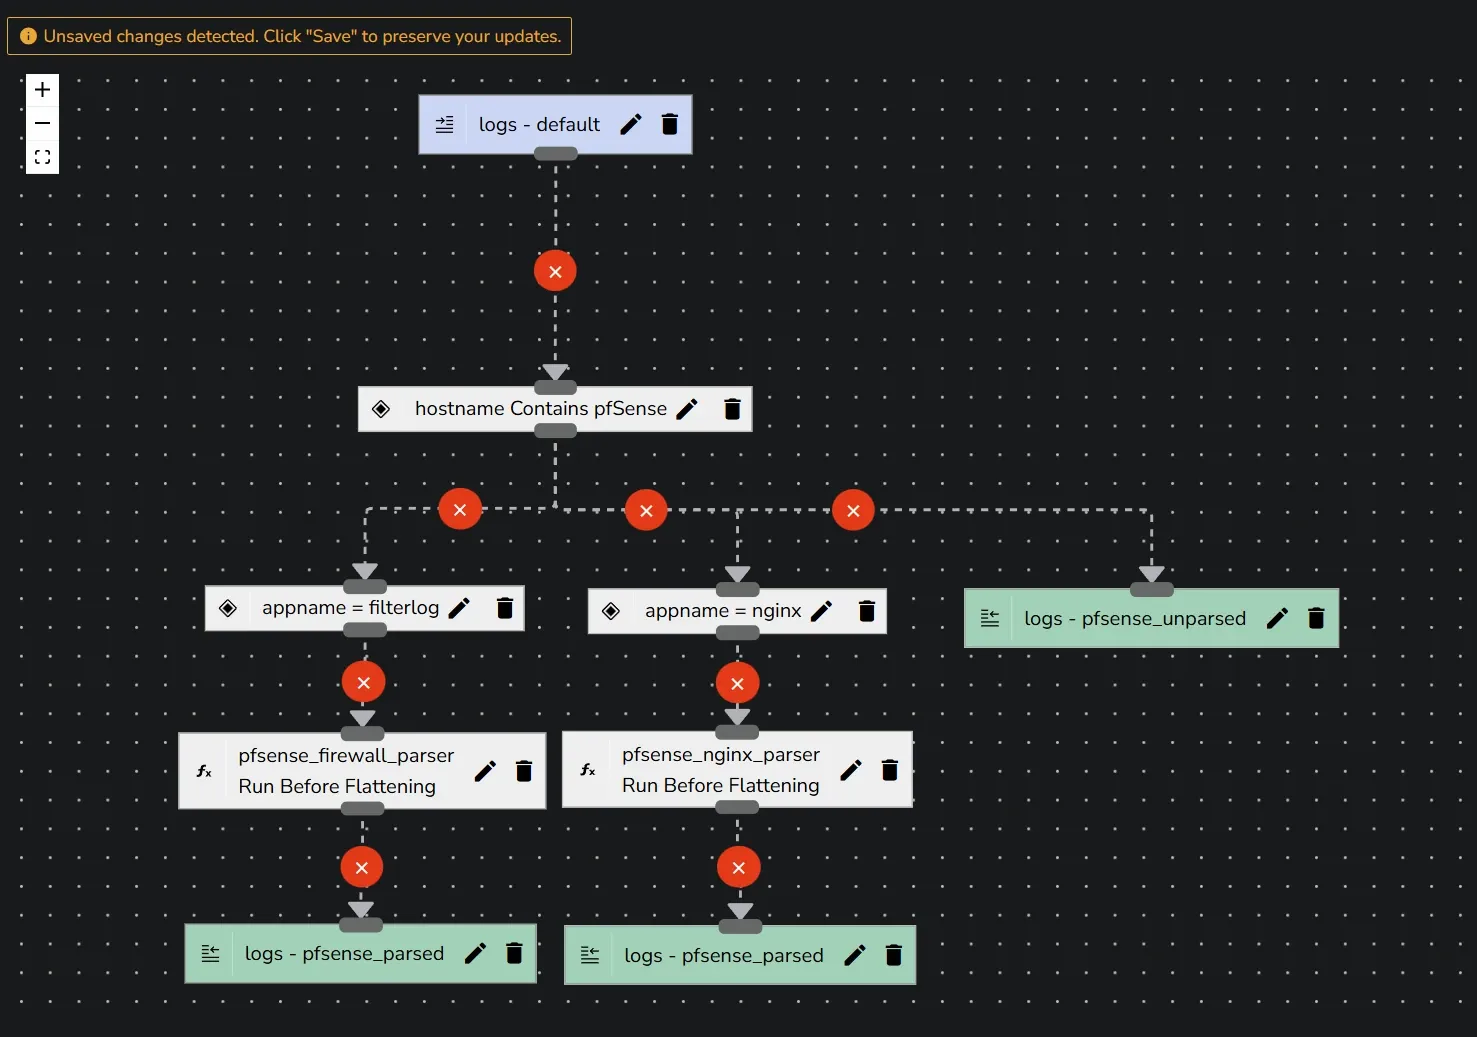
Pipelines in openobserve provide a visual interface to filter logs, metrics and traces. Not only filtering is easy but you can do a whole lot more:
Here is an example of a pipeline that you can build visually in OpenObserve in a couple minutes.

In this blog post, we learnt how to filter logs at source using otel-collector. We specifically learned about using 2 processors - filter and attributes. Using the techniques we learned above you will be able to reduce your log volume, reduce noise and network traffic.

Prabhat Sharma is the founder of OpenObserve, bringing extensive expertise in cloud computing, Kubernetes, and observability. His interests also encompass machine learning, liberal arts, economics, and systems architecture. Outside of work, Prabhat enjoys spending quality time playing with his children.