Resources

Setting Up the SQL Server Receiver for OpenTelemetry

October 1, 2024 by OpenObserve Team
SQL Server Receiver

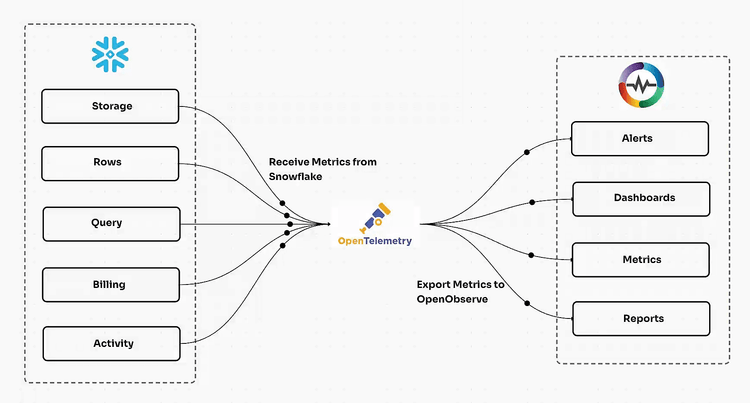
The SQL Server Receiver is a component of the OpenTelemetry Collector that enables the collection of metrics from Microsoft SQL Server instances. It plays a crucial role in monitoring the performance and reliability of SQL Server databases, which are widely used in enterprise applications.

Image Credit

Purpose of SQL Server Receiver

The primary purpose of the SQL Server Receiver is to:

  • Query and retrieve metrics from Microsoft SQL Server instances
  • Support the metrics pipeline type
  • Work with either Windows Performance Counters or by directly connecting to the SQL Server instance

Importance of Monitoring SQL Server

Monitoring SQL Server is essential for ensuring the performance and reliability of applications that rely on it. Some key reasons include:

  • Identifying performance bottlenecks and optimizing queries
  • Detecting and preventing issues before they impact users
  • Ensuring data integrity and consistency
  • Facilitating capacity planning and resource allocation

OpenObserve with SQL Server Receiver

OpenObserve, a distribution of the OpenTelemetry Collector, includes the SQL Server Receiver as one of its components. By using OpenObserve with the SQL Server Receiver, organizations can:

  • Easily deploy and configure the SQL Server Receiver to collect metrics from their SQL Server instances
  • Visualize and analyze the collected metrics using the Observability Cloud
  • Gain insights into the performance and health of their SQL Server databases
  • Proactively identify and address issues before they impact end-users

In short, the SQL Server Receiver is a valuable tool for monitoring and optimizing the performance of SQL Server databases in enterprise applications. 

SQL Server monitoring using otel-collector and OpenObserve

Watch the video if you are looking for a practical guide to implement SQL Server monitoring using OpenTelemetry and OpenObserve. It provides both configuration examples and insights into the monitoring process.

Now let’s dive deep and understand the details of getting started with SQL Server Receiver.

Getting Started with SQL Server Receiver

Setting up the SQL Server Receiver in OpenTelemetry requires careful consideration of prerequisites and a clear understanding of the setup process. Below is a detailed description of the requirements and the setup process.

Requirements and Prerequisites

Database User Security Role:

  • Create a database login with SQL Server authentication.
  • Assign the roles of sysadmin and public to the login.

Database and Schema Access:

  • The installer will use the above login to create necessary databases and schemas for the Quantum Fabric components.

Database Growth Sizing:

  • Refer to the Quantum Fabric Deployment Guide for specific sizing requirements.

Database Transaction Log Size:

  • Allocate sufficient space for the transaction log file based on the transaction activity of all Quantum Fabric components installed, in accordance with your backup policy.

Temporary Database and Log:

  • Size the temp database with auto-growth settings of 100 MB increments, capping at 10 GB. If multiple components are logging events, increase the maximum size to 20 GB.

Database Versions:

  • Compatible with SQL Server Standard and Enterprise Editions. No specific prerequisites for these editions, as Quantum Fabric uses common features.

Backup Plan:

  • Implement your organization's defined backup and retention policies for database backups.

Hardware and Software Requirements:

  • Minimum of 6 GB of available hard-disk space.
  • At least 1 GB of RAM for all editions, with 4 GB recommended for optimal performance.
  • A supported operating system, such as Windows 10 or Windows Server 2016 and above.
  • .NET Framework 4.6 or later is required for SQL Server 2016 and later versions

Overview of Setup Process

Pre-Installation Steps:

  • Take a backup of your existing database.

BACKUP DATABASE \[YourDatabase] TO DISK = 'C:\Backup\YourDatabase.bak'

This ensures you have a safe copy of your SQL Server data.

  • Ensure a previously installed directory is available - Verify your directory structure to avoid installation issues:

dir C:\Program Files\OpenTelemetry\

  • Back up any deployed applications on the server - Back up applications to prevent data loss
  • After installation, back up any changes made to binaries - Once the installation is complete, ensure any modified binaries are backed up:

copy C:\Program Files\OpenTelemetry\collector.exe C:\Backup\

Creating Required Folders:

  • Ensure a /tmp folder exists in a Linux environment for unpacking the installer. If not found, the installer will display an I/O exception.

ls -ld /tmp

If missing, create the folder:

sudo mkdir /tmp
sudo chmod 1777 /tmp

If /tmp is unavailable, the installer will display errors like this:

java.io.IOException: No space left on device

Installation Process:

  • Download the SQL Server Receiver from the OpenTelemetry GitHub repository. 

Clone the repository to get the SQL Server Receiver:

git clone https://github.com/open-telemetry/opentelemetry-collector-contrib.git
cd opentelemetry-collector-contrib/receiver/sqlserverreceiver

  • Configure the receiver settings, including the collection_interval, username, password, server, and port for direct connections.

receivers:
  sqlserver:
    collection_interval: 10s
    username: 'sql_user'
    password: 'your_password'
    server: 'localhost'
    port: 1433

  • For Windows installations, specify the computer_name and instance_name if using a named instance.

computer_name: 'MyServer'
instance_name: 'SQLExpress'

  • Run the collector as an administrator to collect all performance counters for metrics.

Start-Process powershell -Verb runAs
.\opentelemetry-collector.exe --config config.yaml

Post-Installation Steps:

  • Verify the installation by checking the collected metrics.

tail -f /var/log/opentelemetry-collector.log

Or in Windows, check the event log:

Get-EventLog -LogName Application -Source "OpenTelemetry"

  • Adjust configurations as necessary based on performance observations and requirements.

vim /path/to/config.yaml

By following these requirements and setup processes, users can effectively implement the SQL Server Receiver in their OpenTelemetry environment, enabling robust monitoring and performance management of SQL Server instances.

Core Components of OpenTelemetry

OpenTelemetry provides a standardized approach to instrumenting applications across various programming languages and frameworks.

Overview of OpenTelemetry Architecture

  • Unified Framework: OpenTelemetry merges the capabilities of OpenCensus and OpenTracing, creating a unified framework for telemetry data collection, including traces, metrics, and logs.
  • Modular Architecture: The architecture consists of several key components that work together:
    • API: Provides the interface for instrumentation, allowing developers to generate telemetry data without being tied to a specific implementation.
    • SDK: Implements the API, providing the necessary tools and libraries for different programming languages to collect telemetry data.
    • Collector: A crucial component that receives, processes, and exports telemetry data to various backends.
  • Data Signals: OpenTelemetry distinguishes between three main types of telemetry signals:
    • Metrics: Quantitative measurements of system behavior (e.g., CPU usage).
    • Traces: Detailed records of requests' execution paths through distributed systems.
    • Logs: Textual records of events occurring during application execution.

OpenTelemetry Collector, Receivers, Processors, and Exporters

  • Collector: An executable service that acts as a central point for telemetry data collection. It can run as an agent on a host or as a gateway to receive data from multiple sources.
  • Receivers: Responsible for gathering telemetry data from applications or other services. They support various protocols and can be configured to receive data from multiple sources.
  • Processors: Allow for data manipulation, such as filtering, aggregation, or transformation, enhancing the telemetry data before it reaches the exporters.
  • Exporters: Facilitate the transmission of telemetry data to various backends, enabling integration with monitoring and observability tools.

Role of SQL Server Receiver within OpenTelemetry Components

The SQL Server Receiver is a specific implementation within the OpenTelemetry framework that focuses on collecting telemetry data from Microsoft SQL Server instances. Its role includes:

  • Data Collection: It queries SQL Server instances to gather performance metrics, enabling organizations to monitor database health and performance.
  • Integration with Collector: The SQL Server Receiver operates as a part of the OpenTelemetry Collector's pipeline, functioning alongside other receivers, processors, and exporters to provide a comprehensive monitoring solution.
  • Performance Monitoring: By collecting relevant metrics, the SQL Server Receiver helps identify performance bottlenecks, ensuring that SQL Server databases operate efficiently and reliably.

In summary, OpenTelemetry provides a robust architecture, with the SQL Server Receiver playing a vital role in monitoring SQL Server performance within this framework.

Important SQL Server Metrics

Monitoring SQL Server performance is crucial for maintaining optimal database health and ensuring efficient application operation. Below are key metrics that provide insights into SQL Server performance, their significance, and how they can be used to identify potential bottlenecks.

1. Cache Hit Ratio

  • Significance: The Buffer Cache Hit Ratio (BCHR) measures the percentage of data pages that are found in memory (buffer cache) versus those that require reading from disk. A high BCHR indicates efficient memory usage, while a low ratio suggests potential memory pressure and increased disk I/O, which can degrade performance.
  • Measurement: Calculated using the formula:

Buffer Cache Hit Ratio = (Buffer Cache HitsBuffer Cache Hits + Buffer Cache misses)X 10

  • Impact: A BCHR below 90% may indicate memory issues, leading to slower query responses. For example, if the BCHR drops significantly during peak usage times, it may signal that additional memory is needed or that queries are not optimized.

2. Transaction Write Rate

  • Importance: This metric tracks the number of transactions being written to the database over a specific time frame. It helps assess the workload on the SQL Server and can indicate the potential for bottlenecks if the write rate exceeds the server's capacity to handle them.
  • Monitoring: Regularly monitor transaction logs and use performance counters to track the write rate. A sudden increase in the write rate could lead to log file growth issues or increased I/O contention.
  • Example: If the transaction write rate spikes during peak hours, it may necessitate reviewing the database design or optimizing transaction handling to prevent performance degradation.

3. User Connections

  • Monitoring Active User Connections: This metric indicates the number of active connections to the SQL Server instance. Monitoring user connections helps in understanding user load and application usage patterns.
  • Significance: A high number of user connections can lead to resource contention, impacting performance. Conversely, a low number may indicate underutilization of the server.
  • Example: If the number of connections approaches the maximum allowed limit, it may be necessary to optimize connection pooling or review application logic to prevent connection leaks.

4. Page Split Rates

  • Monitoring Disk I/O and Performance: Page splits occur when a data page becomes full and SQL Server must split it to accommodate new data, leading to increased disk I/O and fragmentation.
  • Significance: High page split rates can indicate poor indexing strategies or the need for better data distribution practices.
  • Example: If monitoring reveals a high page split rate, consider reviewing the indexing strategy or implementing fill factors to minimize splits, thereby improving performance.

5. Lock Wait Rates

  • Identifying Locking and Deadlocking Issues: This metric tracks the frequency of lock waits, where processes are blocked waiting for locks to be released. High lock wait rates can lead to performance bottlenecks and application timeouts.
  • Significance: Monitoring lock wait rates helps identify contention issues and potential deadlocks in the system.
  • Example: If lock wait rates are consistently high, it may be necessary to analyze queries for locking behavior and consider implementing query optimization or isolation level adjustments.

6. Log File Size and Growth

  • Preventing Space Issues: Monitoring the size and growth of transaction log files is essential to prevent running out of disk space, which can halt database operations.
  • Understanding Transaction Volumes: A rapidly growing log file may indicate high transaction volumes or inefficient transaction handling.
  • Example: If the log file size approaches the maximum limit, it may be necessary to implement regular log backups or review transaction handling to reduce growth.

7. OS/Process Metrics

  • Monitoring SQL Server Process Consumption: Tracking operating system metrics related to SQL Server processes helps understand resource utilization, including CPU, memory, and disk I/O.
  • Significance: High resource consumption can lead to performance degradation and should be monitored regularly.
  • Example: If CPU usage consistently exceeds 80%, it may be necessary to optimize queries or consider scaling up hardware resources.

8. Windows Events

  • Monitoring Application, System, and Security Events: Windows Event Logs provide insights into application errors, system warnings, and security events related to SQL Server.
  • Significance: Monitoring these events helps identify potential issues that could impact SQL Server performance and security.
  • Example: If frequent application errors are logged, it may indicate underlying issues with the application or SQL Server configuration that need to be addressed.

By regularly monitoring these key metrics, database administrators can proactively identify performance bottlenecks and implement necessary optimizations to enhance SQL Server performance and reliability.

Configuring the SQL Server Receiver

To monitor SQL Server instances using the OpenTelemetry Collector, you need to configure the SQL Server Receiver. Here are the steps involved:

1. Add the SQL Server Receiver to the Collector Configuration

In your OpenTelemetry Collector configuration file, add the SQL Server Receiver under the receivers section:

receivers:
  sqlserver:
    collection_interval: 30s
    username: sqluser
    password: changeme
    server: localhost
    port: 1433

This configuration sets up the SQL Server Receiver to collect metrics every 30 seconds from a local SQL Server instance using the specified username and password.

2. Set Necessary Parameters

The SQL Server Receiver supports several configuration parameters to optimize performance:

  • collection_interval: Specifies the interval at which metrics are collected from SQL Server. A lower value provides more frequent data but may impact performance.
  • username and password: Credentials used to connect to SQL Server. Ensure these are secure.
  • server and port: Hostname or IP address of the SQL Server instance and the port it is listening on.
  • instance_name: Required for named SQL Server instances. Specifies the instance name being monitored.
  • query_timeout: Sets the timeout in seconds for queries executed by the receiver. Increase this if queries are taking longer to complete.
  • connection_string: Allows specifying a full connection string instead of individual parameters.

3. Configure Processors and Exporters

After setting up the SQL Server Receiver, configure any necessary processors to transform or filter the collected metrics. Finally, add exporters to send the metrics to desired backends, such as Prometheus, Jaeger, or Zipkin.

processors:
  batch:

exporters:
  prometheusremotewrite:
    endpoint: https://prometheus.example.com/write

This example adds a batch processor and a Prometheus Remote Write exporter to send the SQL Server metrics to a Prometheus server.

4. Define the Pipeline

Lastly, define a pipeline in the service section that connects the receiver, processors, and exporters.

service:
  pipelines:
    metrics:
      receivers: \[sqlserver]
      processors: \[batch]
      exporters: \[prometheusremotewrite]

This pipeline processes the SQL Server metrics through the batch processor and sends them to the Prometheus exporter.

Impact of Configuration Settings

The SQL Server Receiver configuration settings can impact performance in the following ways:

  • collection_interval: A lower value increases the frequency of metric collection but may put more load on SQL Server, especially if many metrics are being collected.
  • query_timeout: Setting a higher timeout allows queries to complete even if they are slow, but it may delay reporting of metrics if queries consistently take a long time.
  • Processor and exporter settings: Applying complex transformations or sending metrics to multiple backends can increase the processing load on the collector.

It's important to monitor the impact of the SQL Server Receiver configuration on both the collector and the SQL Server instance to ensure optimal performance. Start with reasonable defaults and adjust settings based on observed performance.

By following these steps and considering the impact of configuration settings, you can effectively set up the SQL Server Receiver to monitor your SQL Server instances using the OpenTelemetry Collector.

Assembling the Monitoring Pipeline

To effectively monitor SQL Server instances using the OpenTelemetry Collector, you need to integrate various components into a cohesive pipeline. Here's a step-by-step guide on building a complete monitoring pipeline:

1. Integrate the Host Metric Receiver

The Host Metric Receiver collects detailed operating system and process metrics, providing valuable insights into the health of the underlying host running SQL Server. To add the Host Metric Receiver to your pipeline configuration:

receivers:
  hostmetrics:
    collection_interval: 10s
    scrapers:
      cpu:
      disk:
      filesystem:
      memory:
      network:
      paging:
      process:
      processlist:
      swap:

This configuration enables the collection of CPU, disk, memory, network, and process metrics at a 10-second interval.

2. Configure the Windows Events Receiver

The Windows Events Receiver monitors application, system, and security events related to SQL Server. It helps provide context for troubleshooting and root cause analysis. Add the Windows Events Receiver to your configuration:

receivers:
  windowseventlog:
    event_types:
      - error
      - warning
      - information
      - critical
    max_events_per_batch: 10
    timeout: 10s

This configuration collects error, warning, information, and critical events from the Windows Event Log, with a maximum of 10 events per batch and a 10-second timeout.

3. Add Exporters for Data Shipping

Exporters are responsible for sending the collected metrics and events to various backends for storage and analysis. Choose the appropriate exporter(s) based on your monitoring requirements:

exporters:
  prometheusremotewrite:
    endpoint: https://prometheus.example.com/write
  googlecloudmonitoring:
    project: your-project-id
    metric_type_prefix: custom.googleapis.com/
  jaeger:
    endpoint: http://jaeger.tracing:14250
    tls:
      insecure: true

This example includes a Prometheus Remote Write exporter for sending metrics to a Prometheus server, a Google Cloud Monitoring exporter for sending metrics to Google Cloud, and a Jaeger exporter for sending traces to a Jaeger tracing backend.

4. Define the Pipeline

Finally, define a pipeline in the service section that connects the receivers and exporters:

service:
  pipelines:
    metrics:
      receivers: \[sqlserver, hostmetrics, windowseventlog]
      exporters: \[prometheusremotewrite, googlecloudmonitoring]
    traces:
      receivers: \[jaeger]
      exporters: \[jaeger]

This pipeline processes the SQL Server metrics, host metrics, and Windows events through the specified exporters for metrics, and sends traces to the Jaeger exporter.

Recommendations for Different Use Cases

  • Small Environments: For small environments with a few SQL Server instances, you can use the default configuration with minimal modifications. Focus on collecting essential metrics like cache hit ratio, transaction write rate, and user connections.
  • Large Environments: In large environments with multiple SQL Server instances, consider scaling the collector horizontally by running multiple instances. Distribute the load by assigning specific instances to each collector. Use the instance_name configuration to specify which instance each collector should monitor.
  • Hybrid Environments: If you have a mix of on-premises and cloud-hosted SQL Server instances, use multiple collectors to monitor each environment separately. Configure the appropriate exporters for each environment, such as Google Cloud Monitoring for cloud instances and Prometheus for on-premises instances.

By following these steps and tailoring the configuration to your specific needs, you can build a robust monitoring pipeline that collects comprehensive data from your SQL Server instances using the OpenTelemetry Collector.

Running and Viewing SQL Server Metrics with OpenObserve

To effectively monitor SQL Server metrics using OpenObserve and the OpenTelemetry Collector, follow these steps to set up, execute, and visualize the collected metrics.

1. Executing the Configured OpenTelemetry Collector

After configuring the OpenTelemetry Collector with the SQL Server Receiver and other necessary components, you can run the collector using the following steps:

  1. Download the OpenTelemetry Collector: Ensure you have the latest otelcol-contrib tarball for Windows, which includes the SQL Server Receiver. You can download it from the OpenTelemetry Collector GitHub releases.
  2. Extract the Tarball: Use a tool like 7-Zip or PowerShell to extract the tarball:

powershell
tar -xvzf .\otelcol-contrib-windows-amd64.tar.gz

  1. Create the Configuration File: In the directory where you extracted the collector, create a configuration file named otel_collector_config.yaml with the following content:

receivers:
  sqlserver:
    collection_interval: 30s
    username: "your_username"
    password: "your_password"
    server: "localhost"
    port: 1433

  hostmetrics:
    collection_interval: 30s
    scrapers:
      cpu:
      memory:

  windowseventlog:
    event_types:
      - error
      - warning
      - information
      - critical

exporters:
  googlecloudmonitoring:
    project: "your-project-id"
    metric_type_prefix: "custom.googleapis.com/"
    # Ensure you set the GOOGLE_APPLICATION_CREDENTIALS environment variable

service:
  pipelines:
    metrics:
      receivers: \[sqlserver, hostmetrics, windowseventlog]
      exporters: \[googlecloudmonitoring]

  1. Run the Collector: Open a command prompt in the collector's directory and execute the following command to start the collector:

bash
otelcol-contrib --config otel_collector_config.yaml

2. Accessing and Analyzing SQL Server Metrics via Google Cloud Metrics Explorer

Once the OpenTelemetry Collector is running and collecting metrics, you can view these metrics in Google Cloud Metrics Explorer:

  1. Go to Google Cloud Console: Navigate to the Google Cloud Console and select your project.
  2. Open Metrics Explorer: In the navigation menu, go to Monitoring > Metrics Explorer.
  3. Select Metrics: Use the search bar to find SQL Server metrics. For example, search for custom.googleapis.com/sqlserver.user.connection.count to view active user connections.
  4. Run Queries: To analyze specific metrics, you can run queries. For instance, to see the transaction write rate, you might enter:

fetch gce_instance | metric 'custom.googleapis.com/sqlserver.transaction.write.rate' | every 1m

3. Creating Custom Dashboards for Specific Needs

Creating custom dashboards in Google Cloud allows you to visualize the metrics that are most relevant to your organization. Here’s how to create a custom dashboard:

  1. Navigate to Dashboards: In the Google Cloud Console, go to Monitoring > Dashboards.
  2. Create a New Dashboard: Click on Create Dashboard.
  3. Add Charts: Use the Add Chart button to add visualizations for the metrics you want to monitor. For example:User Connections
  4. Customize Chart Settings: Configure each chart’s settings, such as time range, aggregation method, and display options.
  5. Save the Dashboard: Once you’ve added all necessary charts, save the dashboard for future access.

Recommendations for Different Use Cases

  • Small Environments: For smaller setups, focus on essential metrics like user connections and cache hit ratios. A simple dashboard with two or three key metrics will suffice.
  • Large Environments: In larger environments, consider creating multiple dashboards for different teams (e.g., database administrators, developers) that focus on specific metrics relevant to their roles. Include alerts for critical metrics such as lock wait rates and transaction log growth.

By following these steps, you can effectively run the OpenTelemetry Collector, access SQL Server metrics, and create custom dashboards tailored to your monitoring needs using OpenObserve. 

Best Practices and Optimizations for SQL Server Monitoring

Effective SQL Server monitoring is essential for maintaining optimal performance and reliability. Here are best practices, common pitfalls to avoid, and tips for optimizing your SQL Server monitoring setups.

1. Regular Monitoring and Refining Configurations

  • Continuous Review: Regularly review your monitoring configurations and metrics. As your database environment evolves, so should your monitoring strategy. This includes updating thresholds for alerts and refining metrics based on current performance trends and application usage patterns.
  • Establish Baselines: Create performance baselines during normal operating conditions. This helps in identifying deviations from expected performance and allows for proactive adjustments.
  • Utilize Automation: Implement automated monitoring tools that can continuously track performance metrics, alerting you to issues as they arise. This reduces the manual overhead and allows DBAs to focus on resolving issues rather than just monitoring.

2. Common Pitfalls and How to Avoid Them

  • Too Much Data: One common pitfall is collecting excessive data without a clear purpose. Focus on key performance indicators (KPIs) that are relevant to your environment. Too much irrelevant data can lead to confusion and alert fatigue, making it difficult to identify real issues.
  • Not Enough Detail: Conversely, insufficient detail can hinder your ability to diagnose problems. Ensure that your monitoring setup captures enough detail to provide actionable insights without overwhelming you with unnecessary information.
  • Ignoring Alerts: Regularly review and respond to alerts. If alerts are ignored or not acted upon, it can lead to larger issues down the line. Establish a clear process for responding to alerts and ensure that the relevant team members are notified promptly.
  • Neglecting Security Monitoring: Security threats can impact performance. Ensure that your monitoring strategy includes security metrics to detect unauthorized access or suspicious activities.

3. Tips for Optimizing SQL Server Monitoring Setups

  • Leverage Query Store: Utilize SQL Server's Query Store feature to monitor query performance over time. This allows you to identify regressed queries and optimize them based on historical performance data.
  • Use Performance Monitoring Tools: Employ tools such as SQL Server Management Studio (SSMS) and third-party monitoring solutions to gain insights into resource consumption, query performance, and overall database health. Tools like SolarWinds SQL Sentry can provide a unified view of your SQL Server environment.
  • Customize Alerts and Dashboards: Tailor your alerts and dashboards to focus on metrics that matter most to your organization. This could include transaction rates, lock wait times, and resource utilization. Custom dashboards can help visualize performance trends and make it easier to spot anomalies.
  • Monitor Disk I/O Performance: Regularly check disk I/O metrics, as they are often a bottleneck in SQL Server performance. Use performance counters to identify high I/O during peak times and take action to optimize disk usage.
  • Integrate with Existing Workflows: Ensure that your monitoring solution integrates seamlessly with your existing IT operations. This facilitates quick responses to alerts and helps maintain a holistic view of your SQL Server health within your broader IT ecosystem.

By implementing these best practices, you can significantly enhance the performance and reliability of your SQL Server environment. 

How to Integrate OpenObserve with Monitoring Tools

Integrating OpenObserve with other monitoring tools like Grafana and Prometheus allows for enhanced visualization and analysis of SQL Server metrics. Here’s how to do it:

  1. Set Up OpenTelemetry Collector: Ensure that the OpenTelemetry Collector is configured to collect metrics from SQL Server using the SQL Server Receiver.
  2. Configure Exporters: In your OpenTelemetry configuration file, add exporters for Prometheus and any other tools you intend to use. For example:

exporters:
prometheusremotewrite:
endpoint: "http://prometheus-server/api/v1/write"

  1. Prometheus Configuration: In Prometheus, configure the scraping of metrics from the OpenTelemetry Collector by adding the following to your prometheus.yml:

scrape_configs:
- job_name: 'sqlserver'
static_configs:
- targets: ['<otel_collector_host>:<port>']

Real-World Examples of OpenObserve Impact

Case Study: E-Commerce Platform

  • Challenge: An e-commerce company faced slow transaction times during peak shopping seasons.
  • Solution: By integrating OpenObserve with Grafana and Prometheus, the company monitored SQL Server metrics in real-time. They identified high lock wait times and optimized their indexing strategy.
  • Outcome: Improved transaction speeds by 40% during peak hours, leading to increased sales and customer satisfaction.

Quantifiable Benefits Achieved

  • Performance Improvement: Organizations that implemented OpenObserve reported a significant reduction in query response times and improved overall database performance.
  • Cost Savings: By optimizing SQL Server performance, companies reduced infrastructure costs associated with unnecessary hardware upgrades and improved resource utilization.
  • Enhanced Reliability: Continuous monitoring led to fewer incidents of downtime, allowing businesses to maintain higher levels of service availability.

By integrating OpenObserve with other monitoring tools and leveraging comprehensive data analysis, you can significantly enhance SQL Server performance.

Conclusion

This blog explored the SQL Server Receiver, a component of the OpenTelemetry Collector that facilitates monitoring of SQL Server performance and health. It plays a crucial role in ensuring the reliability and optimal performance of applications relying on SQL Server databases.

Why OpenObserve Offers a Great Solution

OpenObserve, a distribution of the OpenTelemetry Collector, offers a user-friendly and comprehensive solution for monitoring SQL Server instances. Here's why it stands out:

  • Easy Deployment and Configuration: OpenObserve simplifies the process of deploying and configuring the SQL Server Receiver for metric collection.
  • Visualization and Analysis: It integrates seamlessly with the Observability Cloud platforms, enabling users to visualize and analyze the collected SQL Server metrics effectively.
  • Proactive Problem Identification: OpenObserve empowers users to identify and address potential issues before they impact end-users, ensuring a smooth user experience.

Ready to experience the benefits of OpenObserve for monitoring your SQL Server instances? 

Sign up for a free trial today!

By leveraging OpenObserve's capabilities, you can gain valuable insights into your database performance and proactively address any potential bottlenecks.

Author:

authorImage

The OpenObserve Team comprises dedicated professionals committed to revolutionizing system observability through their innovative platform, OpenObserve. Dedicated to streamlining data observation and system monitoring, offering high performance and cost-effective solutions for diverse use cases.

OpenObserve Inc. © 2024