Frontend Monitoring Basics: How to Track Performance, Errors, and User Experience

Simran Kumari
September 05, 2025
10 min read
Don’t forget to share!
Try OpenObserve Cloud today for more efficient and performant observability.
What You Will Learn
By the end of this guide, you’ll understand:
Frontend monitoring, also known as frontend performance monitoring, is essential for ensuring fast websites, reliable user experiences, and strong SEO rankings.
When your website takes too long to load, users don’t just wait, they leave. The BBC found that every extra second of page load time cost them 10% of their audience. For an ecommerce site, that’s like shutting the door on hundreds of paying customers every minute.
Frontend monitoring helps you spot these slowdowns, errors, and broken journeys before your users do. Done right, it keeps experiences smooth, conversions high, and your SEO rankings safe.
Frontend monitoring is a critical aspect of web development that focuses on ensuring the optimal performance and functionality of the user interface (UI) of a web application. Frontend monitoring is the practice of tracking everything that happens in the user’s browser, from how fast a page loads, to how smooth it feels when scrolling, to whether a button click actually works.
Unlike backend monitoring that focuses on server performance, frontend monitoring is a strategic approach that systematically observes and analyzes a website or application's performance and user interactions. It's the difference between knowing your server responded in 50ms and knowing your user waited 5 seconds to see actual content.
By monitoring various aspects such as page load times, UI responsiveness, and error rates, frontend monitoring helps in identifying and resolving issues that could negatively impact the user experience.
Frontend monitoring is critical for user retention, revenue growth, and SEO rankings. A faster website improves Core Web Vitals, boosts Google search visibility, and lowers bounce rates. Frontend monitoring is the cornerstone of delivering a high-performing website. Just as a finely-tuned engine powers a high-performance car, frontend monitoring drives optimal user experiences.
Here's why it's absolutely critical:
Imagine you’ve just launched a new feature, and everything looks perfect on your team’s devices. But soon, customers start reporting that pages are slow to load or buttons don’t work properly, especially for users in certain locations or on specific devices. How do you figure out what’s really happening?
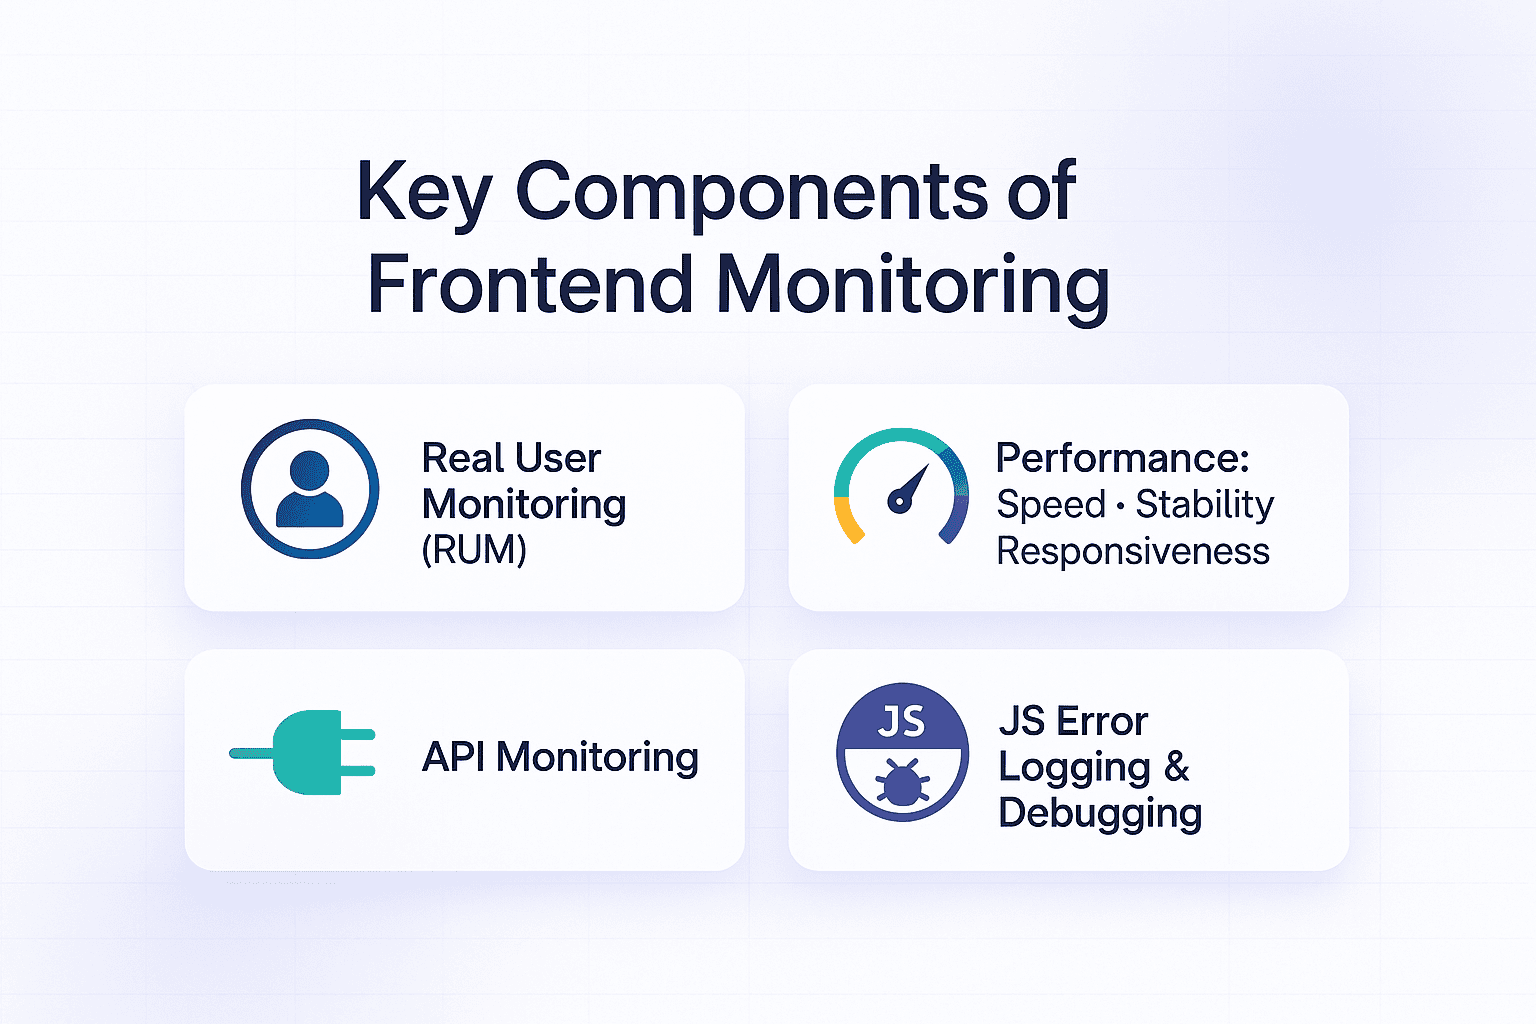
That’s where Real User Monitoring (RUM) becomes invaluable. RUM collects data directly from your actual users as they interact with your website, capturing metrics such as load times, page rendering, and user interactions. This data helps identify performance bottlenecks and user-specific issues that might not be apparent through synthetic testing.
You’ve optimized images, bundled scripts, and shipped the build. On your machine it feels snappy. Then the reports roll in: “The page jumps when I try to click,” “It’s fine on Wi-Fi but crawls on mobile data,” “First load is fast, but interactions lag.”
Performance monitoring tells you why. It focuses on how quickly content appears, how stable the layout stays, and how responsive the UI feels after every tap or click.
What to watch (Core Web Vitals + more):
You can learn more about these web experience metrics on the Core Web Vitals website.
API monitoring is another critical aspect of frontend monitoring, ensuring that the APIs your application depends on are always available and functioning correctly. APIs are the backbone of modern web applications, facilitating communication between different services and systems.
You can track the uptime, response times, and correctness of API responses. When an API fails, your users feel it immediately , even if your frontend code is perfect.
Frontend error logging is vital for capturing and analyzing errors that occur in the user's browser. JavaScript errors can significantly impact the functionality and user experience of your application, making it crucial to detect and resolve them promptly.
Frontend monitoring tools provide comprehensive frontend error logging solutions. They capture detailed information about JavaScript errors, including the error message, stack trace, user actions leading up to the error, and the environment in which the error occurred.
Many teams evaluate tools like Datadog, New Relic, Grafana, and OpenObserve when choosing a frontend monitoring solution.
When selecting a frontend monitoring solution, focus on capabilities that give you real visibility into user experience, performance, and errors without adding unnecessary complexity. Key features to look for:
By considering these features, you can select a frontend monitoring tool that meets your specific needs and helps you maintain a high-performing application.
Implementing frontend monitoring effectively requires following best practices that ensure comprehensive coverage and actionable insights. Here are some key practices to consider:
Using a unified platform for frontend monitoring helps streamline data collection and analysis. A single platform that combines RUM, error logging, and performance analytics can provide a holistic view of your application's health.
Monitoring individual user journeys through your application is crucial for identifying specific pain points and optimizing the user experience. Track key interactions such as page loads, form submissions, and navigation paths to understand how users engage with your application.
Automated end-to-end (E2E) testing is essential for proactive issue identification before deployment. E2E tests simulate user interactions with your application, ensuring that all components work together as expected.
With the increasing use of mobile devices, optimizing for mobile performance is more important than ever. Ensure that your monitoring tools can track performance metrics specific to mobile devices.
Define performance budgets and thresholds that matter to your business. This way you'll only be notified when necessary, without missing important changes.
Frontend monitoring isn’t just about collecting performance numbers, it’s about seeing exactly what your users experience, understanding why issues occur, and acting on that information quickly. OpenObserve provides lightweight frontend monitoring with RUM, Core Web Vitals tracking, session replay, and error logging, all in one scalable observability platform.
Here’s why it stands out for frontend monitoring:
Built-in Real User Monitoring: Capture real-world metrics like LCP, INP, CLS, and TTI directly from user sessions, so your data reflects actual experience, not just lab results.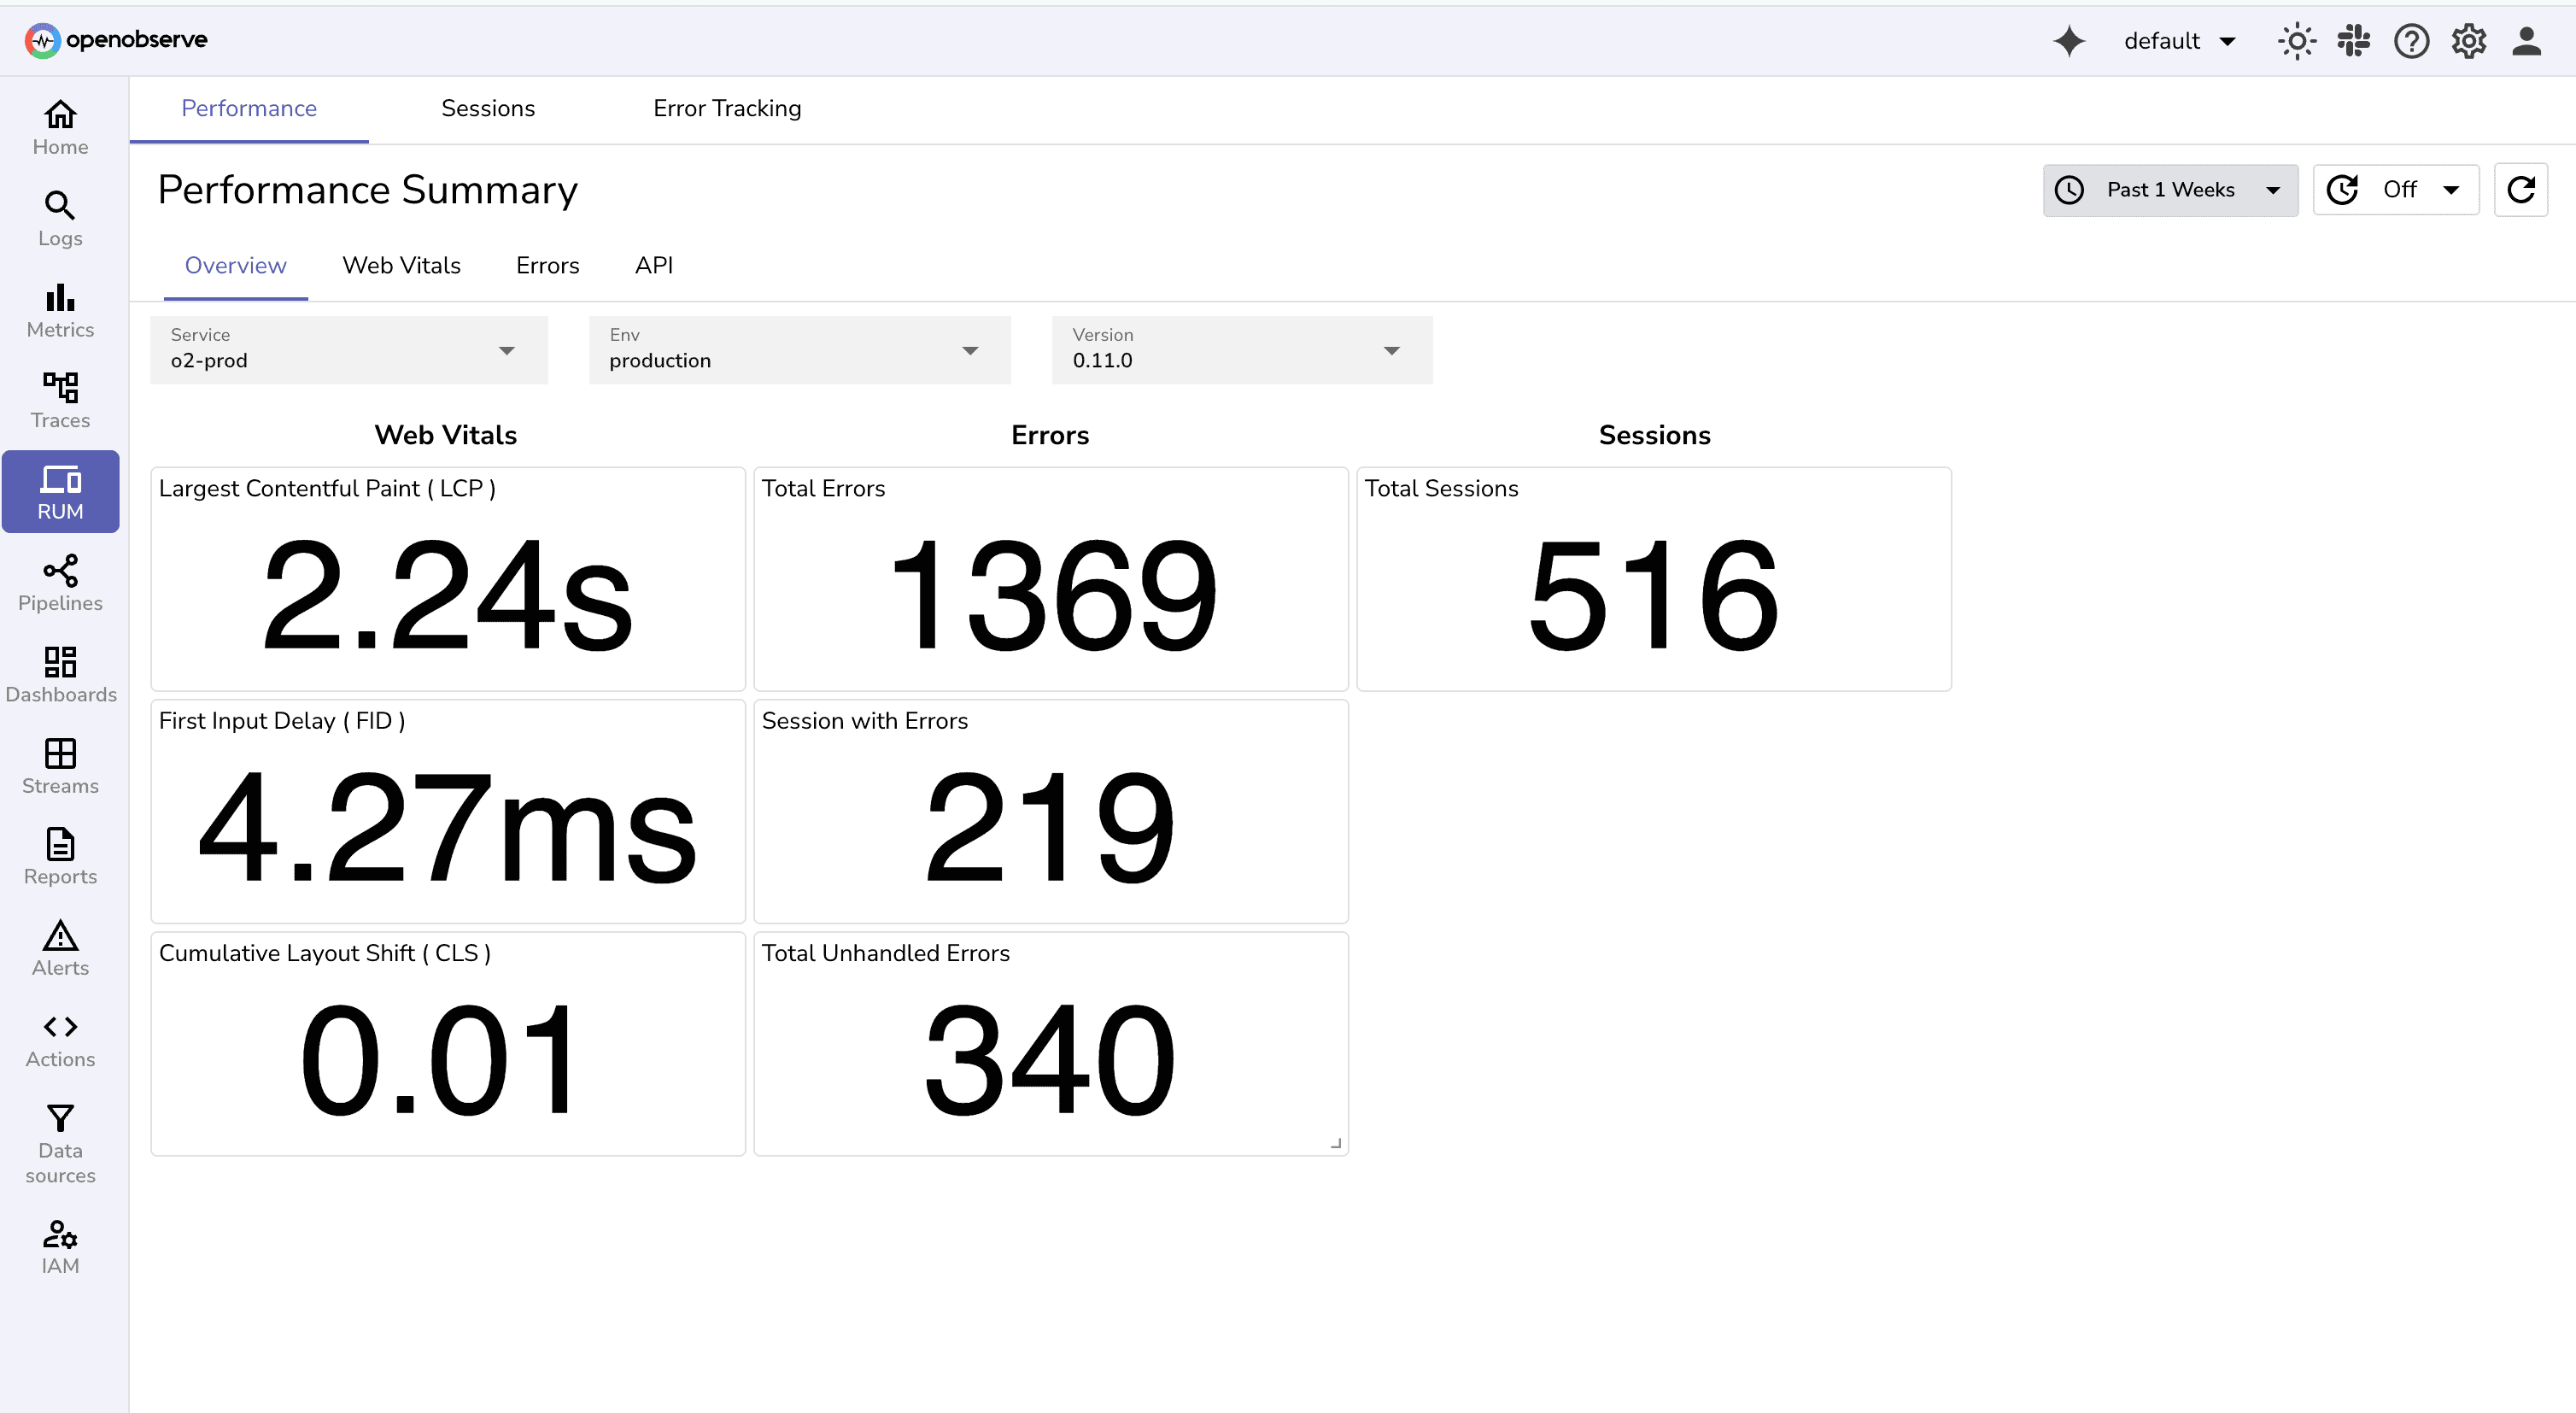
Session Replay for Faster Debugging: Watch click-by-click session replays to understand user behavior, reproduce issues, and identify friction points.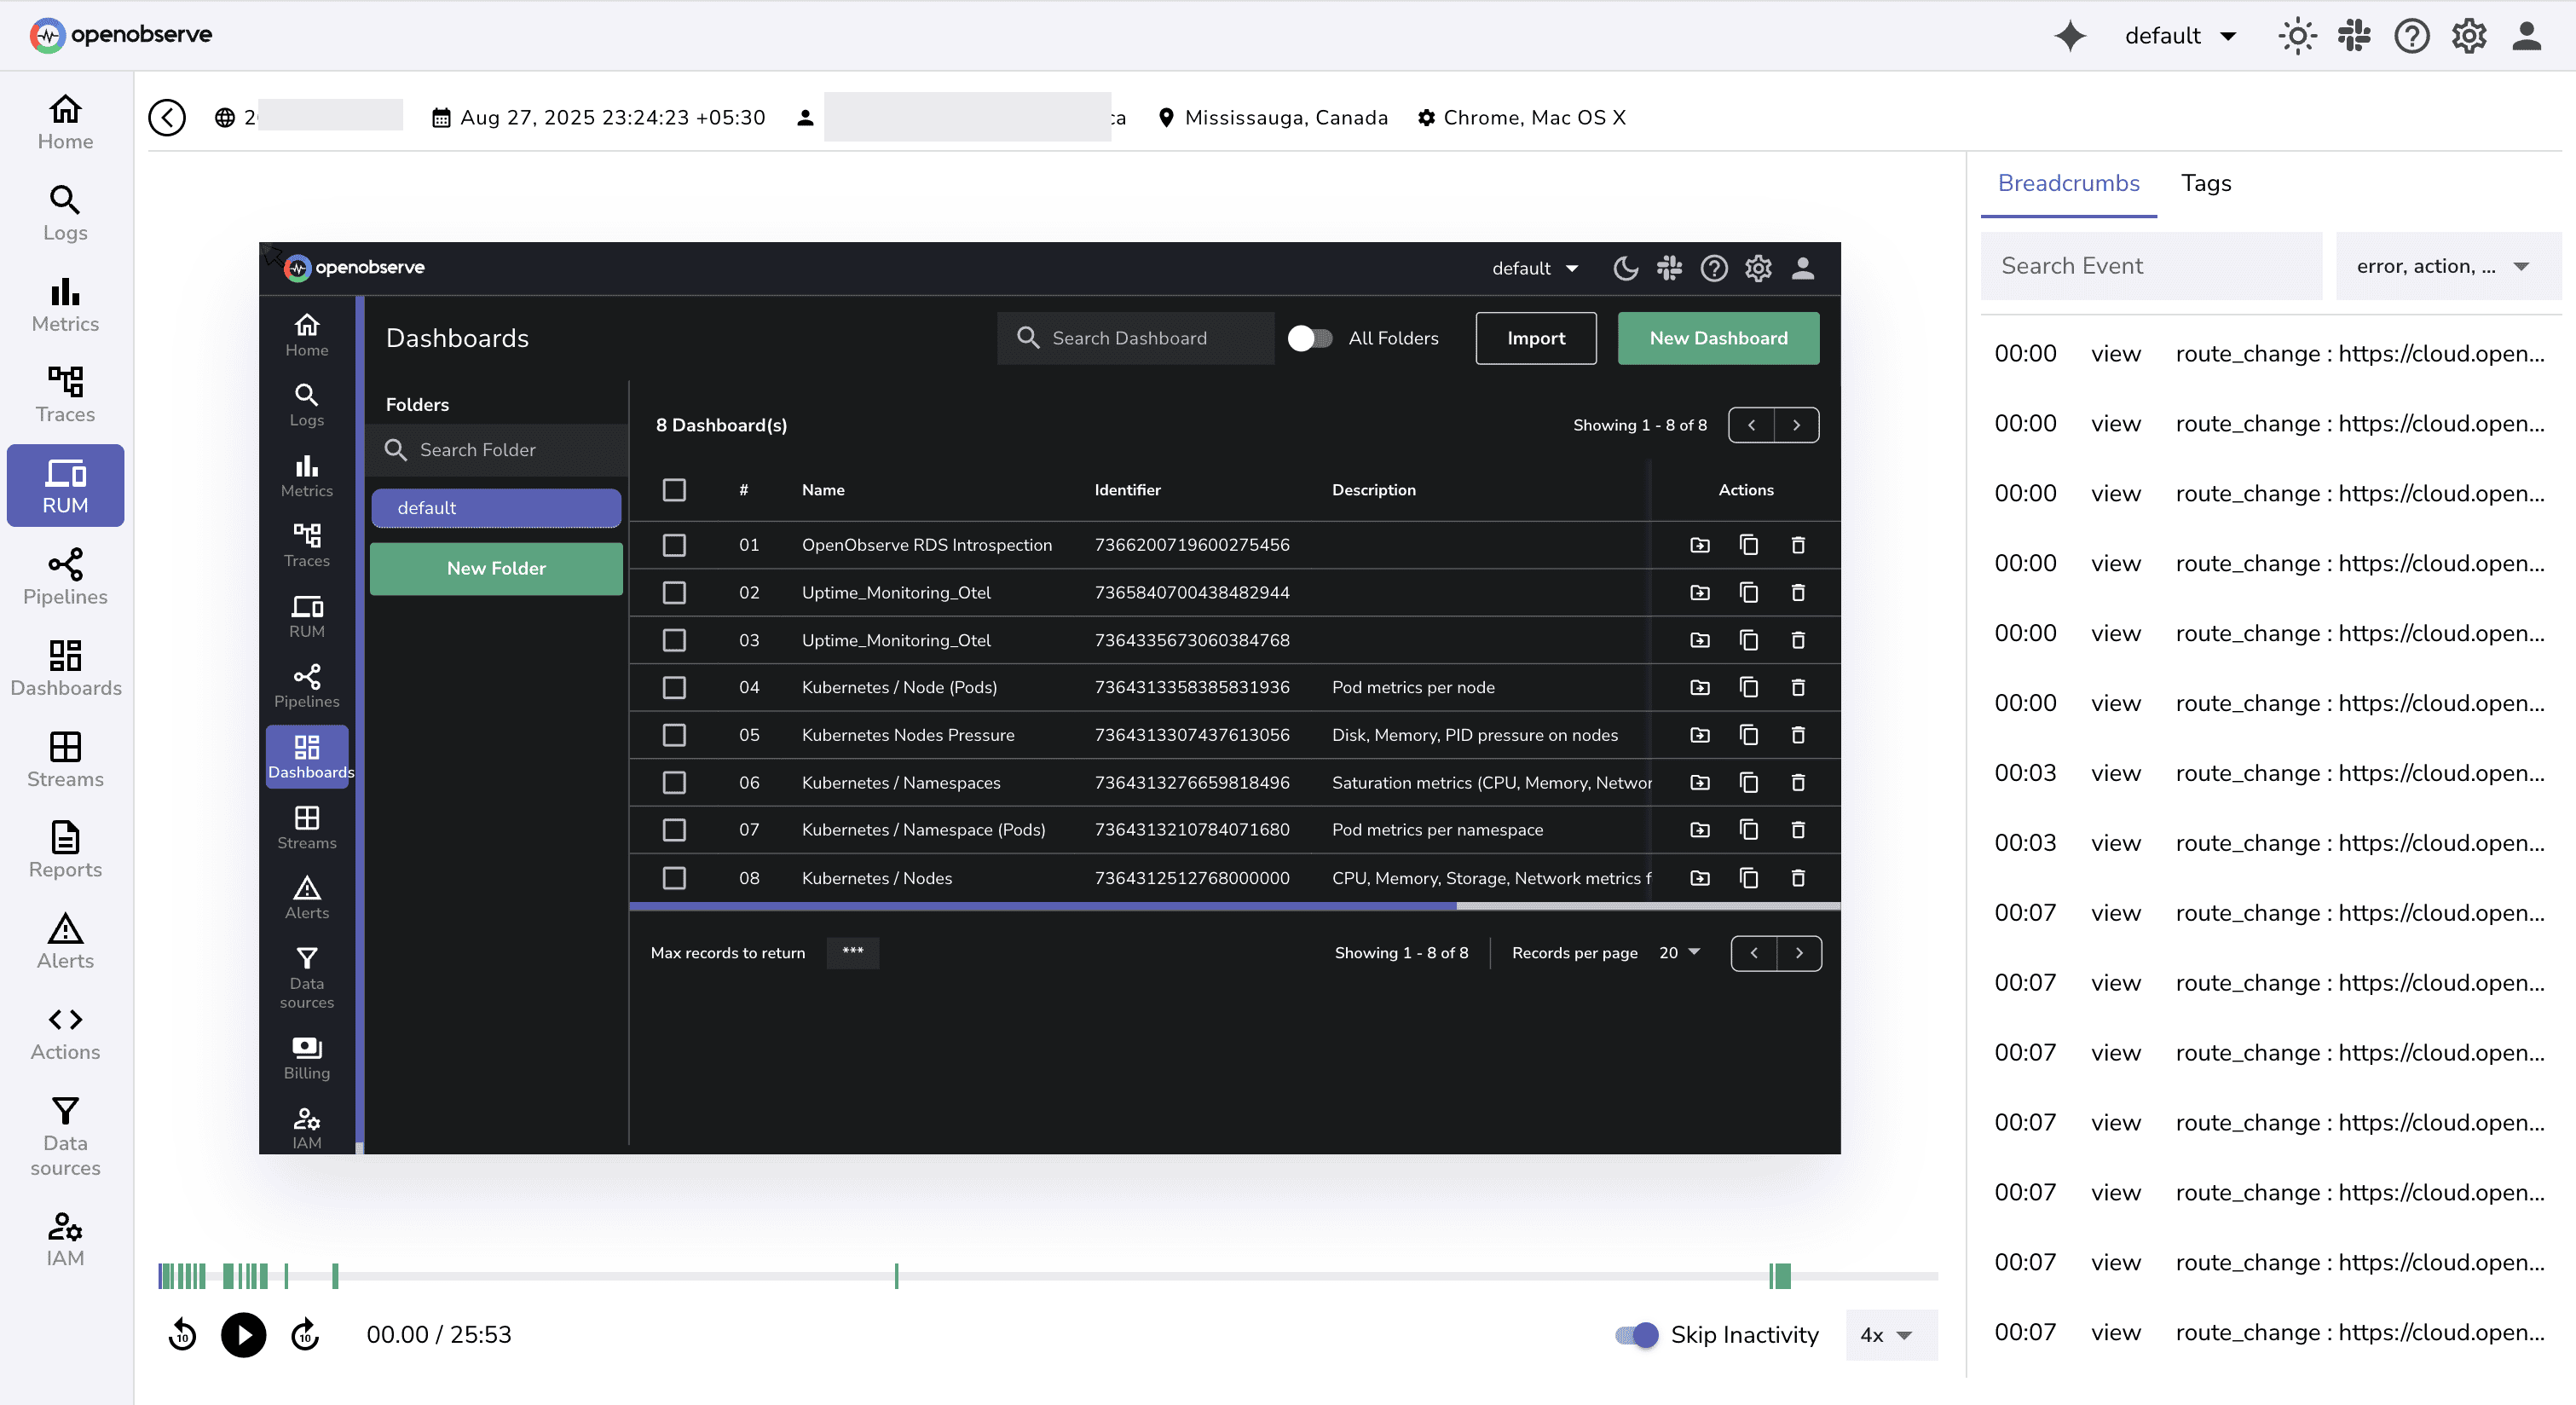
Detailed Error Tracking: Automatically log JavaScript errors with full context: stack traces, browser/OS details, and the exact steps that led to the failure.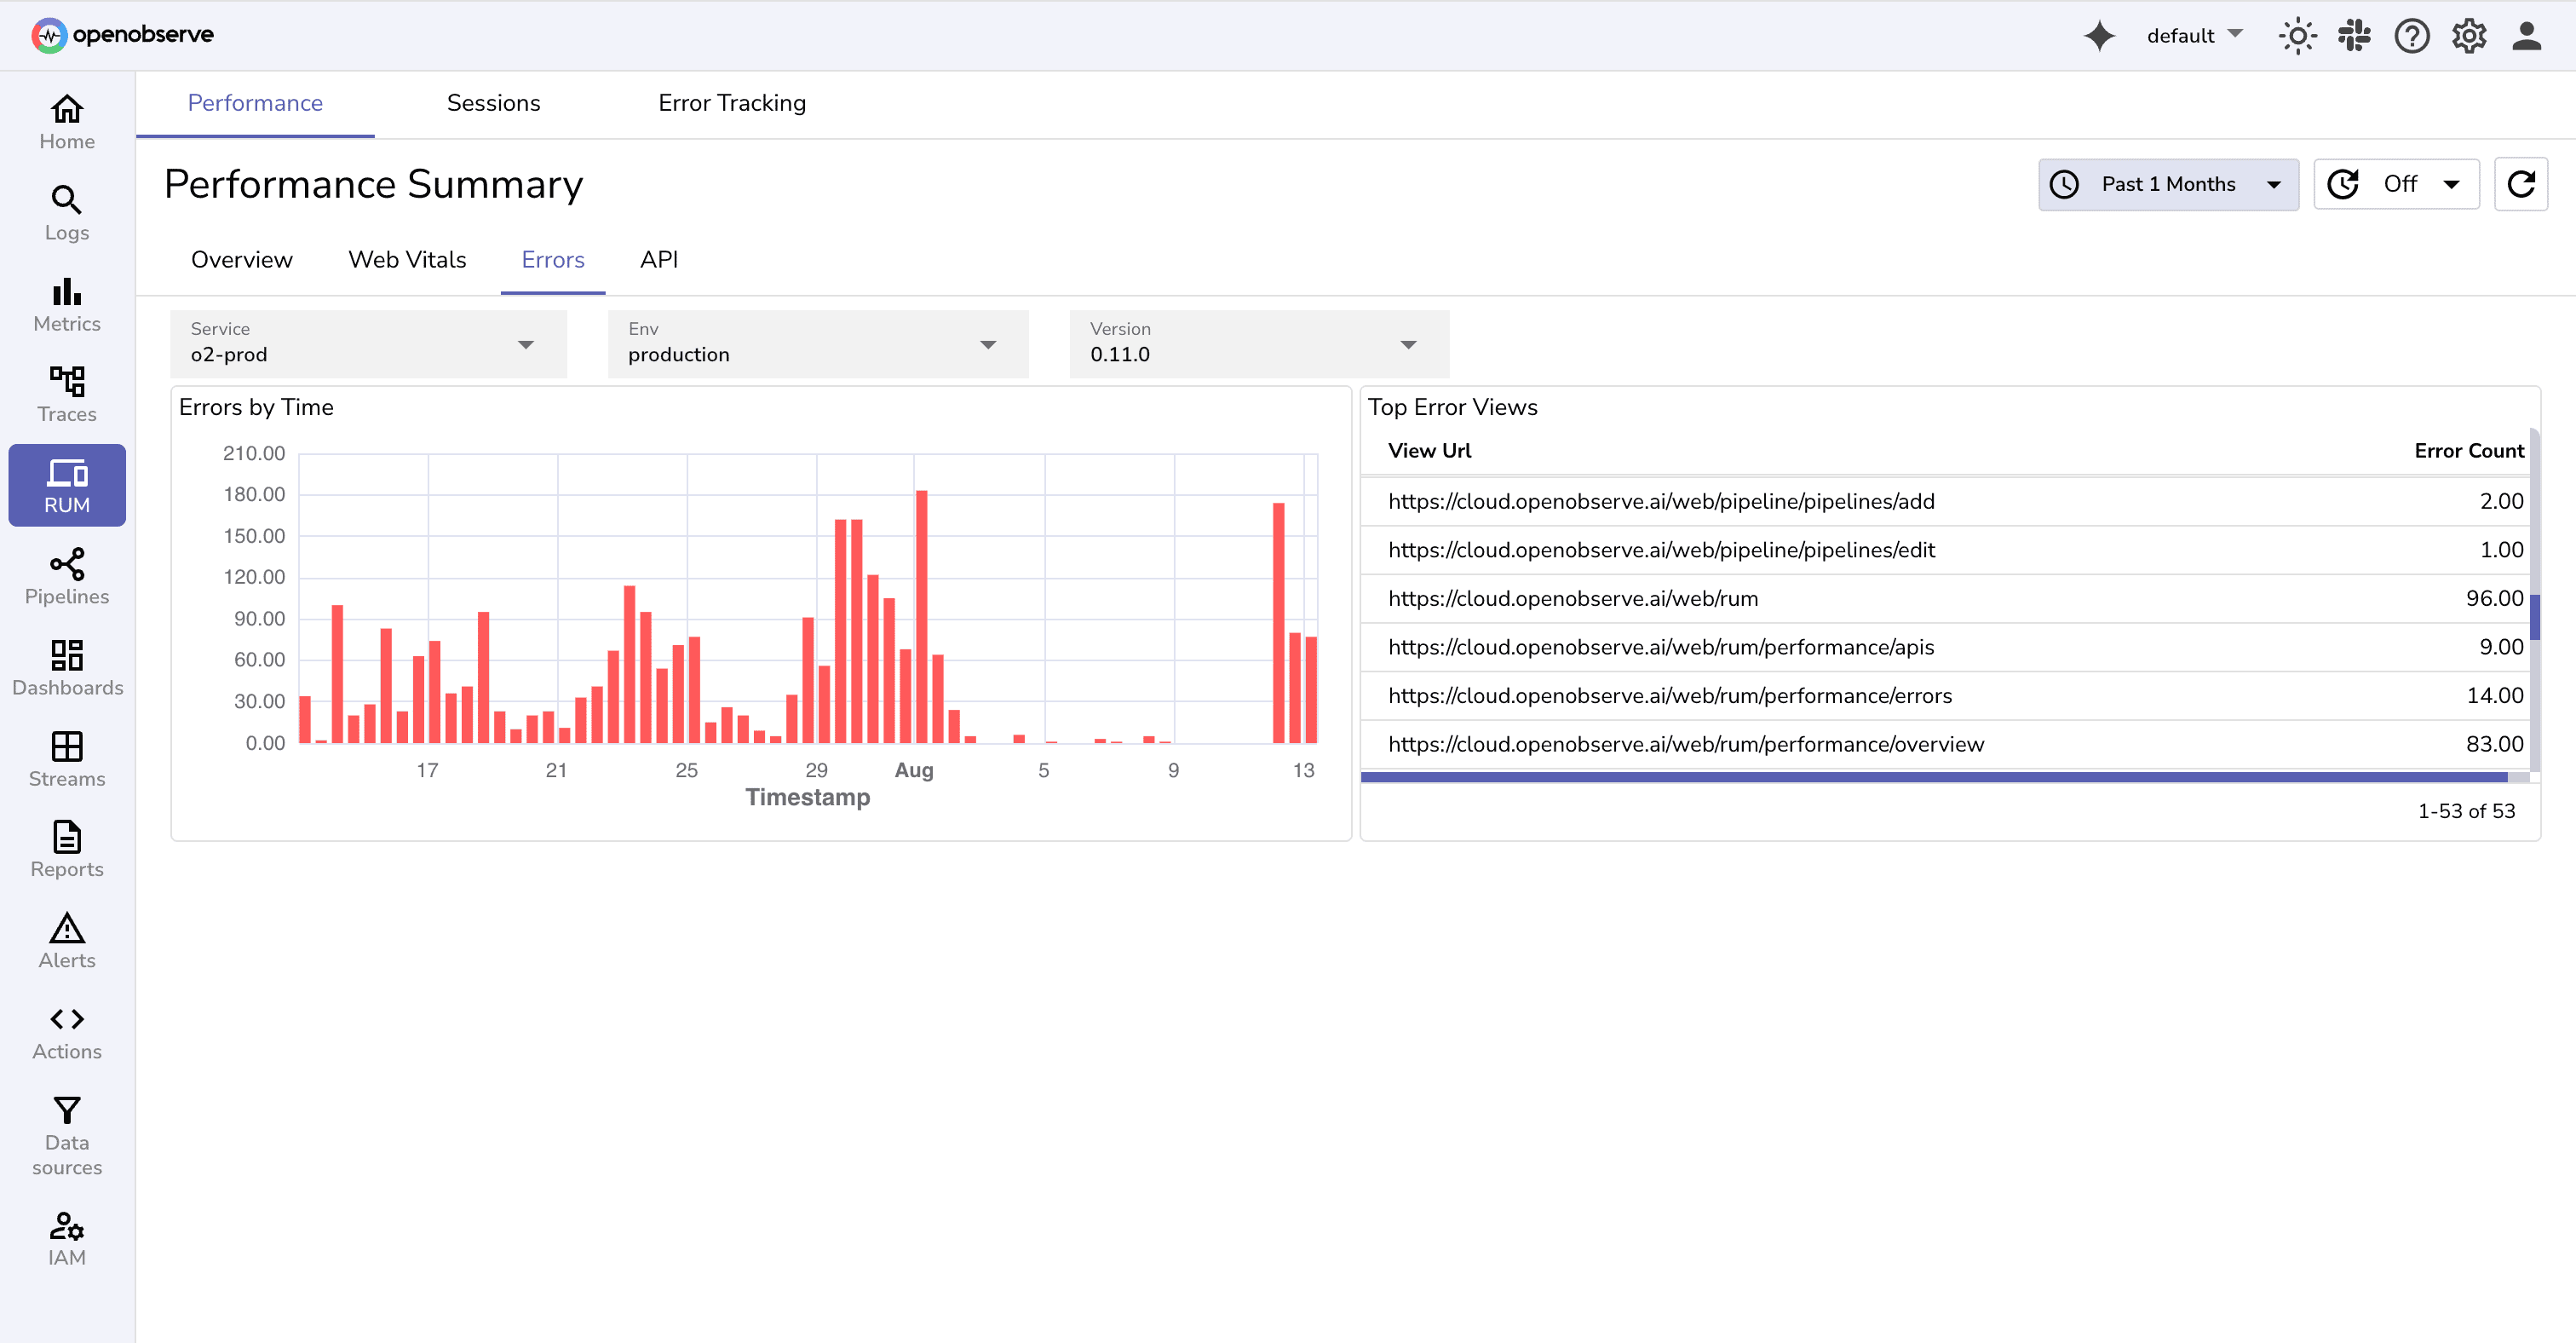
![]()
End-to-End Performance Analysis: Track load times for every asset, monitor API call latency, and correlate frontend slowdowns with backend performance.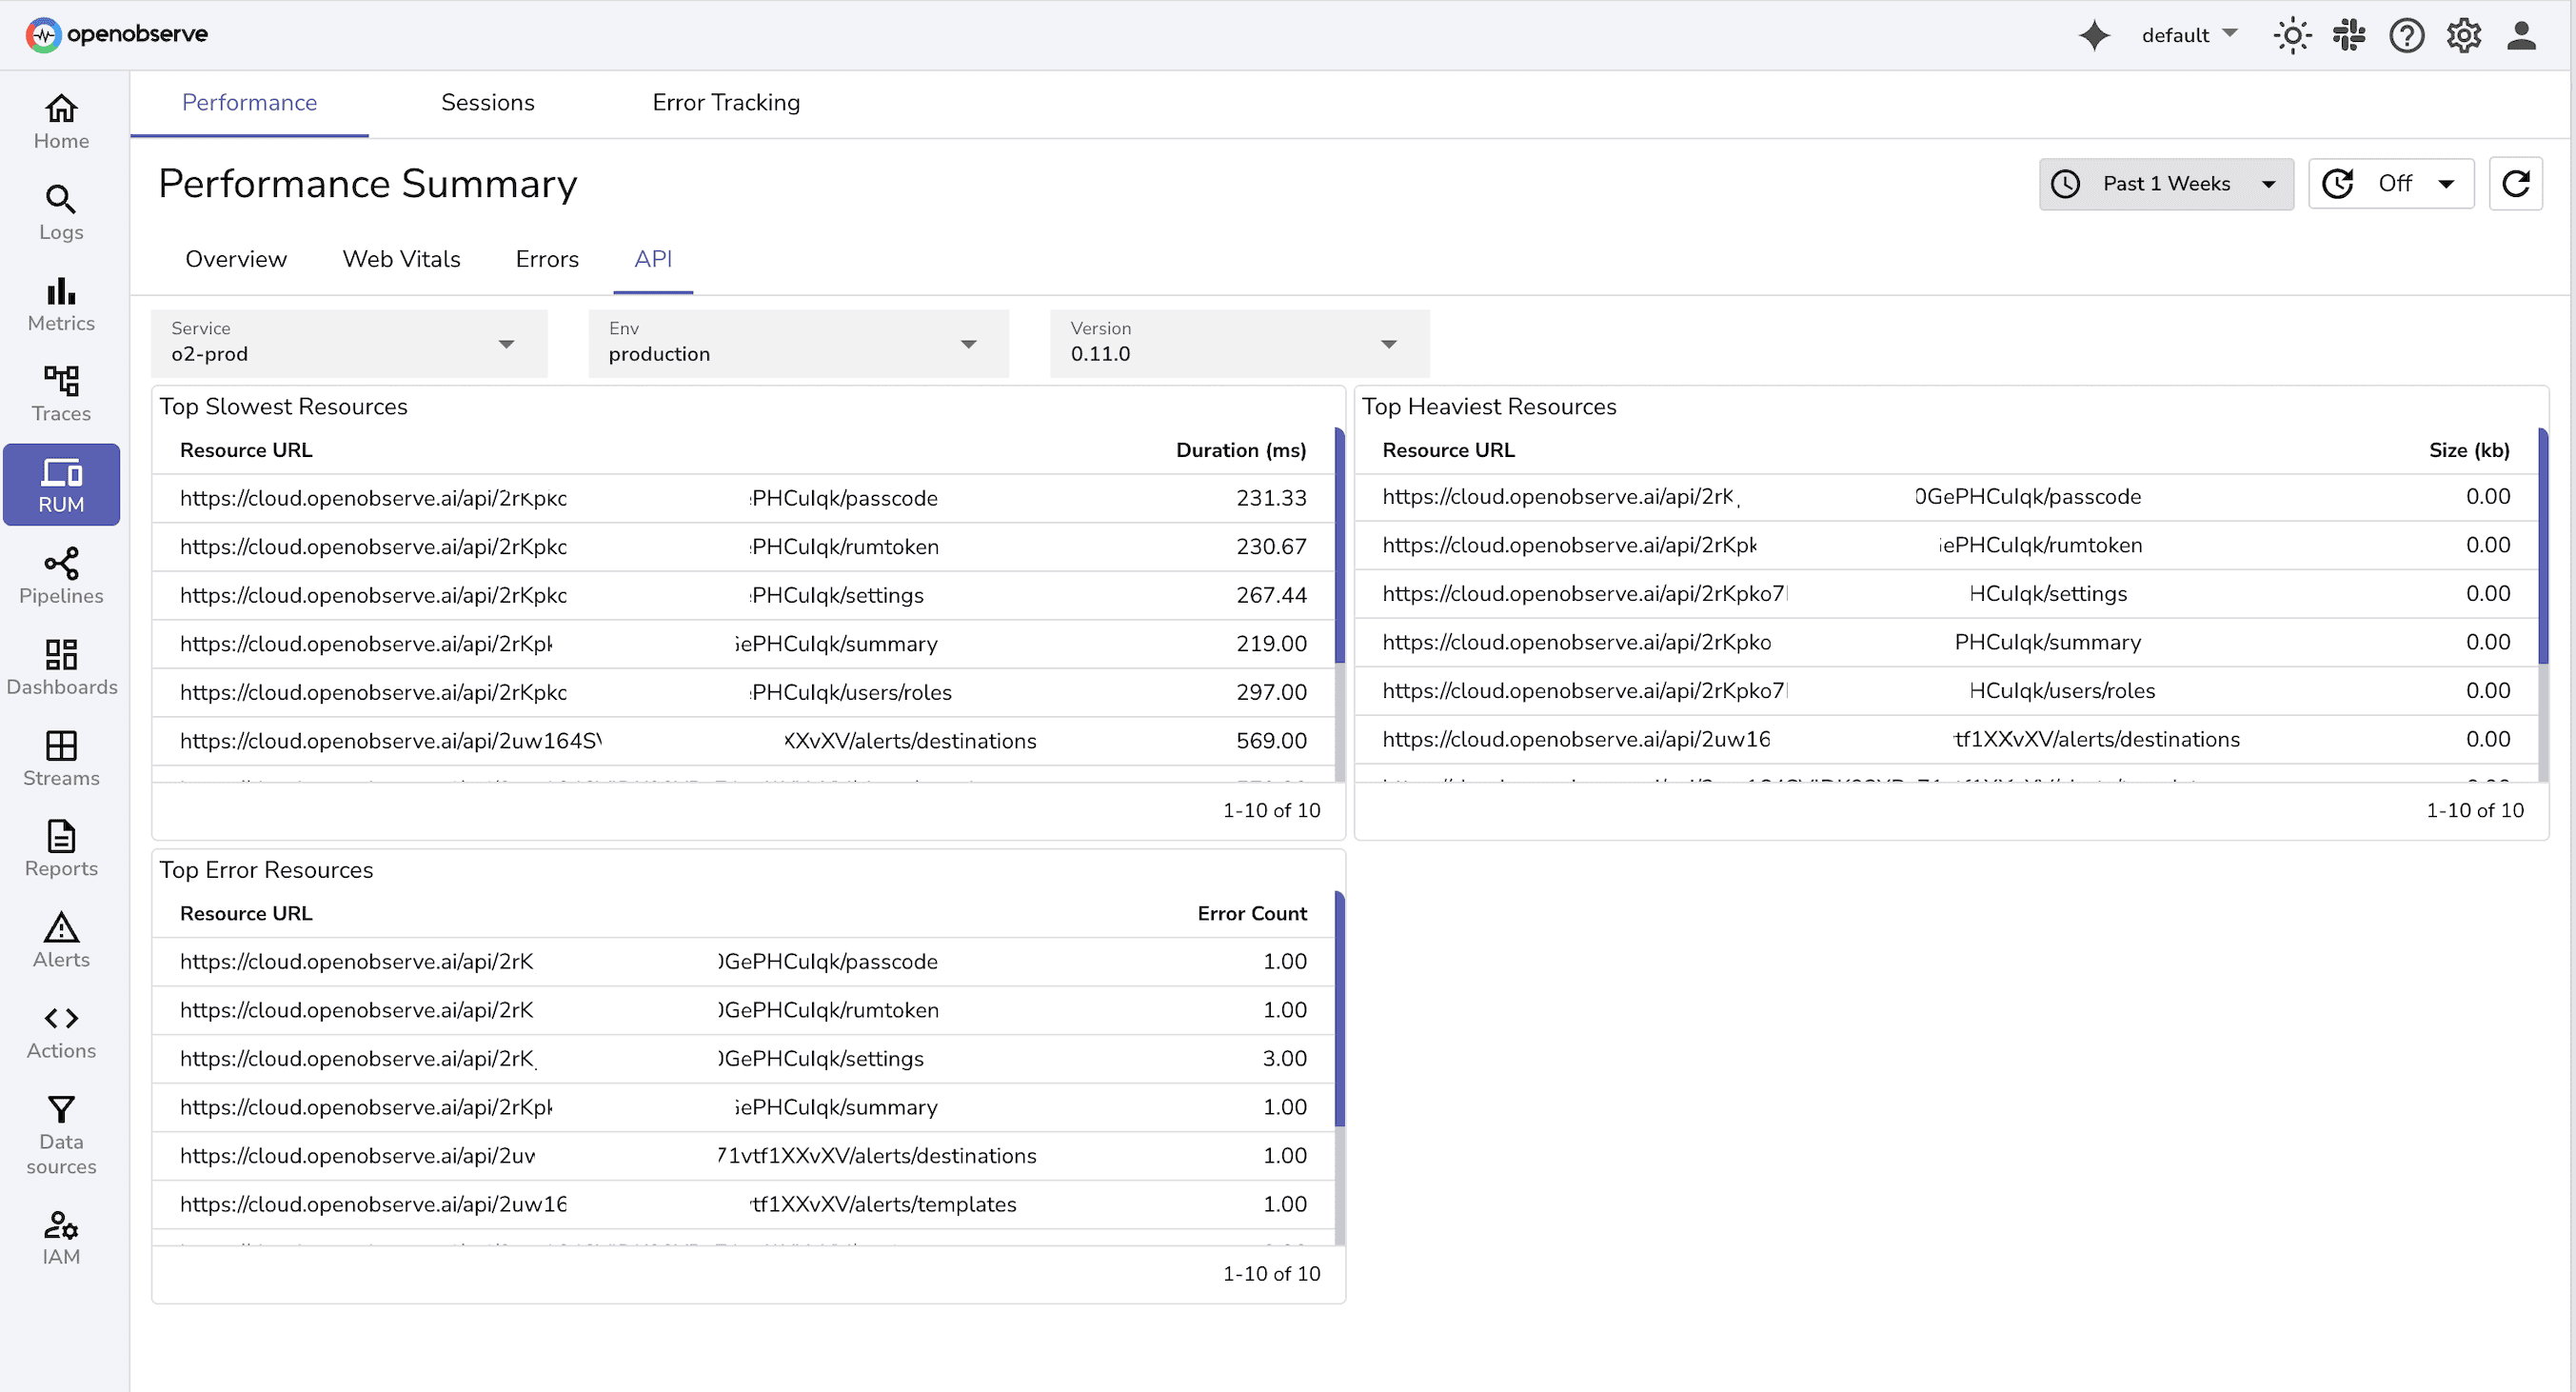
Lightweight Integration: Get started in minutes with a simple JavaScript snippet, without heavy agents or performance impact.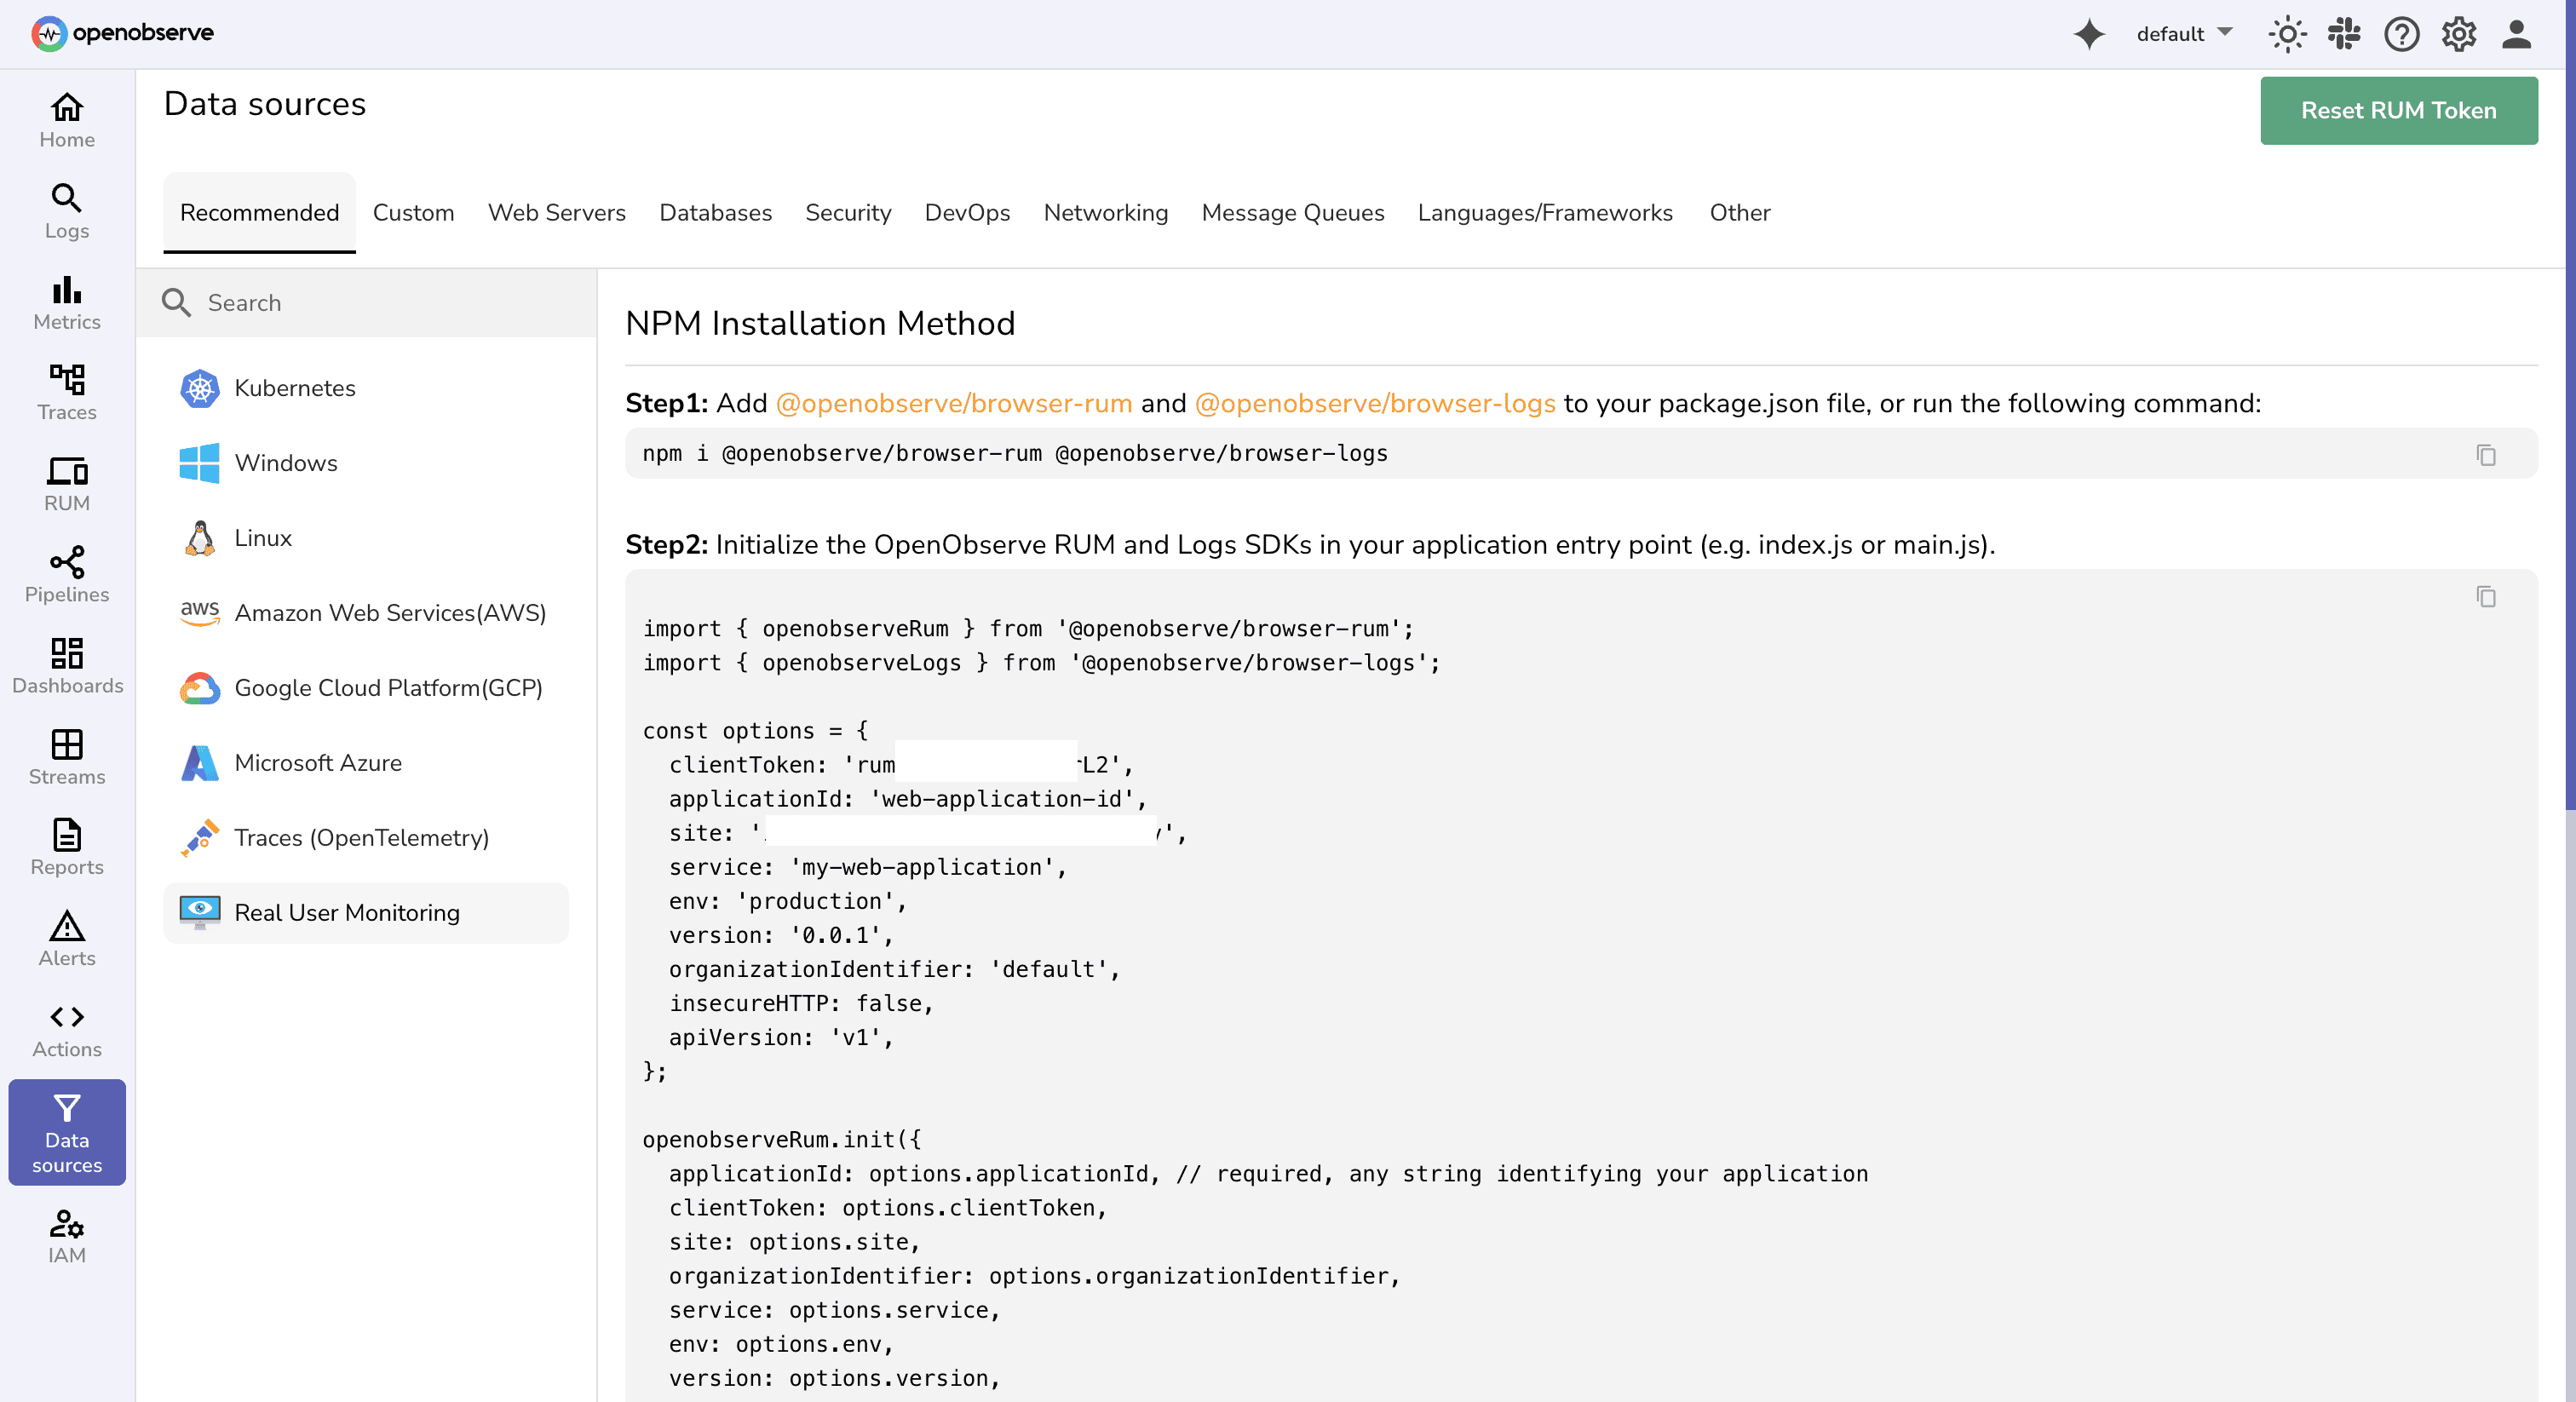
By unifying performance data, user behavior insights, and error reporting, OpenObserve makes it easier to keep your application fast, stable, and enjoyable even as it grows more complex.
Frontend monitoring is about seeing your application the way your users do every click, every load, every delay. When you track performance, errors, and user interactions in real time, you can fix problems before they spread, keep experiences smooth, and stay ahead of rising expectations. The web moves fast, and so do users; every extra second is a chance for them to leave. The sooner you start monitoring, the sooner you start keeping them.
Start your free trial of OpenObserve: a cloud-native observability platform for frontend monitoring, performance optimization, and error tracking.
With OpenObserve's comprehensive monitoring capabilities, you can identify issues before they impact users, optimize performance across all devices, and deliver the exceptional digital experiences your users expect.
Frontend monitoring is about what happens in the user's browser. For example, it involves measuring how long a website takes to load and become useful for the visitor. In contrast, backend performance monitoring focuses on what happens on the server.
We recommend starting with Google's Core Web Vitals metrics: They focus on user experience, instead of technical metrics; Google provides real user web vitals data in the CrUX dataset; Web vitals impact SEO.
OpenObserve is a cloud-native observability platform that provides comprehensive monitoring capabilities for logs, metrics, traces, and analytics. It is designed to simplify IT infrastructure oversight and offers a robust set of features for error tracking, performance monitoring, and session replay.
Passionate about observability, AI systems, and cloud-native tools. All in on DevOps and improving the developer experience.