Cloud Monitoring for AWS, Azure, and GCP with OpenObserve

Simran Kumari
November 12, 2025
11 min read
Don’t forget to share!
Try OpenObserve Cloud today for more efficient and performant observability.
Cloud monitoring has become one of those things every developer cares about yet few actually enjoy setting up. The cloud gives flexibility, speed, and scale, but it also brings complexity. Applications today are made up of hundreds of managed services, APIs, and distributed components that live across multiple layers of the stack.
And while every provider offers a built-in way to monitor resources AWS CloudWatch, Azure Monitor, GCP Operations Suite developers often end up asking the same question:
“How do I see everything that matters, in one place, without juggling three dashboards?”
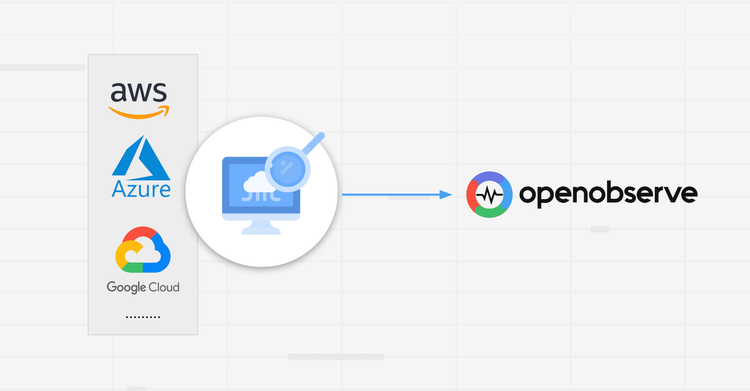
That’s where OpenObserve fits in. It gives you a way to collect, query, and visualize logs, metrics, and traces from any cloud using a single, developer-friendly platform.
Cloud monitoring goes beyond simple dashboards and metric charts. It's about gaining insight into how your entire system operates and understanding the real impact on your end users.
Broadly, it covers three layers:
This is where most developers start. You track your compute instances, containers, storage volumes, and load balancers the physical and virtual backbone of your application.
Typical signals include:
These metrics show you whether your underlying infrastructure can handle your application’s load.
Once your infrastructure is stable, the next focus is on how the code performs. You track:
This layer tells you if your users are getting a fast, reliable experience.
This includes managed services : databases, message queues, APIs, serverless functions, and Kubernetes clusters. Here, you focus on:
When viewed together, these signals form a complete picture of your system’s health.
Despite access to sophisticated tools, engineering teams consistently encounter several obstacles:
Your observability stack becomes siloed by design. Logs stream to one platform, metrics flow to another dashboard, and distributed traces live in a third system. Piecing together a complete incident timeline means toggling between multiple interfaces, each with its own query language and authentication flow.
Each cloud provider implements monitoring differently. AWS CloudWatch, Azure Monitor, and Google Cloud Operations use distinct APIs, data formats, and metric namespaces. Multi-cloud deployments multiply this complexity; you end up maintaining separate instrumentation code and learning different mental models for essentially the same task.
When everything generates alerts, nothing feels urgent. Teams configure thresholds for dozens or hundreds of metrics, resulting in a constant stream of notifications. Critical issues get buried under minor fluctuations, and engineers start ignoring alerts altogether. The signal-to-noise ratio degrades until monitoring becomes background noise.
Tracing a single user request as it traverses your microservices architecture remains surprisingly difficult. A failed checkout might involve your API gateway, three backend services, two databases, and a payment provider. Without proper correlation IDs and unified tracing, you see isolated failures in each component but miss the causal chain connecting them.
The core problem isn't lack of visibility, it's absence of context. You can see what happened and when, but understanding why requires manually connecting the dots across fragmented data sources.
CloudWatch monitors 80+ AWS services natively but shows limitations in cross-service correlation. Key specifications:
Architectural constraint: CloudWatch Insights queries scan raw logs rather than indexed data, causing P95 query latencies exceeding 30 seconds for datasets over 1TB. Multi-region deployments require separate dashboards per region, no unified query interface exists.
Azure Monitor integrates with 100+ Azure services and supports hybrid cloud scenarios through Arc agents. Technical specifications:
KQL provides faster aggregations than CloudWatch Insights; P95 latency under 5 seconds for queries spanning 100GB. However, Azure Monitor workspaces are region-bound; cross-region analysis requires workspace federation with increased query complexity.
GCP Operations handles logs, metrics, and traces through Cloud Logging and Cloud Monitoring. Architecture details:
Operations Suite excels at GKE (Google Kubernetes Engine) observability with automatic trace correlation. Limitation: cross-project queries require BigQuery export, adding $5/TB processing costs and 10-15 minute data lag.
| Cloud | Built-in Tool | Query Language | Retention | Cross-Region Support | Limitation |
| AWS | CloudWatch | Logs Insights | 1–∞ days | ❌ | Slow queries >1TB |
| Azure | Monitor | KQL | 30–90 days | ⚠️ Federation only | Region-bound |
| GCP | Operations Suite | MQL | 30–400 days | ⚠️ via BigQuery | Export lag |
Note on Pricing and Figures:
The pricing figures ($0.50/GB,$0.30/GB$, etc.) and constraints (e.g., query limits, performance latencies) are based on the most common Pay-As-You-Go tiers and US-East regions published in the respective cloud provider's public documentation (AWS, Azure, GCP) as of late 2025. These figures are subject to change and should be considered general estimates for comparative analysis. Actual costs will vary significantly based on your organization's specific pricing agreements, region, and commitment tiers.
OpenObserve is built to make cloud monitoring less painful and more developer-centric.
It acts as a unified observability layer, bringing together all your telemetry whether it comes from AWS, Azure, or your on-prem systems. Everything can be queried using SQL, which makes it intuitive for developers.
Here’s what that means in practice:
| Feature / Capability | Native Cloud Tools (CloudWatch, Azure Monitor, GCP Ops Suite) | OpenObserve |
| Multi-Cloud Visibility | ❌ Limited to their own cloud | ✅ Unified dashboard for AWS, Azure, and GCP |
| Query Language | ⚠️ Different DSLs (KQL, MQL, Logs Insights) | ✅ One SQL language for all telemetry |
| Performance at Scale | ⚠️ Slows down on large datasets | ✅ Columnar indexing ensures fast queries |
| Cross-Region Correlation | ❌ Region-bound dashboards | ✅ Full trace correlation across services and applications |
| Pricing Model | ⚠️ Pay-per-query and GB scanned | ✅ Transparent, flat-rate storage pricing |
| Vendor Lock-In | ⚠️ Tied to a specific cloud | ✅ Works across clouds or on-prem |
AWS users can stream logs and metrics directly into OpenObserve using Firehose, Lambda, or S3.
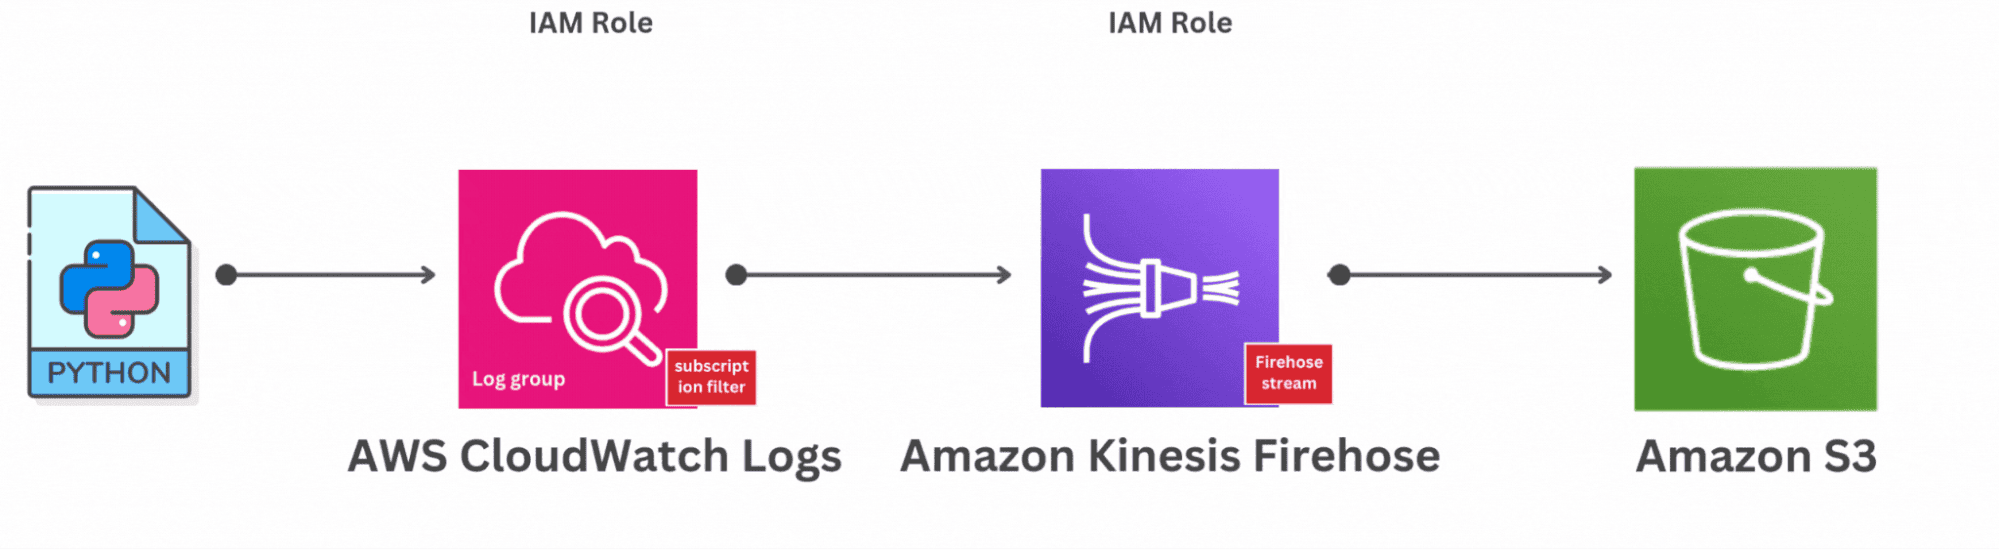 Once data starts flowing, you can visualize EC2 CPU usage, Lambda duration, or VPC Flow Logs in real time. You can also build SQL-based dashboards for API Gateway latency or RDS query errors ,metrics that otherwise stay buried in CloudWatch.
The best part is that AWS data can live beside your Azure and GCP telemetry, making cross-cloud comparisons effortless.
Azure users often rely on Azure Monitor and App Insights, but both stop at the platform boundary. With OpenObserve, you can go further.
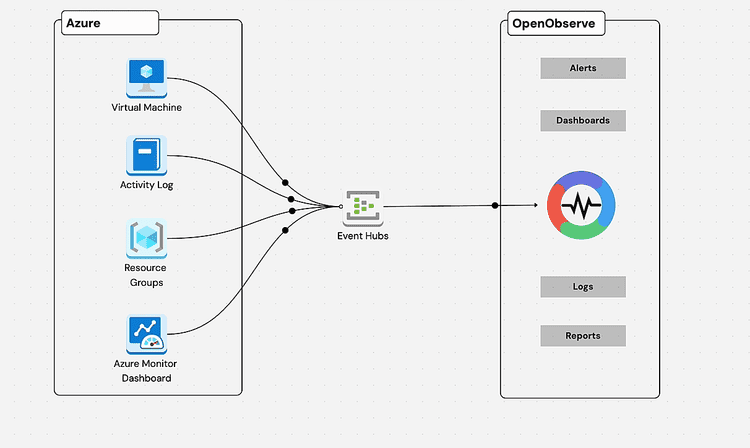
Logs can be streamed through Azure Diagnostic Settings or Event Hubs, and metrics from Application Insights can be ingested alongside them. Once inside OpenObserve, you can correlate Azure function latency with external dependencies, or view CPU and request patterns.
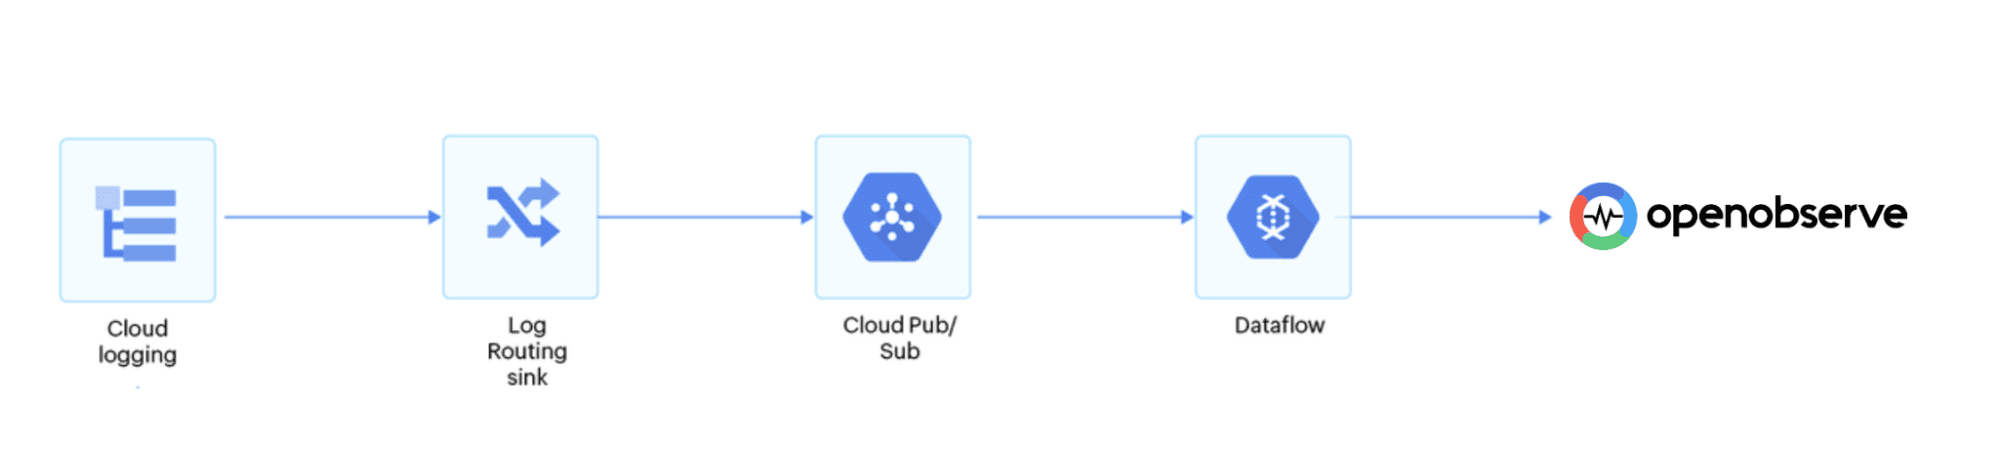
For GCP, integration happens via Pub/Sub or Cloud Logging sinks.Once connected, your GCP metrics and logs appear just like any other data source letting you visualize BigQuery performance, API error rates, or instance utilization together with AWS and Azure data.
No translation layers, no extra storage, just one clean observability pipeline.
If you want to go deeper into specific setups, check out:
Each of these covers real setup steps and sample queries for their respective platforms.
Cloud monitoring shouldn’t feel like a chore. Developers deserve clear, unified visibility into how their systems behave, not just dashboards full of disconnected metrics.
OpenObserve makes this easier by connecting all your telemetry into a single, queryable platform. You don’t need to learn three tools or jump between consoles just one space where your logs, metrics, and traces all make sense together.
Whether you’re running on Azure, AWS, or anywhere else ; monitoring should feel simple, not scattered.
Get Started with OpenObserve Today! Sign up for a free cloud trial.
What is cloud monitoring?
Cloud monitoring is the practice of collecting and analyzing logs, metrics, and traces from your cloud infrastructure and applications to ensure availability, performance, and reliability. It helps you detect issues early and understand their root cause across distributed systems.
Why is unified cloud monitoring important?
Most teams use multiple clouds AWS for compute, Azure for identity, GCP for data. Native monitoring tools like CloudWatch, Azure Monitor, and Cloud Operations work well individually, but they don’t talk to each other. A unified solution like OpenObserve gives you one place to analyze all telemetry, eliminating blind spots and reducing context-switching.
Can I monitor AWS, Azure, and GCP together using OpenObserve?
Yes. OpenObserve lets you ingest and visualize data from all major cloud providers. You can forward logs via AWS Firehose, Azure Event Hubs, or GCP Pub/Sub and query everything using SQL.
How is OpenObserve different from CloudWatch or Azure Monitor?
OpenObserve isn’t tied to any single cloud. Unlike CloudWatch or Azure Monitor, it provides a unified query layer, supports all telemetry types (logs, metrics, traces), and uses SQL instead of custom query languages. That means less time learning DSLs and more time analyzing data.
Passionate about observability, AI systems, and cloud-native tools. All in on DevOps and improving the developer experience.


