DataDog vs OpenObserve Part 7: Pipelines - Datadog Alternative in 2026

Simran Kumari
January 16, 2026
10 min read
Don’t forget to share!
Try OpenObserve Cloud today for more efficient and performant observability.
Your log pipeline processed 2.3 billion events last month. But 40% of that volume was noise, debugged logs from a chatty microservice, duplicate events from retried requests, and verbose JSON payloads that could have been flattened. You wanted to filter them at ingestion, but Datadog's Observability Pipelines required deploying a separate Worker infrastructure, and the per-GB pricing for processed data made filtering economically questionable.
This is the hidden complexity of Datadog's pipeline model: processing power requires separate infrastructure, Grok parsing demands specialized syntax knowledge, and cost optimization becomes its own engineering project. Teams ask "can we afford to process this?" instead of "how should we transform this data?"
This hands-on comparison tests DataDog and OpenObserve for data pipelines, sending identical production-like data to both platforms simultaneously. The results show how these platforms handle log parsing, data transformation, routing, enrichment, and cost structure with the same OpenTelemetry-instrumented workload. OpenObserve transforms the fundamental question from "can we afford to process this?" to "how do we want to transform this data?" The platform provides comprehensive pipeline capabilities without infrastructure overhead or per-GB processing costs.
This is Part 7 in a series comparing DataDog and OpenObserve for observability:
__
We configured identical pipeline scenarios covering standard data processing needs: filtering debug-level events, routing security logs to separate streams, enriching logs with GeoIP data, and redacting PII from payment service logs, all using the OpenTelemetry Astronomy Shop demo.
All services were instrumented with OpenTelemetry SDKs sending logs, metrics, and traces to the OTel Collector, which exported to both DataDog and OpenObserve simultaneously. Same data, same timestamps, same volumes. We then created equivalent pipelines in both platforms to process identical log streams and measured transformation complexity, processing latency, and operational overhead.
Processing observability data at scale requires an architecture that can transform, filter, and route events efficiently. Datadog uses separate systems for each telemetry type: Log Pipelines, Metrics Pipelines, and APM Ingestion Controls while OpenObserve processes logs, metrics, and traces through a single unified pipeline system with zero additional deployment.
Datadog offers distinct pipeline systems for each telemetry type, each with its own configuration interface, processing model, and limitations.
OpenObserve simplifies the workflow with a single pipeline system for all telemetry types. Logs, metrics, and traces flow through the same visual canvas with the same VRL functions.
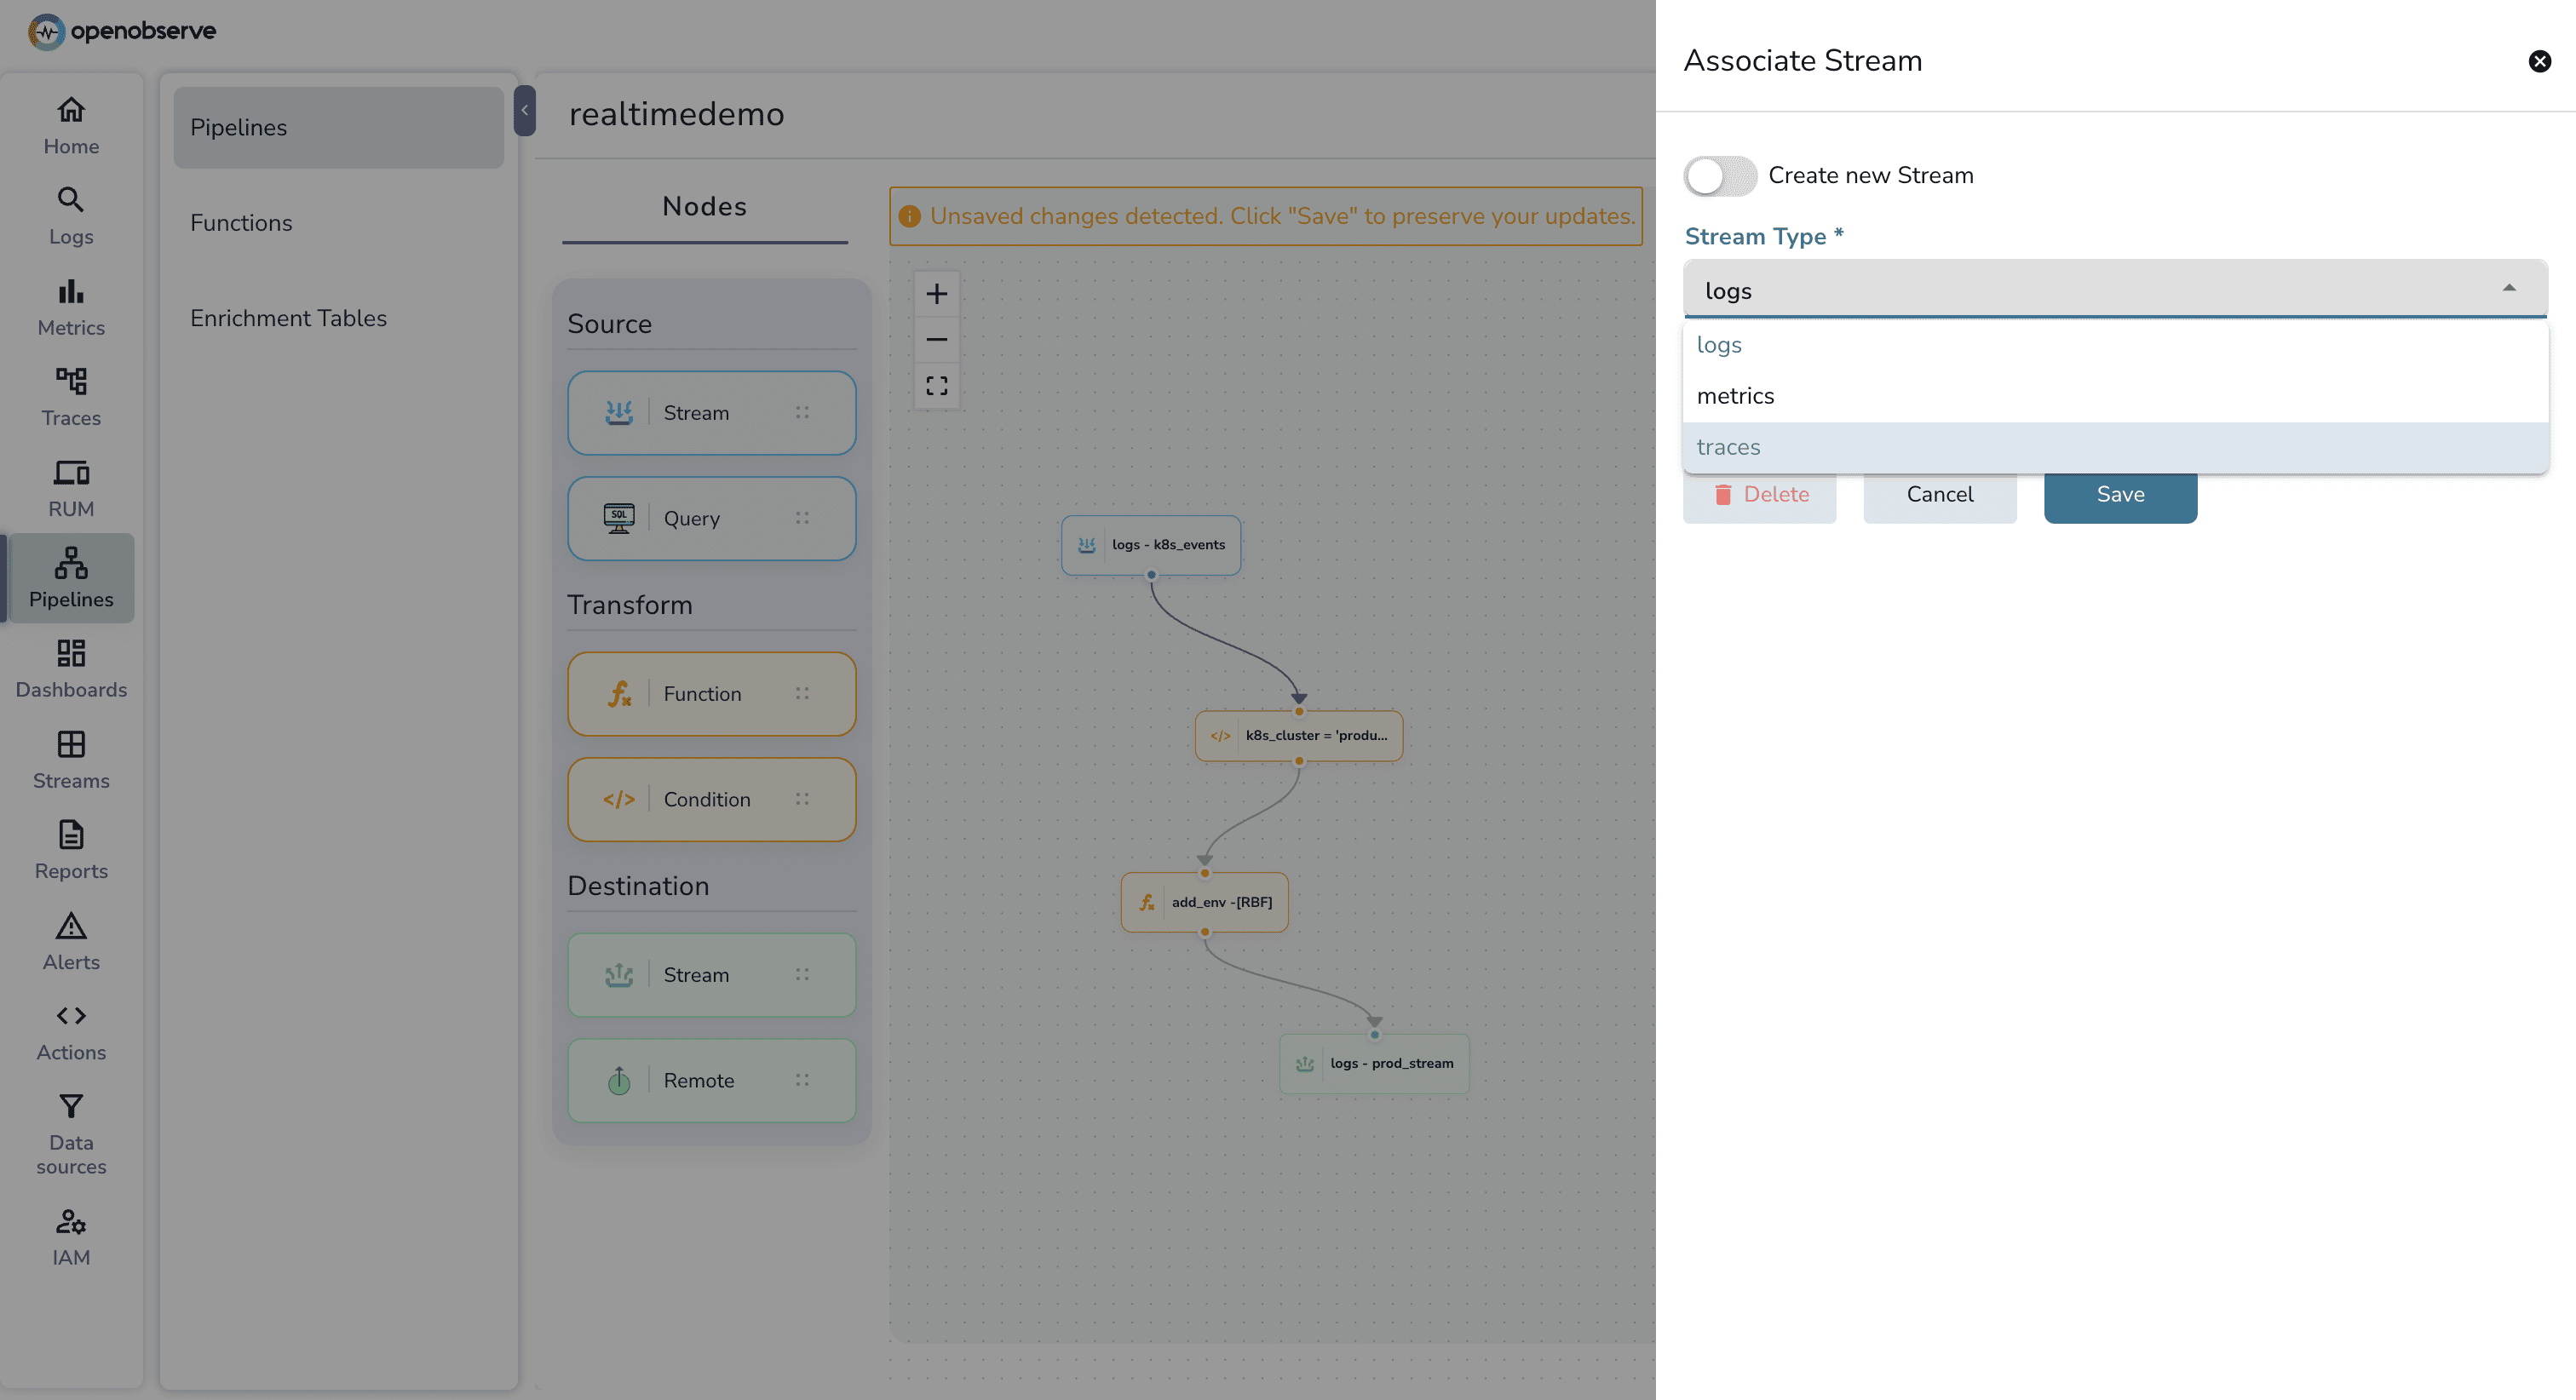
if/else, loops, and dynamic enrichment table lookups in a single script.Datadog's processing power is distributed across layers that don't always communicate.
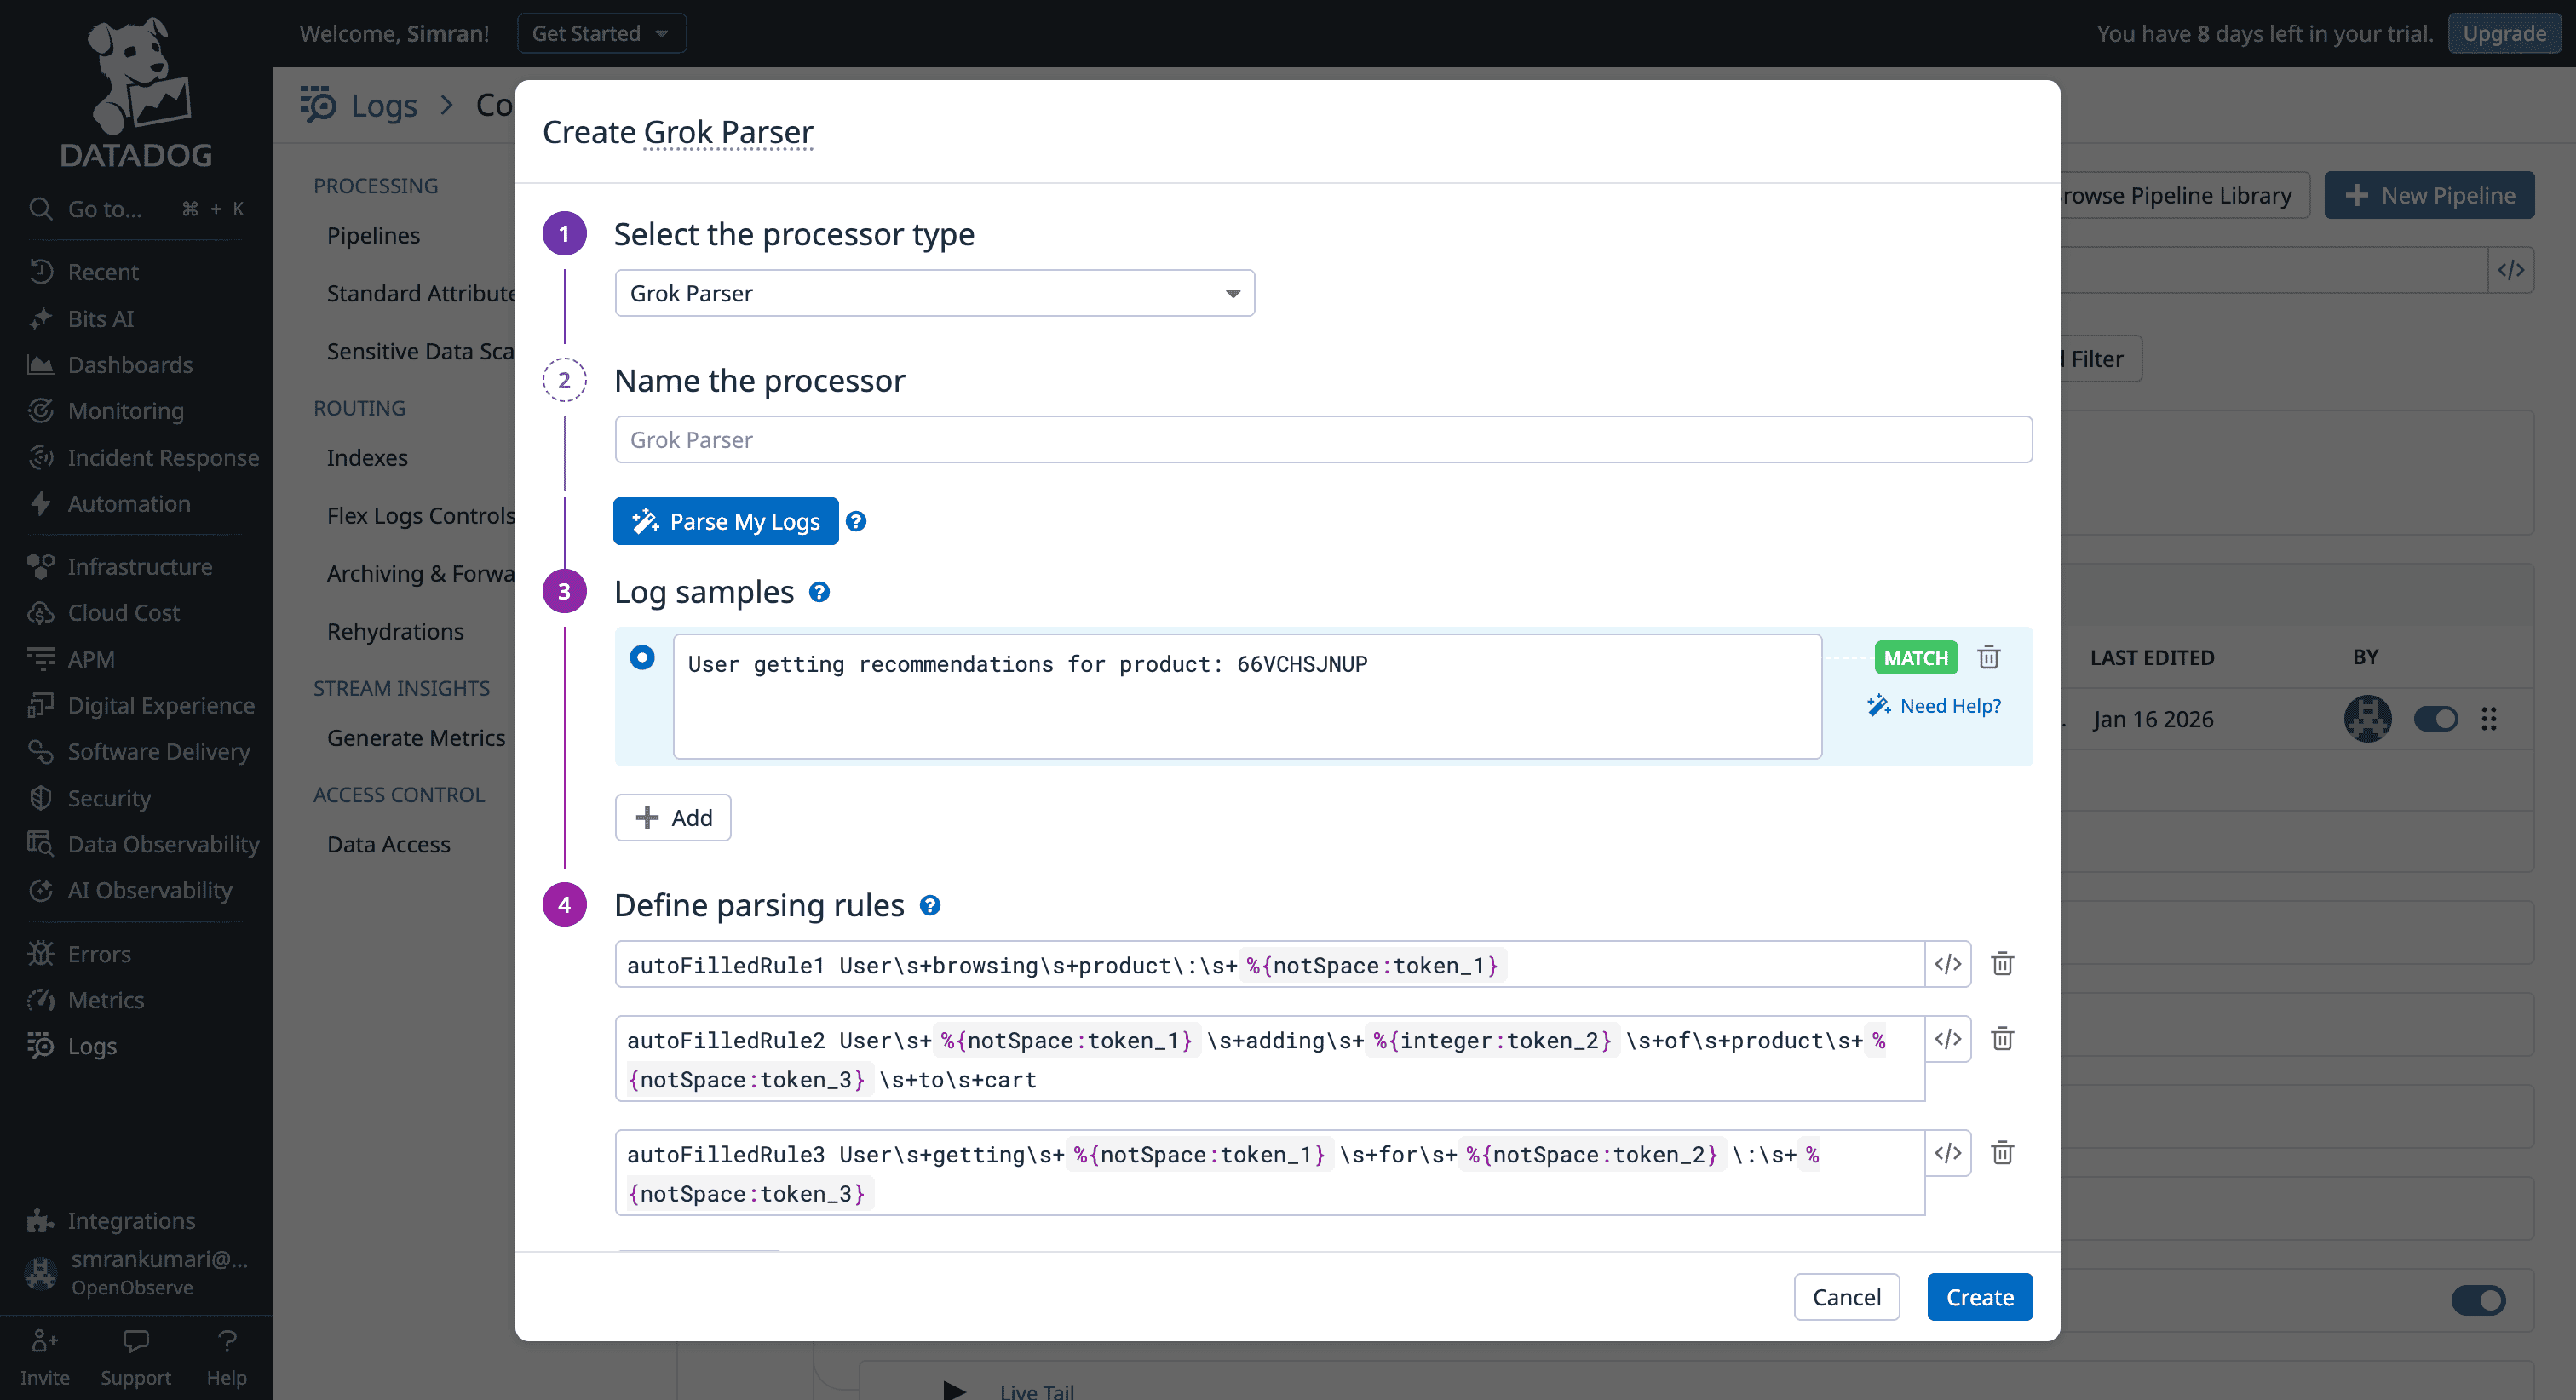
Log Pipelines (Grok/UI): Most SaaS-side processing is restricted to a linear chain of processors. If you want to perform a "conditional lookup," you are often forced to create multiple parallel pipelines with different filters, which is difficult to audit.
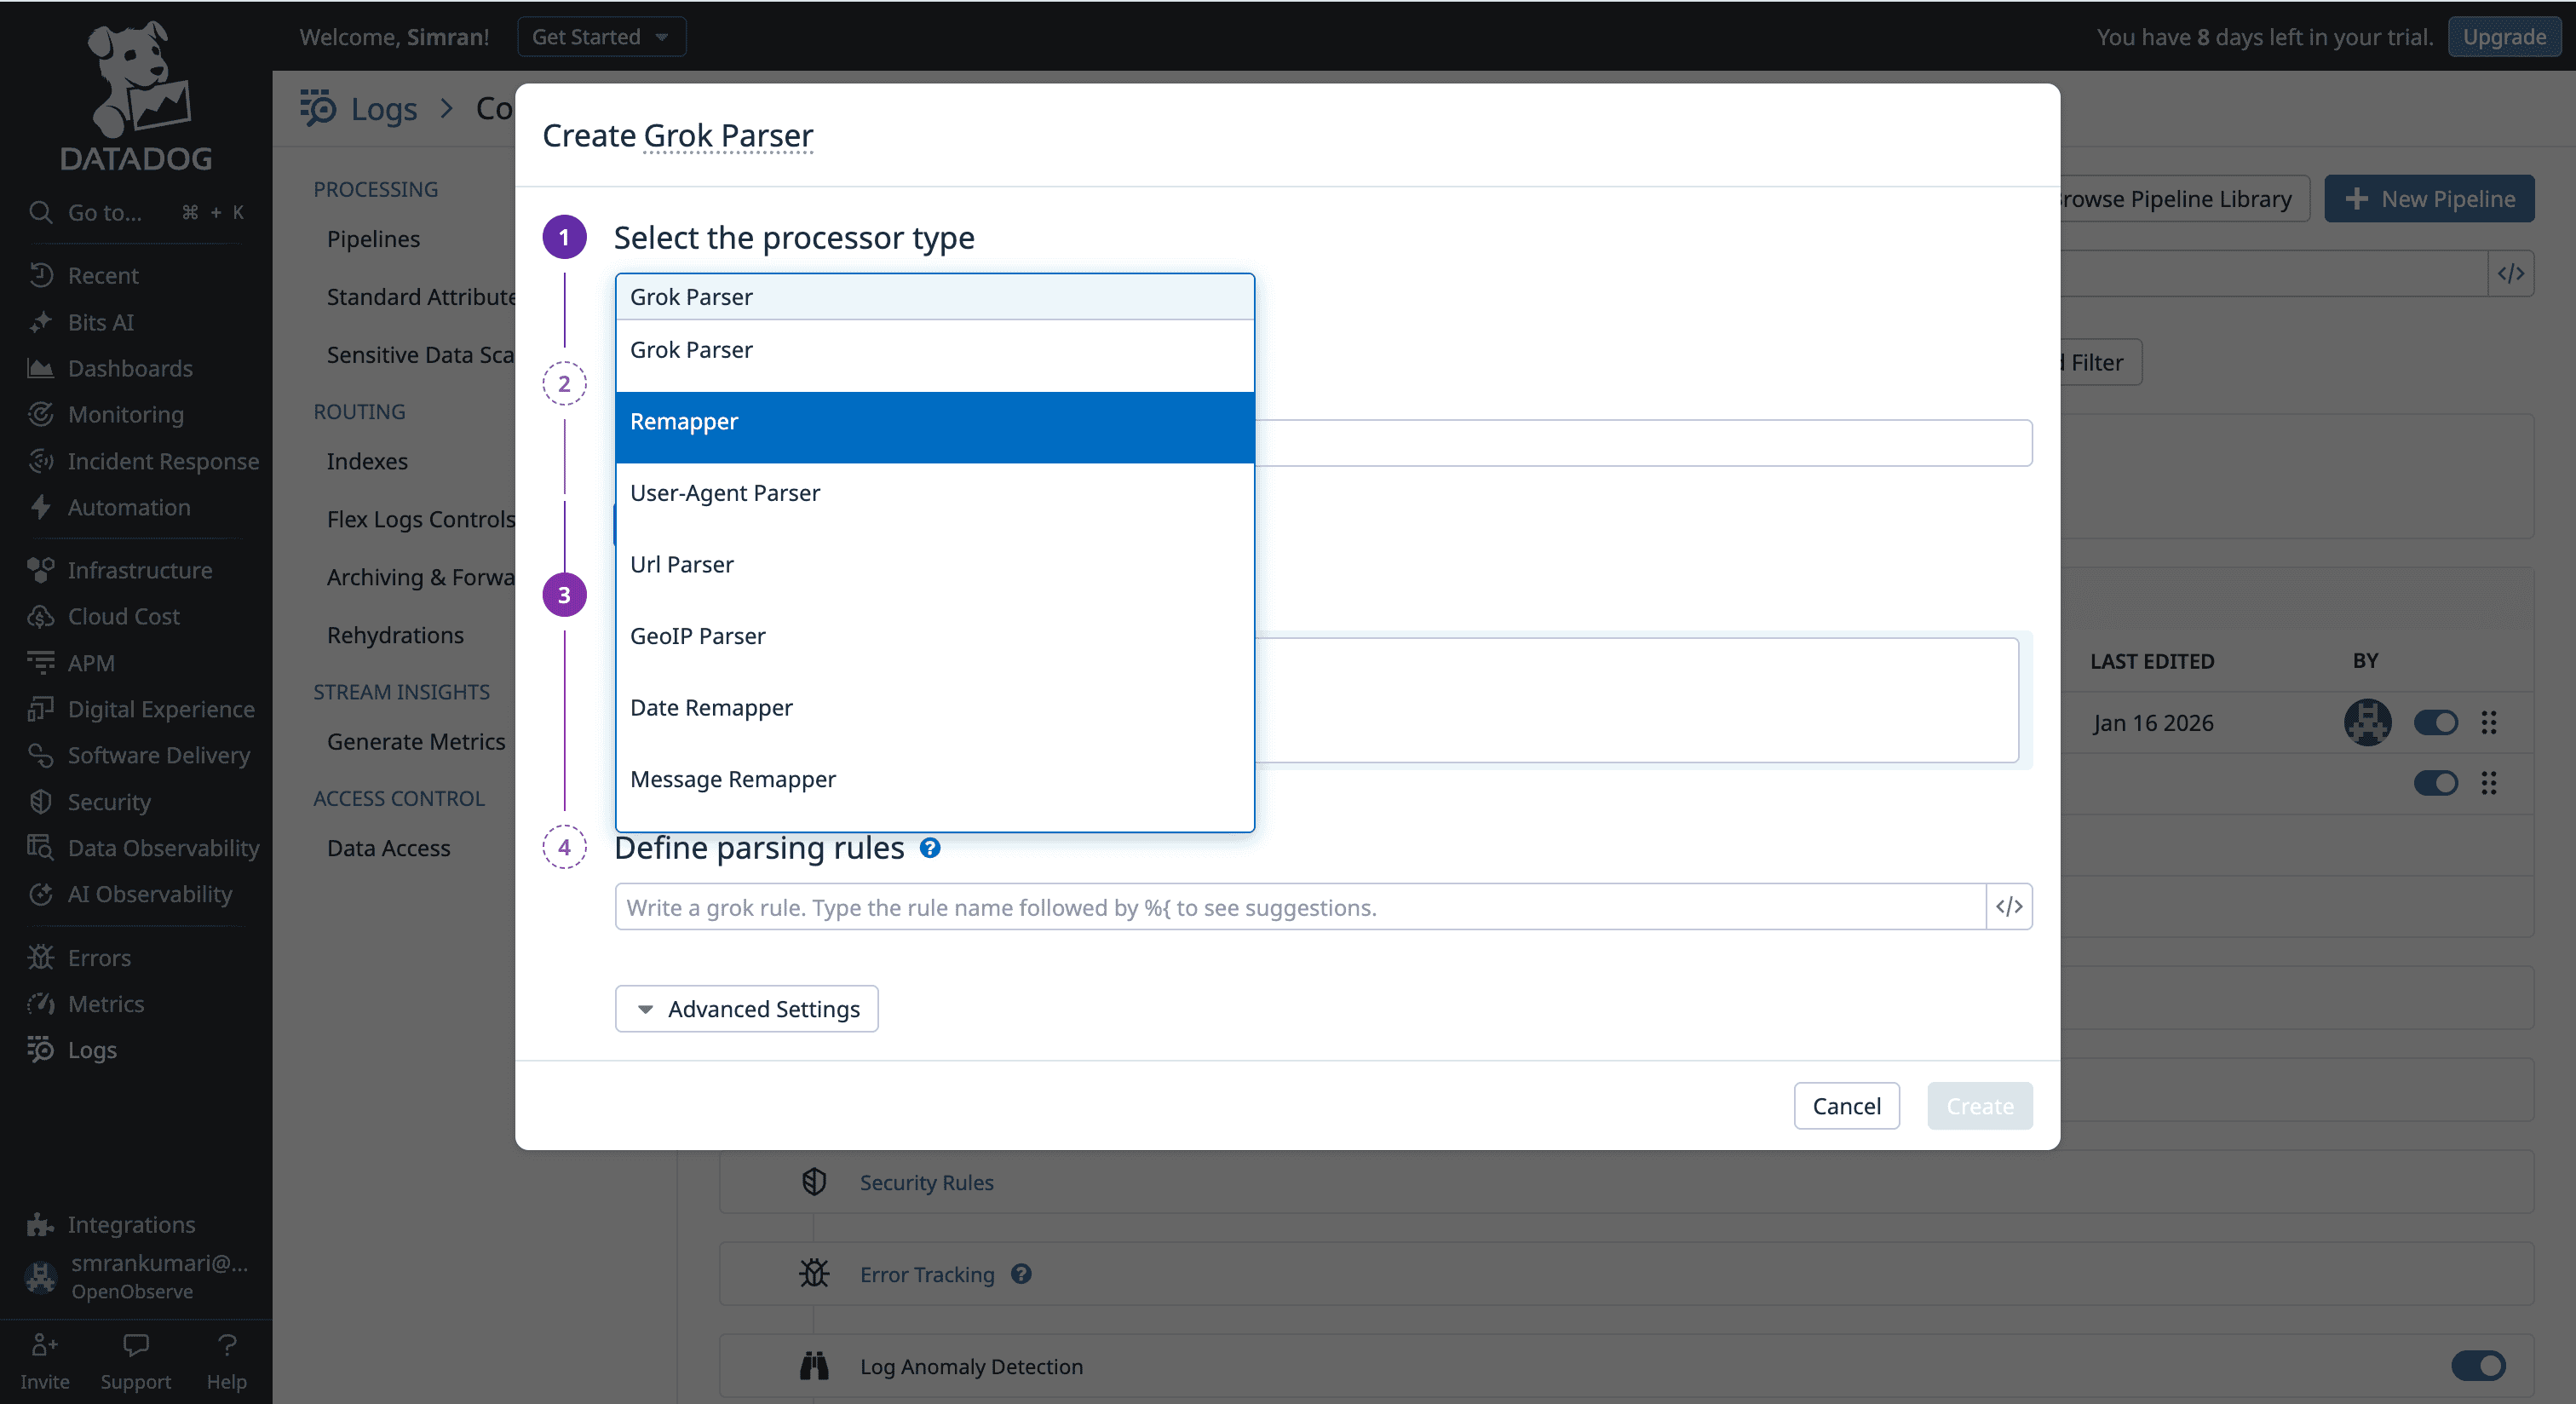
The VRL Silo: While Datadog owns the Vector project (which created VRL), VRL is primarily used in the Observability Pipelines Worker. This means if you write a sophisticated VRL script to scrub PII at the edge, you cannot simply copy-paste that logic into a Datadog "Standard Pipeline" in the SaaS UI; you are stuck with Grok and UI remappers there.
Metric/APM Disconnect: Metrics and Traces are largely "black boxes" in terms of transformation. You can sample them or filter them via tags, but you cannot easily "rewrite" a metric name or calculate a new field from a span attribute using a script during ingestion.
OpenObserve treats VRL as the universal "CPU" for its data processing layer.
Processing observability data requires a balance between immediate action and long-term analysis. Datadog focuses on real-time stream processing, while OpenObserve provides a unified engine for both real-time streams and scheduled batch jobs.
Datadog is architected for immediate ingestion. Its pipeline logic triggers only at the moment data hits the platform.
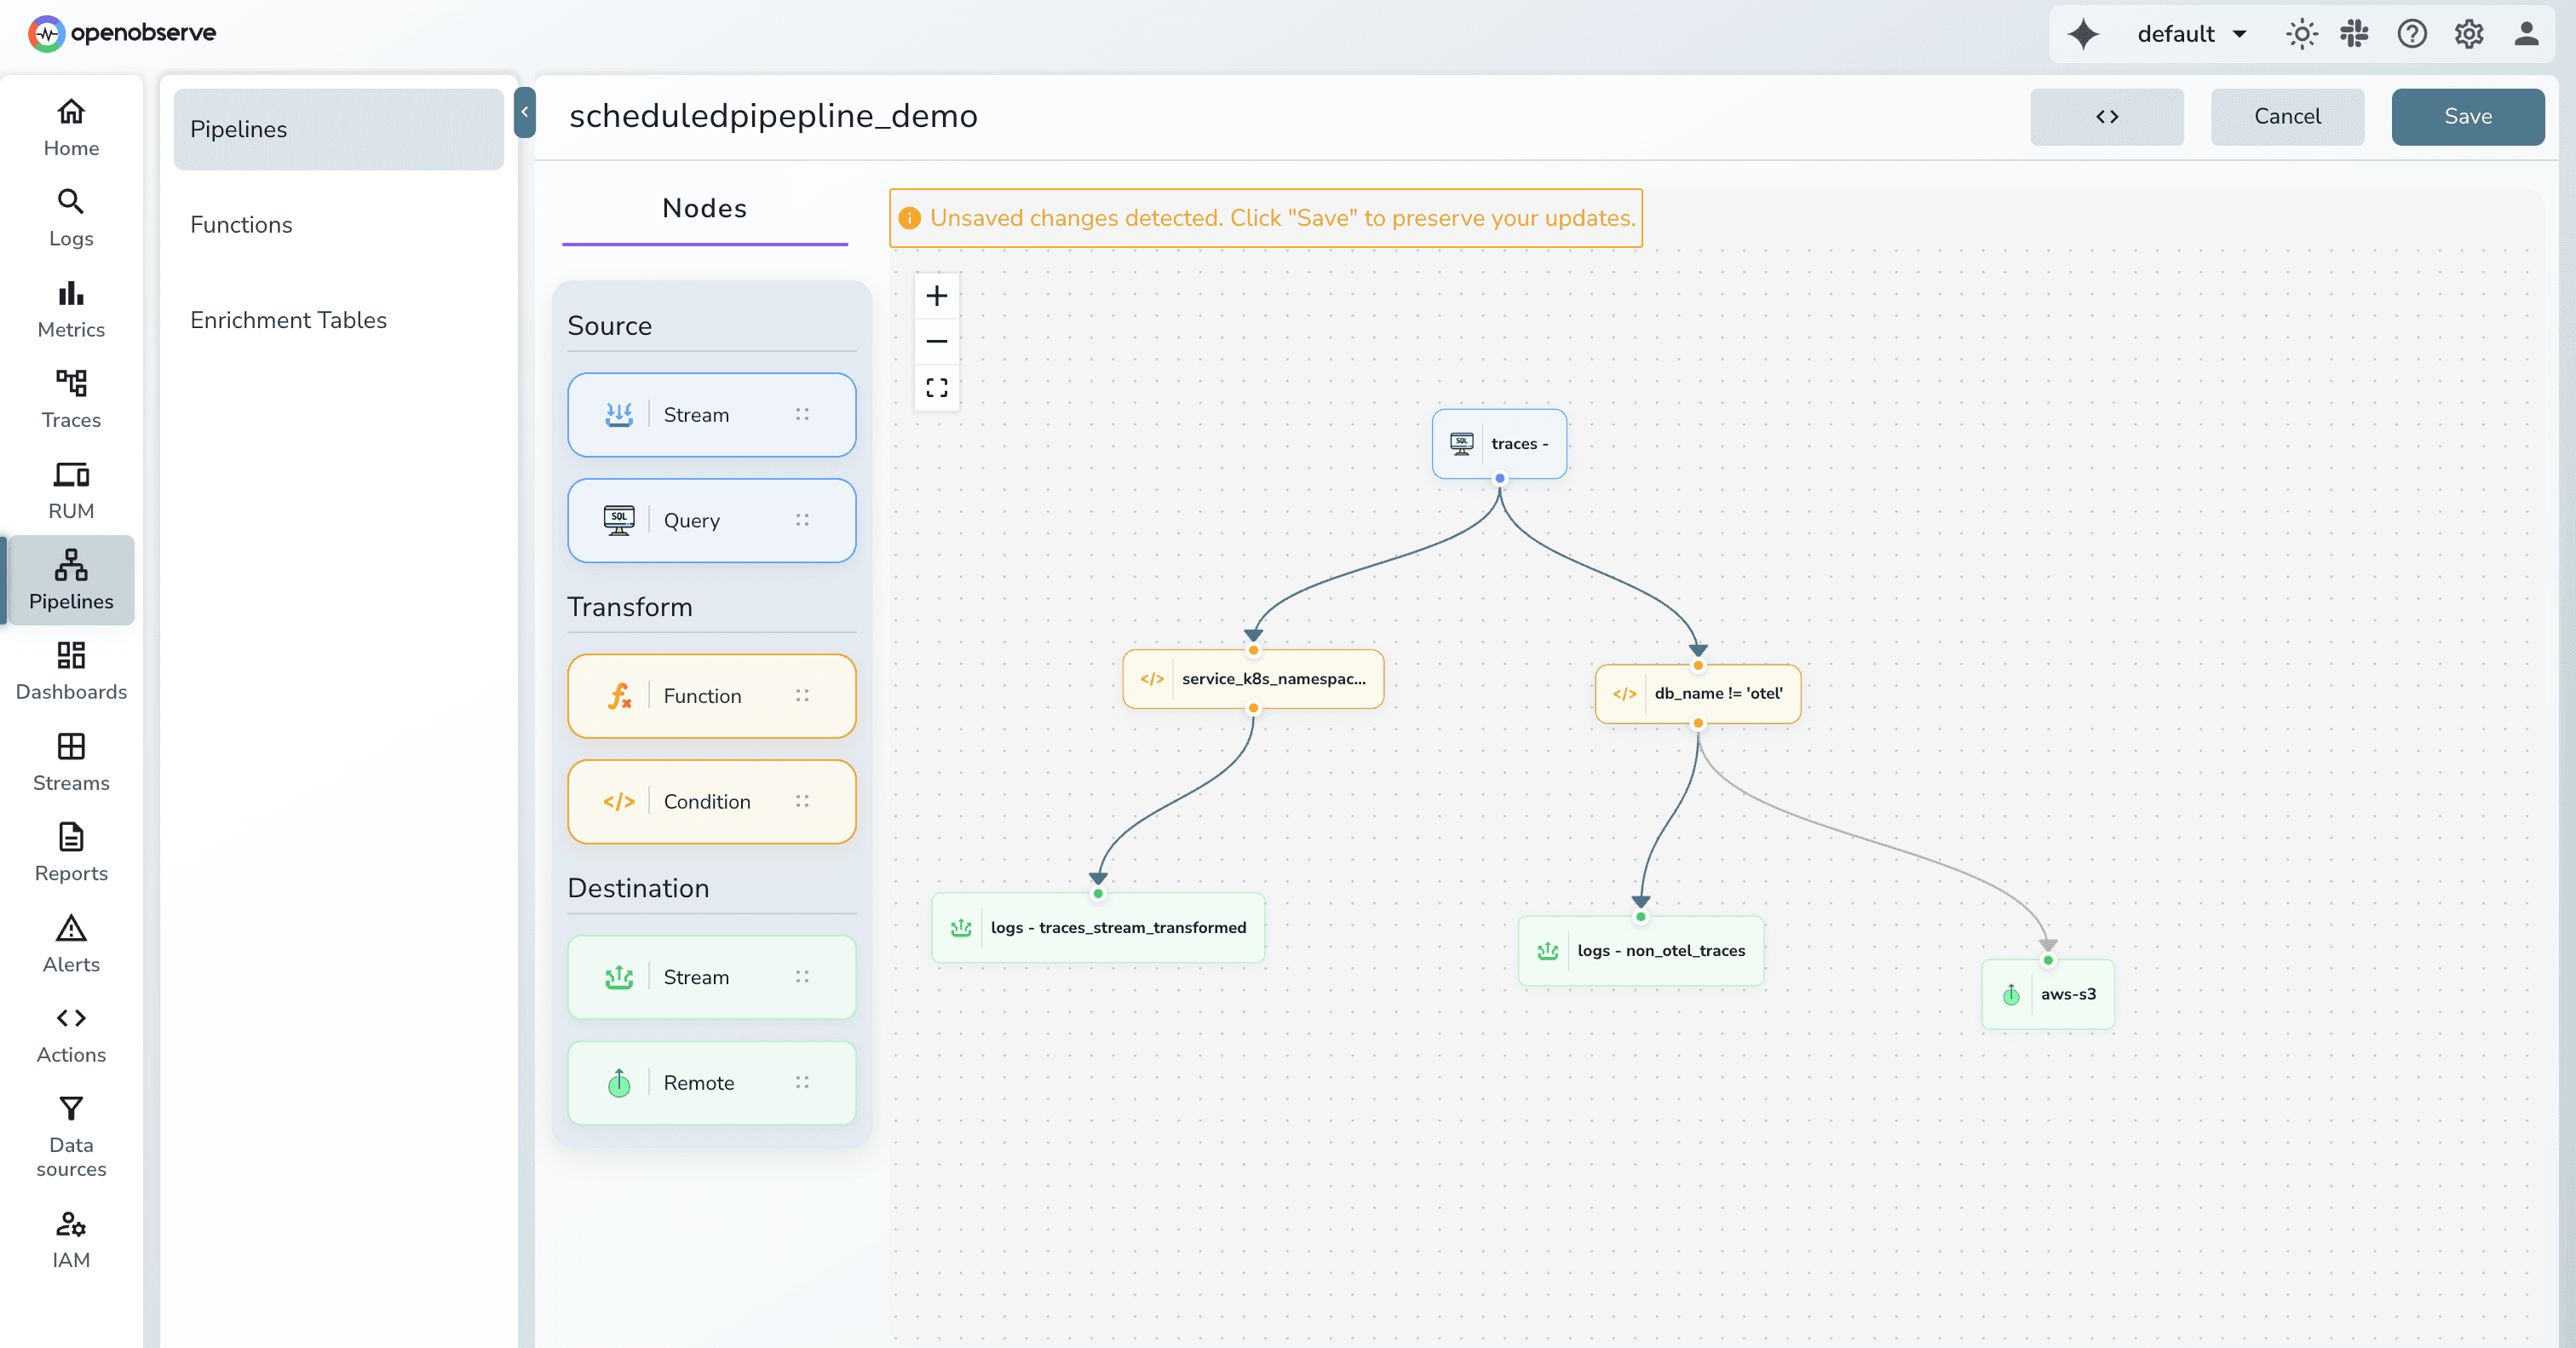
OpenObserve treats "Real-Time" and "Scheduled" as two modes of the same system, determined by the "Source" node on your canvas.
Modern observability often requires "dual shipping" sending data to a real-time engine for troubleshooting while simultaneously archiving it in low-cost storage for compliance.
In Datadog, routing data to multiple destinations is not a native feature of the primary SaaS platform. It requires a significant architectural and cost addition.
OpenObserve treats routing as a core, built-in feature of its visual pipeline canvas, removing the need for external components.
| Area | Datadog | OpenObserve |
|---|---|---|
| Architecture | Split across multiple products and workers | Single built-in pipeline system |
| Processing Language | Grok/UI + VRL only in external workers | VRL everywhere (logs, metrics, traces) |
| Execution Model | Real-time, ingestion-only | Real-time + scheduled batch pipelines |
| Historical Reprocessing | Not supported natively | Native support |
| Multi-Destination Routing | Requires external worker infrastructure | Native visual fan-out routing |
| Operational Overhead | Extra infra, configs, higher cost | No extra deployment, unified UI |
Datadog offers powerful pipeline capabilities, but they are distributed across multiple products, rely on separate worker infrastructure for advanced use cases, and introduce cost and operational friction when teams want to filter, enrich, route, or dual-ship data at scale. If you are already invested in Datadog and comfortable running additional workers—and pipeline processing cost is not a concern—the model works.
But if you’re evaluating observability platforms or open-source Datadog alternatives for data pipelines, OpenObserve delivers a fundamentally simpler and more flexible approach:
For platform engineers managing OpenTelemetry-instrumented microservices, these differences are decisive. No hesitation before filtering noisy logs. No duplication of logic across pipelines. No separate infrastructure just to route data or apply conditional enrichment. One mental model, one UI, one processing engine.
Sign up for a free cloud trial or schedule a demo to test OpenObserve's IAM features with your team.
Passionate about observability, AI systems, and cloud-native tools. All in on DevOps and improving the developer experience.


