Getting Started with OpenObserve
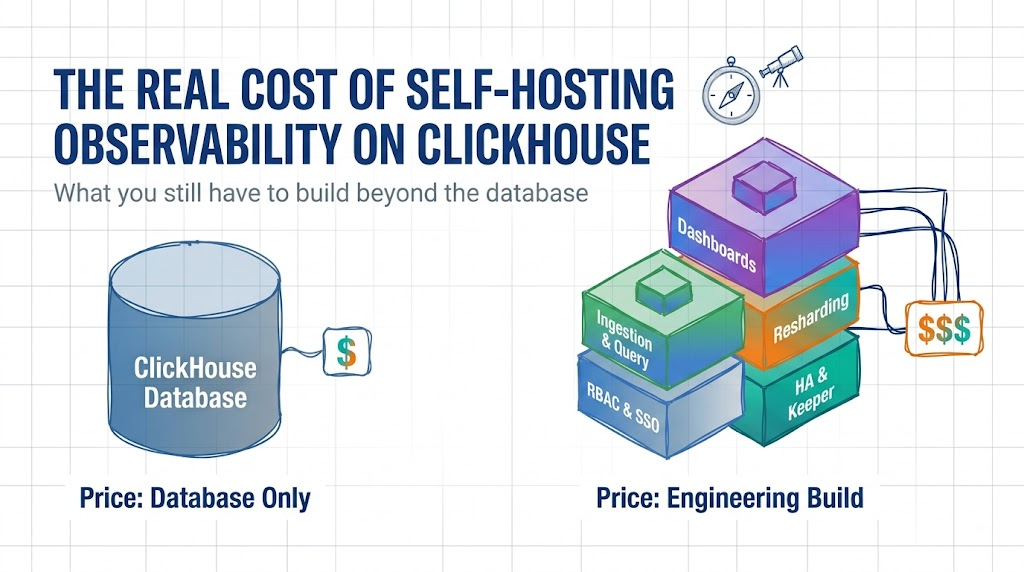
ClickHouse's storage economics are genuinely excellent. Self-hosting a production observability platform on top of it isn't free, it's an engineering build. Here's what that build actually costs.
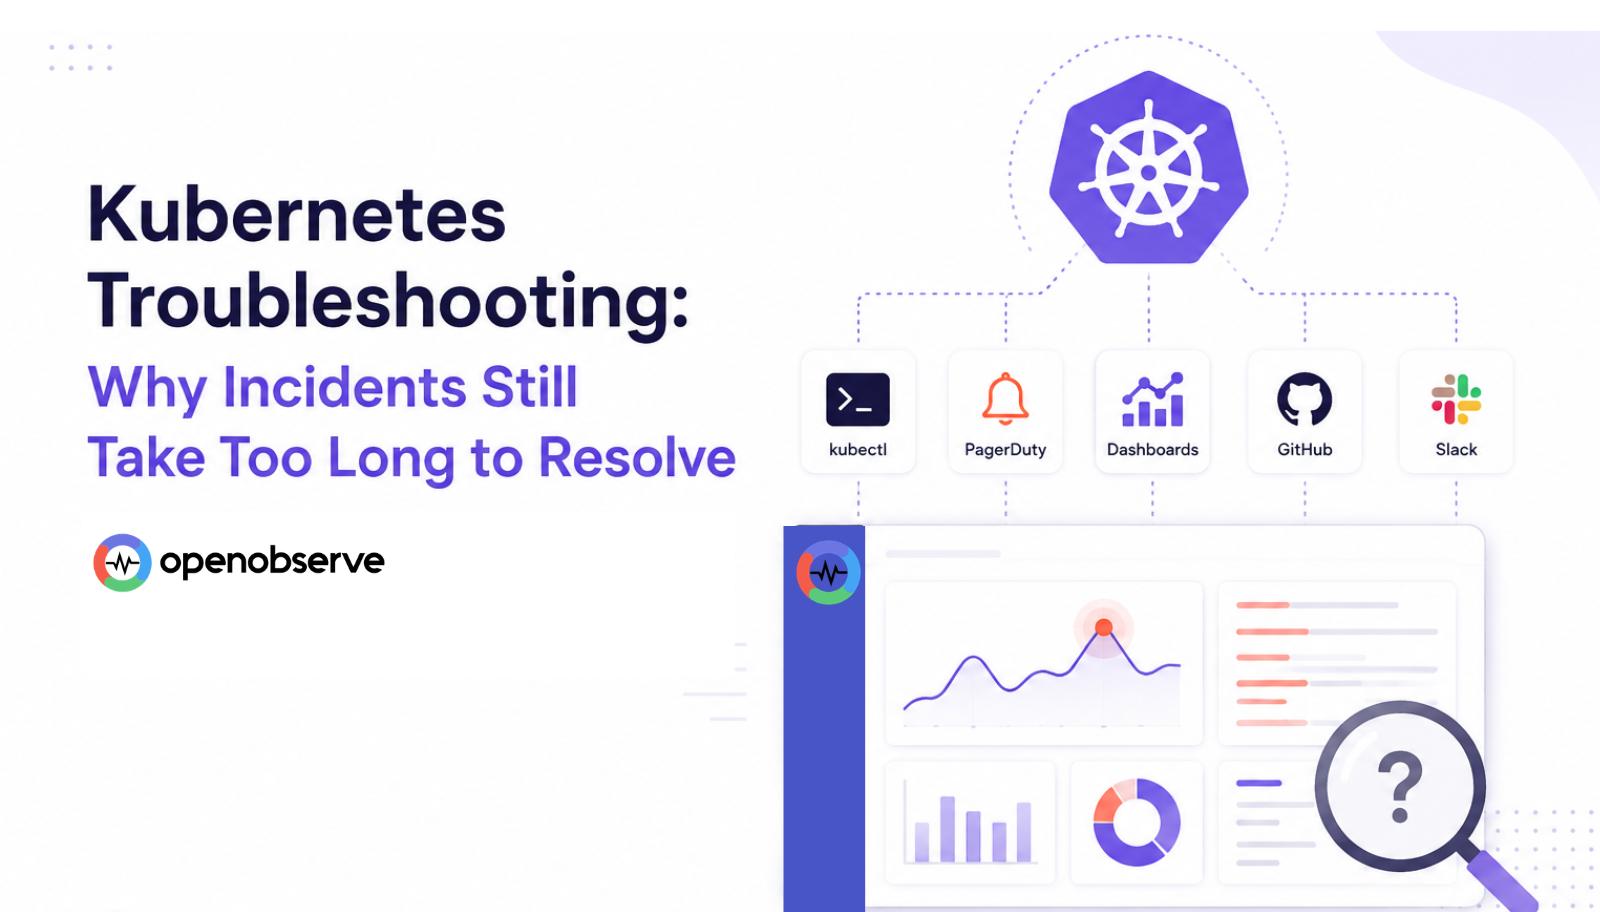
Learn why Kubernetes incidents take too long to resolve and how to reduce MTTR through temporal and dimensional correlation of logs, metrics, traces, and Kubernetes Events.
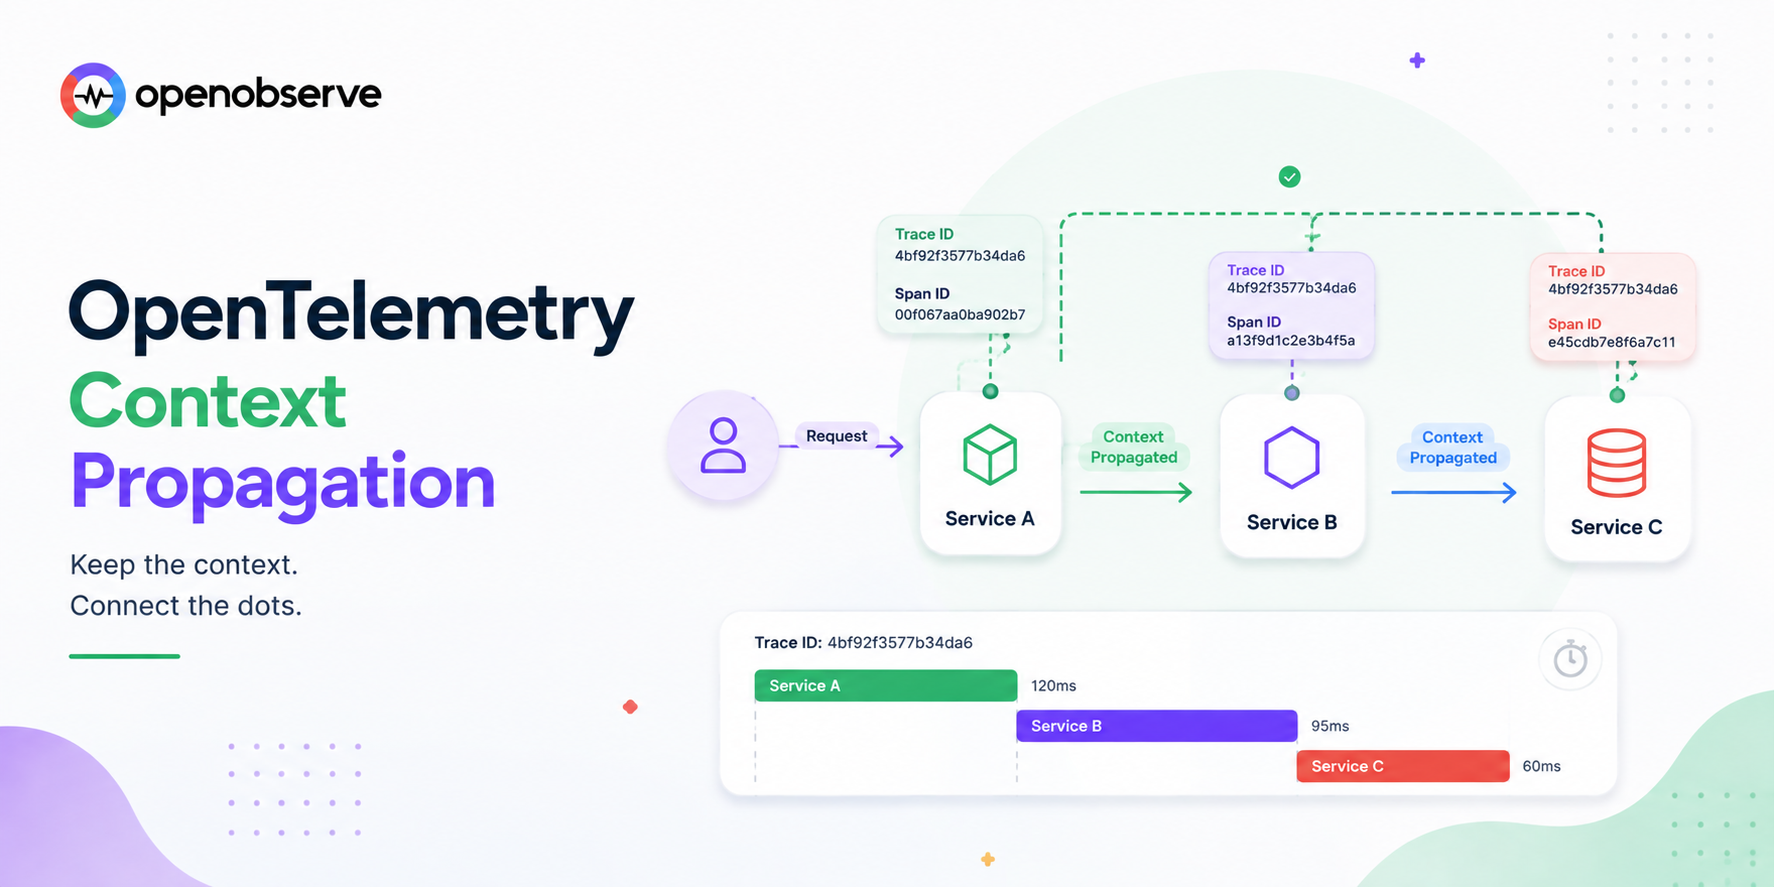
A practical deep-dive into OpenTelemetry context propagation: the W3C Trace Context spec, traceparent and tracestate header anatomy, baggage, propagators, and why distributed traces break across services.
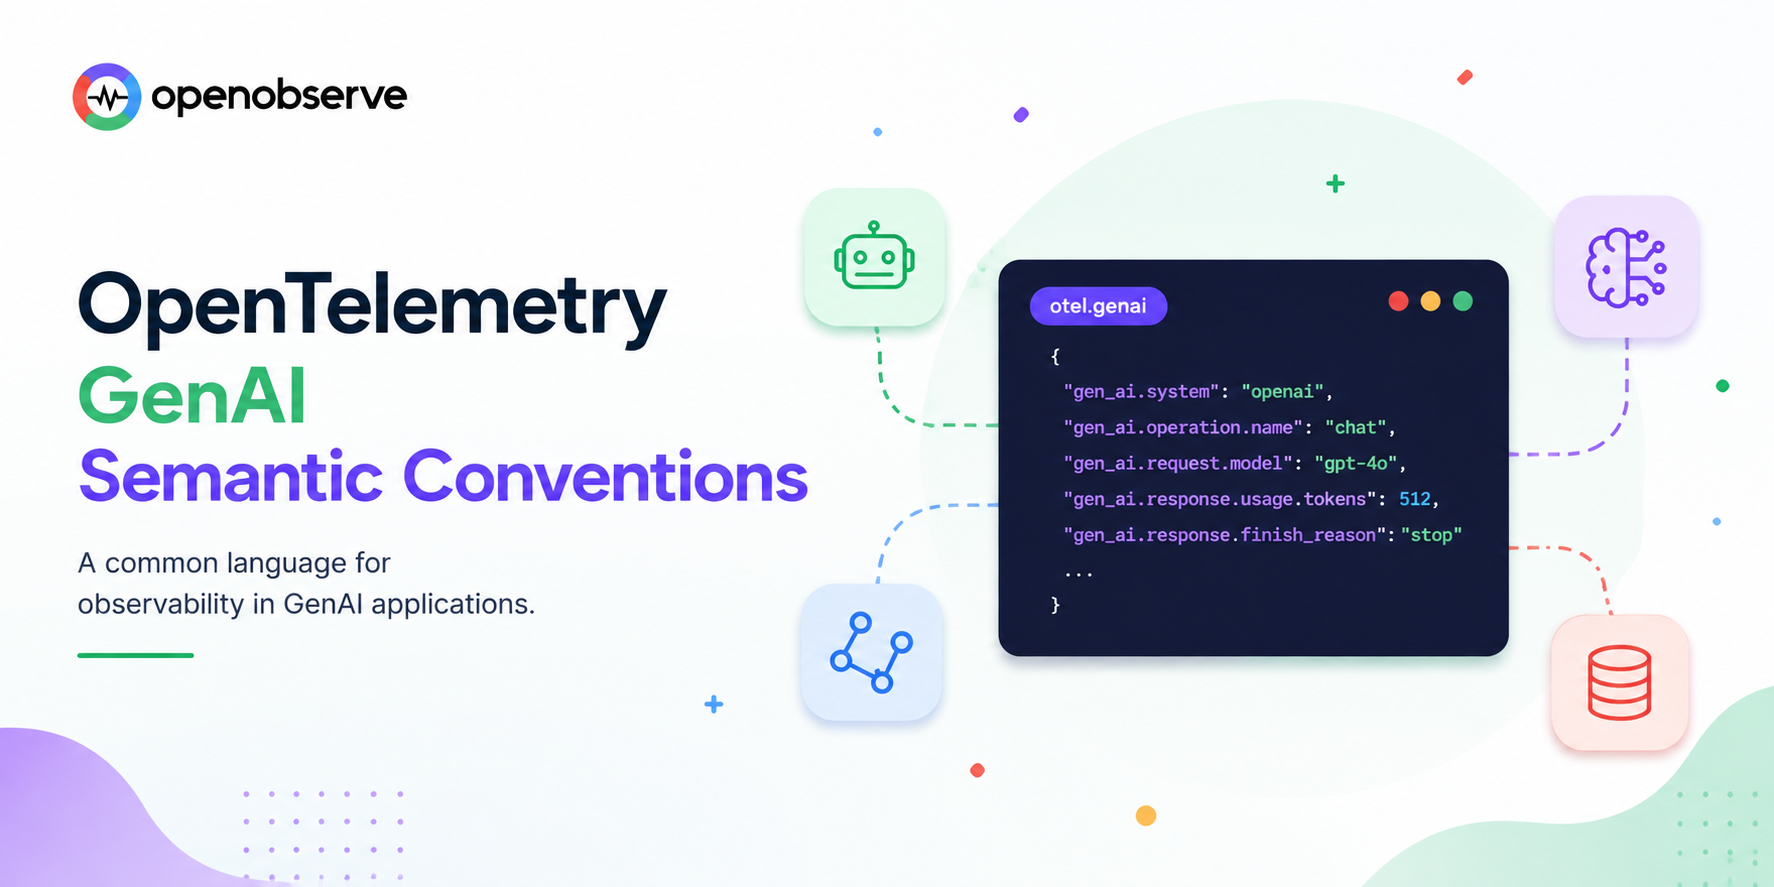
A practical, attribute-by-attribute guide to OpenTelemetry's GenAI semantic conventions: the gen_ai.* namespace for spans, metrics, and events, stability levels, a worked instrumentation example, and common migration mistakes.
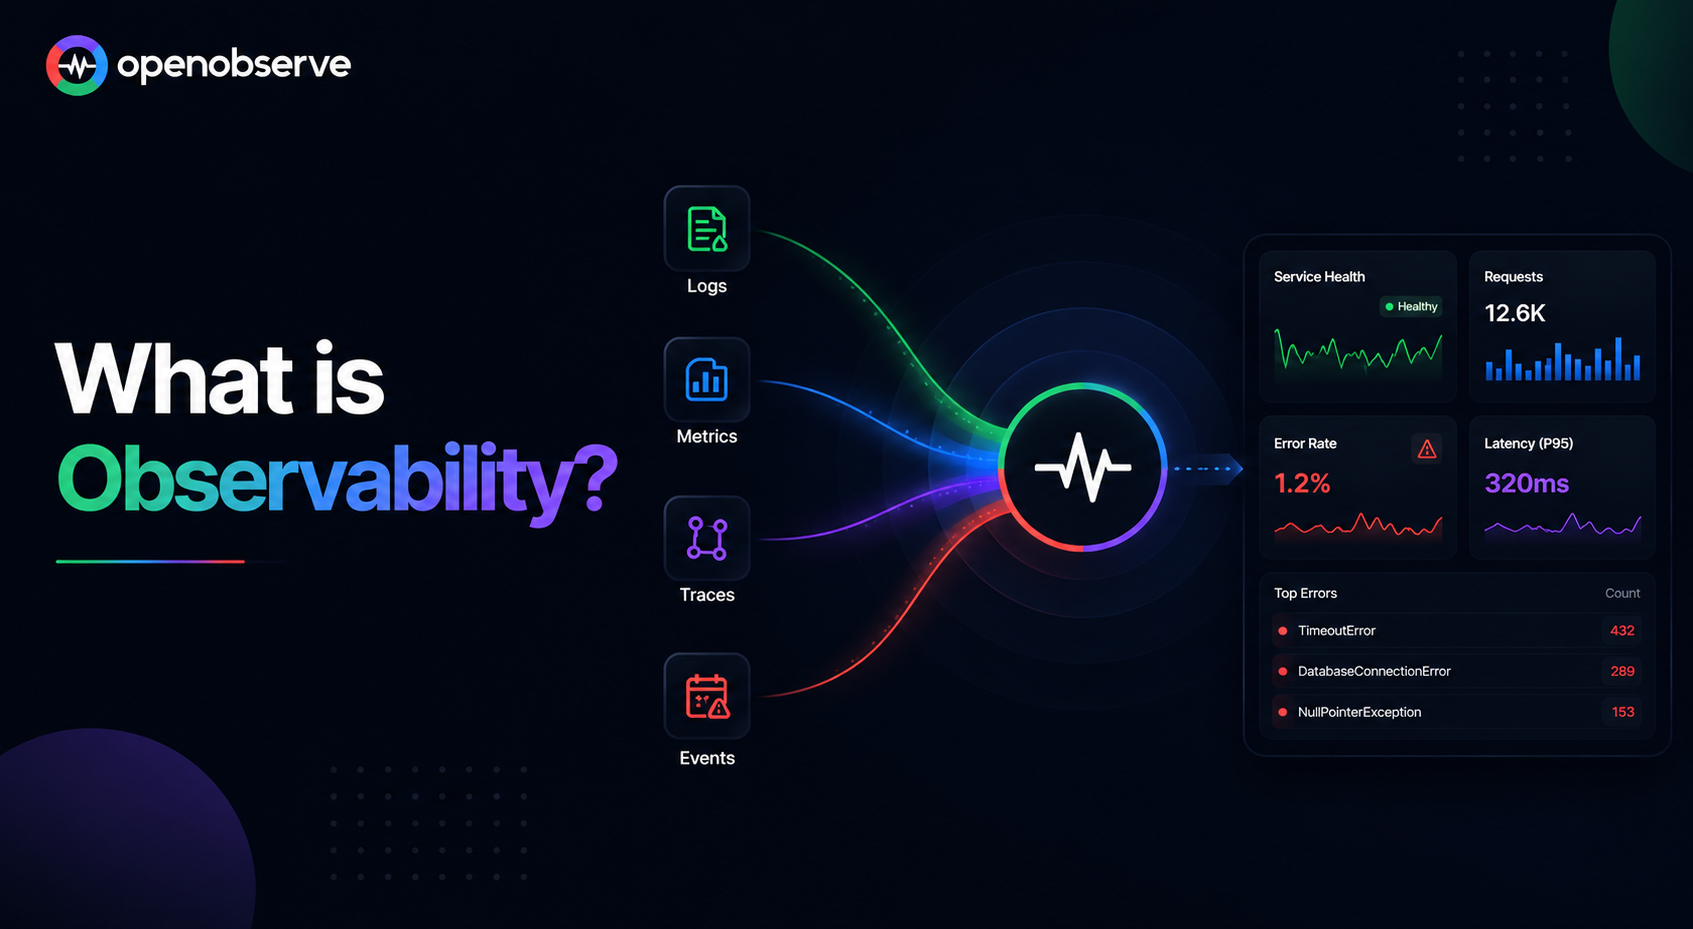
What is observability, and how is it different from monitoring? A complete guide covering the three pillars (logs, metrics, traces), the properties that make a system observable, maturity stages, and how to get started.
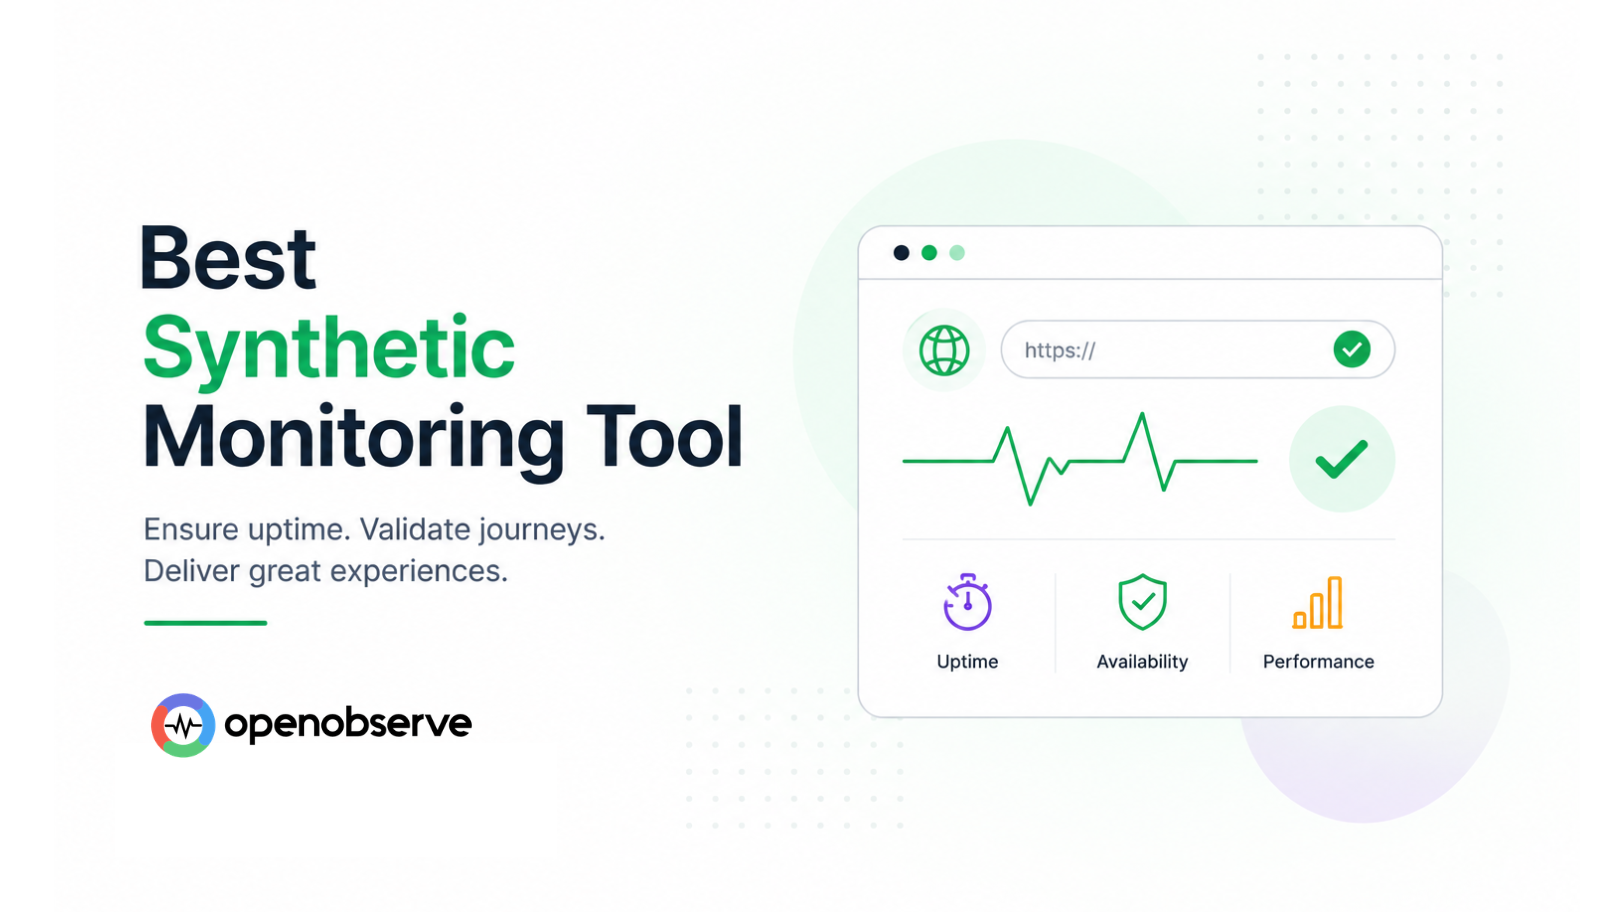
A complete comparison of the best synthetic monitoring tools in 2026: HTTP, TCP, TLS, SSH, and browser checks, private location support, alerting, and pricing, for engineering, SRE, and platform teams.
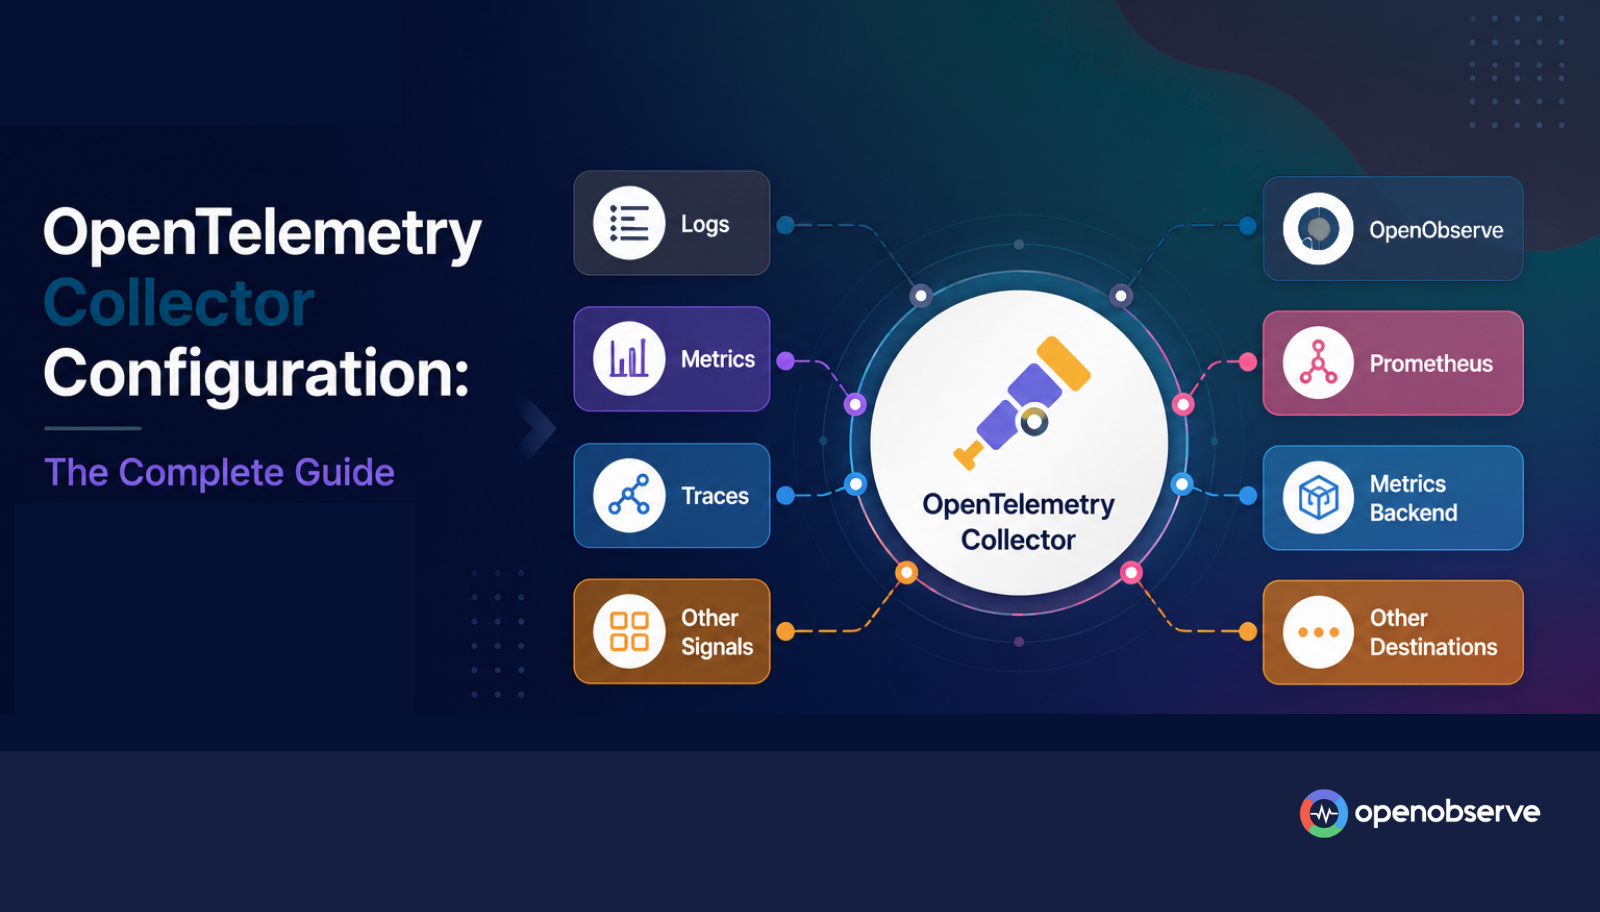
A complete, practical guide to OpenTelemetry Collector configuration: YAML file structure, receivers, processors, exporters, pipelines, environment variables, validation, and common mistakes.
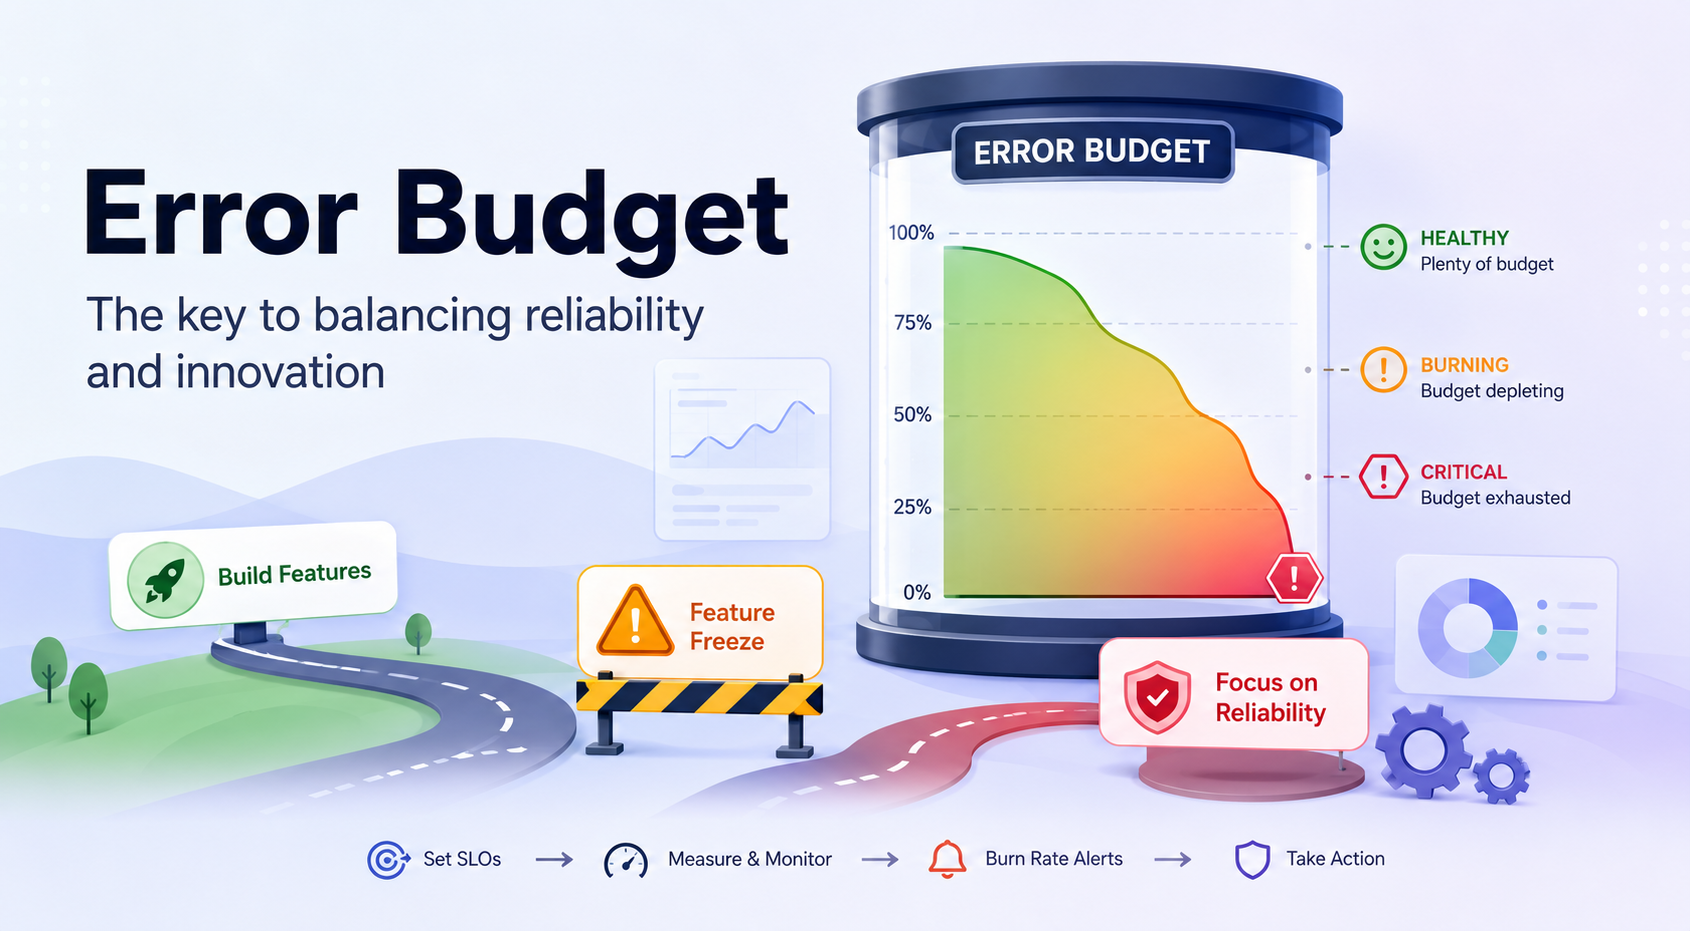
Error budgets explained: how they work, how to write an error budget policy, and what actually happens when the budget runs out.
A comprehensive comparison of the top 10 open source APM tools in 2026: OpenObserve, Uptrace, Jaeger, Grafana Tempo, and Zipkin. Covers unified observability, OpenTelemetry support, storage efficiency, and self-hosted deployment options.
Compare the top 10 APM tools in 2026 — features, pricing, and use cases. OpenObserve delivers 60-90% cost savings with unified observability for logs, metrics, traces, and APM.
Best log monitoring and management tools for 2026, open source and commercial - plus when you need a SIEM and when log management is enough.
Compare the top 10 open source observability tools in 2026: OpenObserve, Prometheus, Grafana, Jaeger, and Loki. Covers logs, metrics, traces, deployment options, and cost trade-offs.
Compare the top 10 Datadog competitors and alternatives in 2026: OpenObserve, Grafana, New Relic, Dynatrace, and Splunk. Pricing breakdowns, feature tables, and migration guidance for DevOps and SRE teams.
Struggling with alert fatigue? Learn how to reduce noisy alerts, improve signal quality, and build effective alerting strategies that actually help teams respond faster.
Learn the difference between head-based and tail-based sampling in observability. Compare pros, cons, and use cases to choose the right strategy for tracing.
Compare the best Prometheus alternatives in 2026 for metrics at scale. See how OpenObserve, VictoriaMetrics, Thanos, Mimir, Cortex, and more handle high cardinality, long-term storage, and cost.
Compare the best log visualization tools in 2026: OpenObserve, Kibana, Grafana Loki, Datadog, and Splunk. Covers AI-assisted analysis, dashboard quality, and cost.
A practical guide to the best distributed tracing tools in 2026: OpenObserve, Jaeger, Grafana Tempo, Zipkin, and Honeycomb. Covers OTel compatibility, high-cardinality support, and deployment trade-offs.
Discover the best Elasticsearch alternatives in 2026. Compare OpenObserve, OpenSearch, ClickHouse, Grafana Loki, and Solr on cost, search performance, and deployment options.
A practical comparison of the top log management tools in 2026: OpenObserve, Splunk, Datadog, Grafana Loki, and Elastic. Covers collection, indexing, retention, and cost for modern DevOps and SRE teams.
A practical guide to the top 10 microservices monitoring tools in 2026: OpenObserve, Grafana LGTM, Datadog, Dynatrace, and Prometheus. Covers unified telemetry, cardinality handling, and cost trade-offs.