How to capture AWS VPC Flow Logs and analyze them

Prabhat Sharma
March 18, 2024
6 min read
Don’t forget to share!
Try OpenObserve Cloud today for more efficient and performant observability.
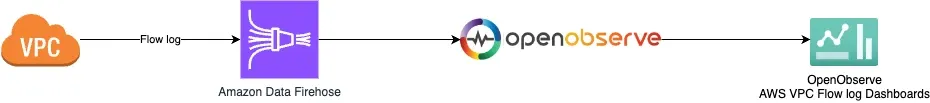
Amazon Web Services (AWS) provides a wealth of data about the traffic that flows through your Virtual Private Cloud (VPC). By capturing this data, you can gain insights into network patterns, detect anomalies, and improve the security and efficiency of your cloud environment. AWS VPC Flow Logs are a feature that allows you to capture information about the IP traffic going to and from network interfaces in your VPC. In this blog, we will discuss how to capture all fields of AWS VPC Flow Logs, send them to Kinesis Firehose, and then analyze them using OpenObserve's Logs UI and Dashboards.
Architecture of the solution would look like
http://localhost:5080/aws/default/default/_kinesis_firehose. Change localhost to your OpenObserve server's IP address or domain name. an stream name to vpcflowlog . Keep this name of the stream. It will allow you to use the existing dashboard from the OpenObserve dashboard repository.https://openobserve.example.com/aws/default/vpcflowlog/_kinesis_firehoseAccess Key from the same page. You will need to use it in Amazon Data Firehose Delivery Stream.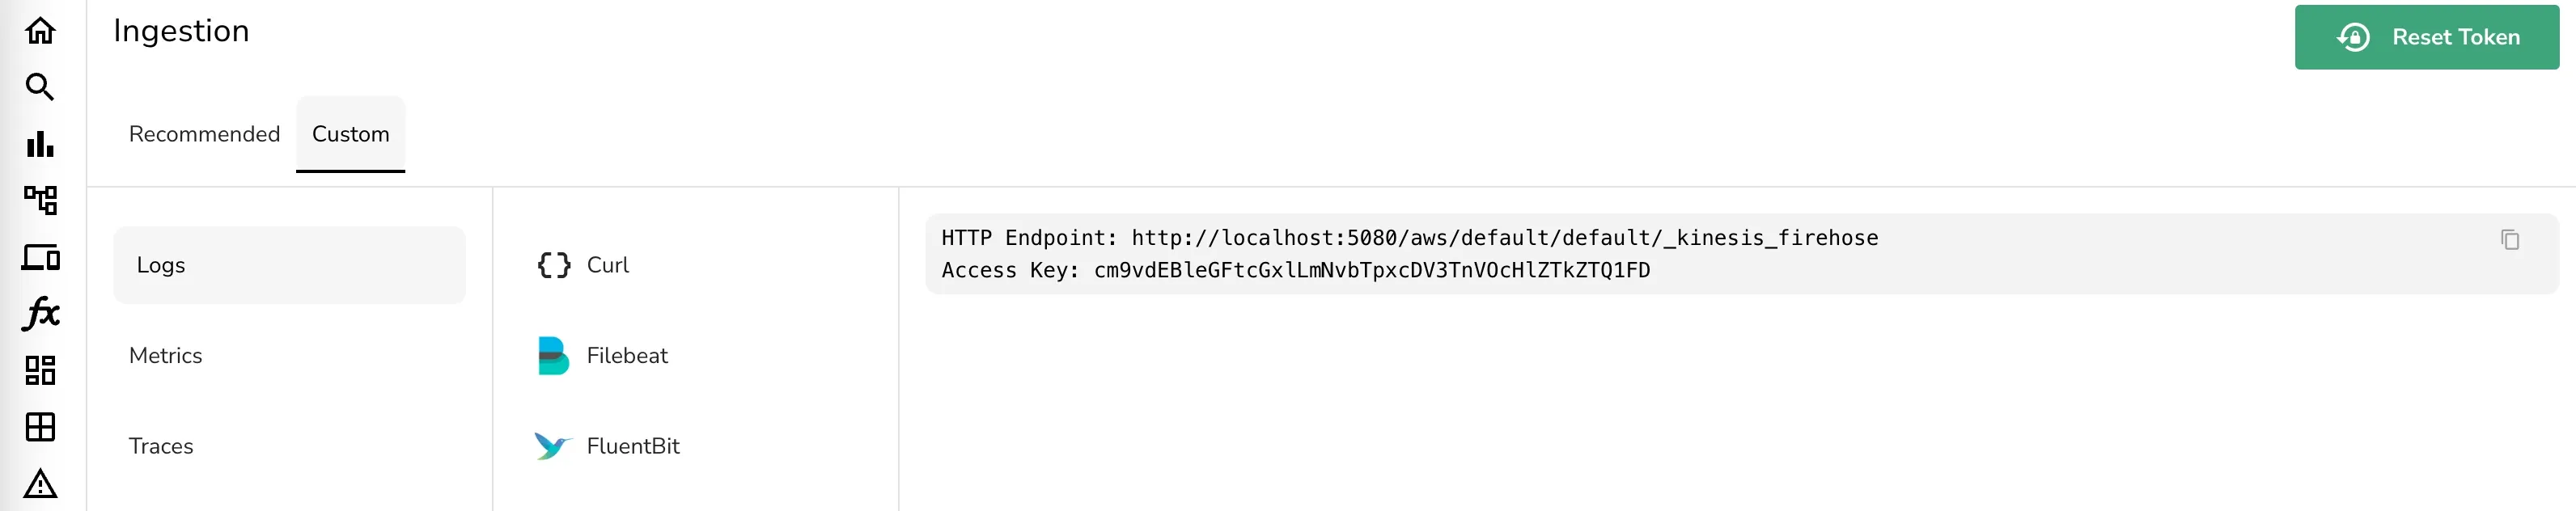
flowlog_openobserveFailed data only.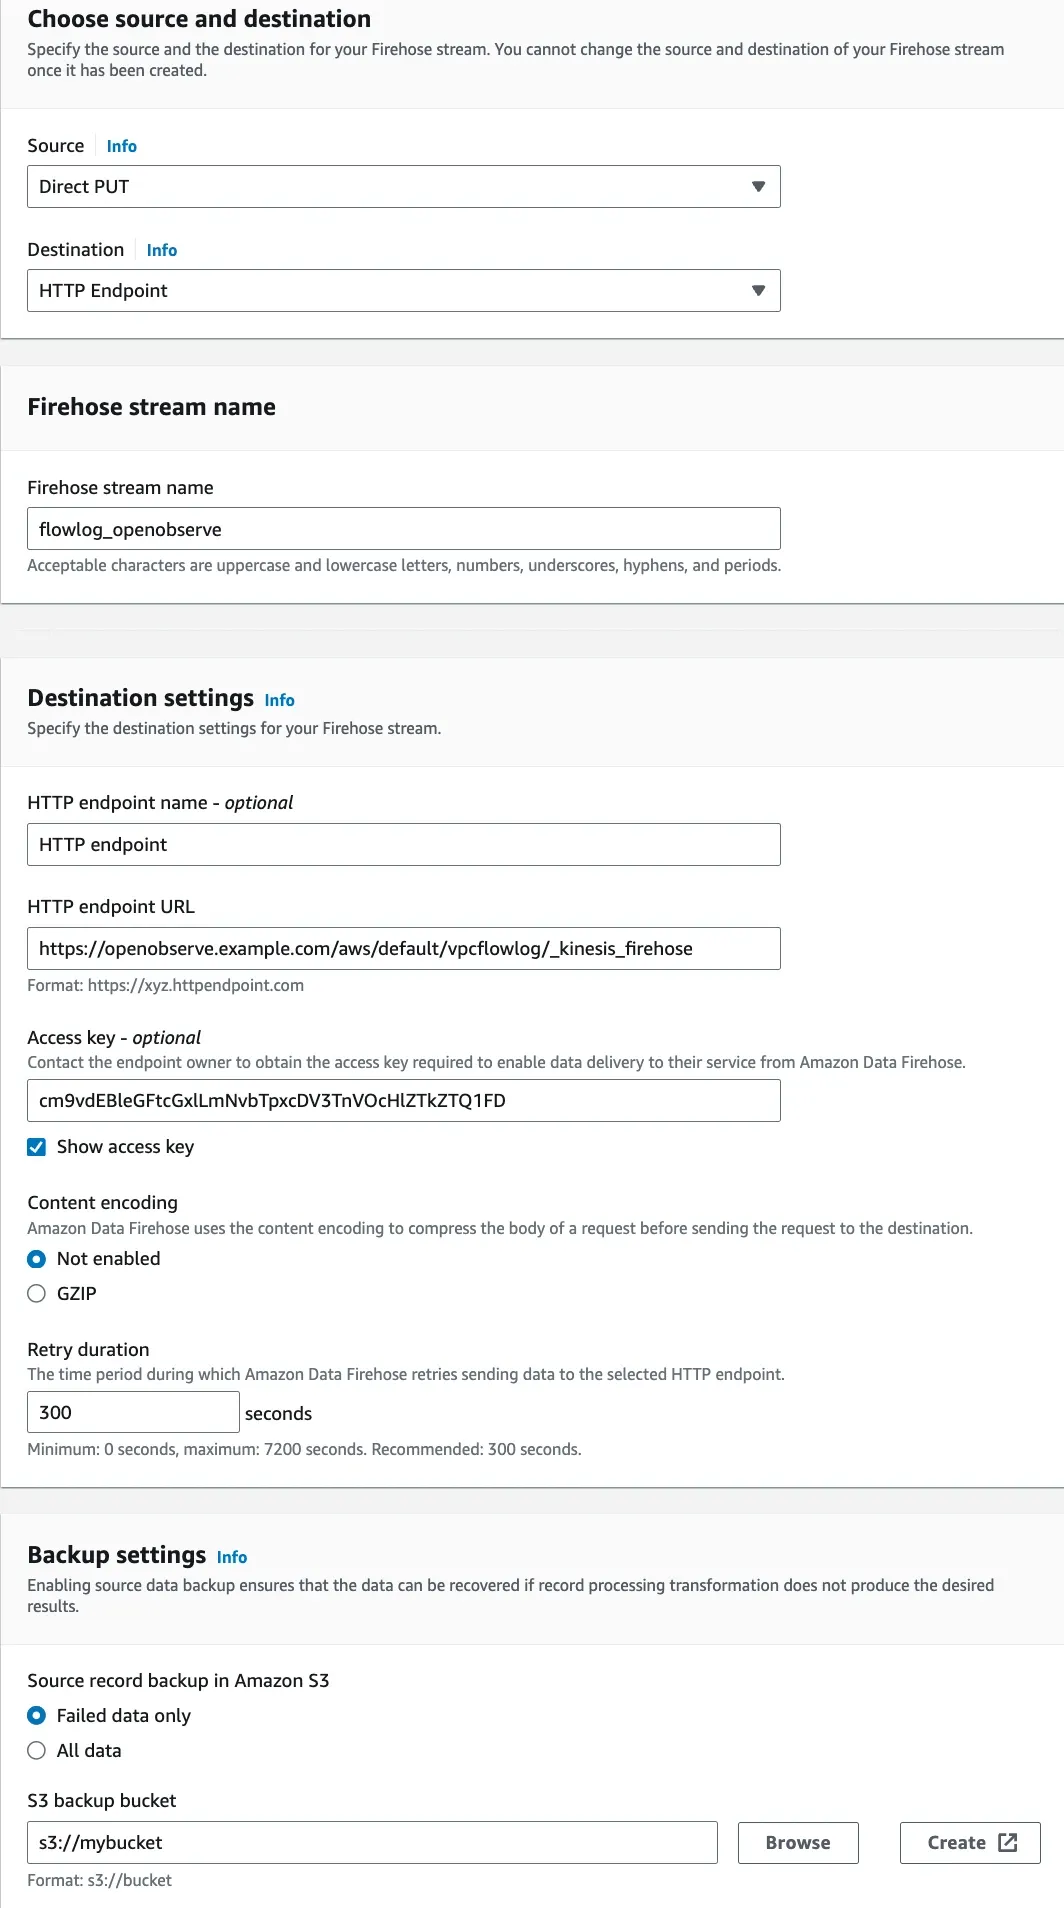
It's time to enable VPC Flow Logs. You can do this for your VPC page in the AWS Management Console:
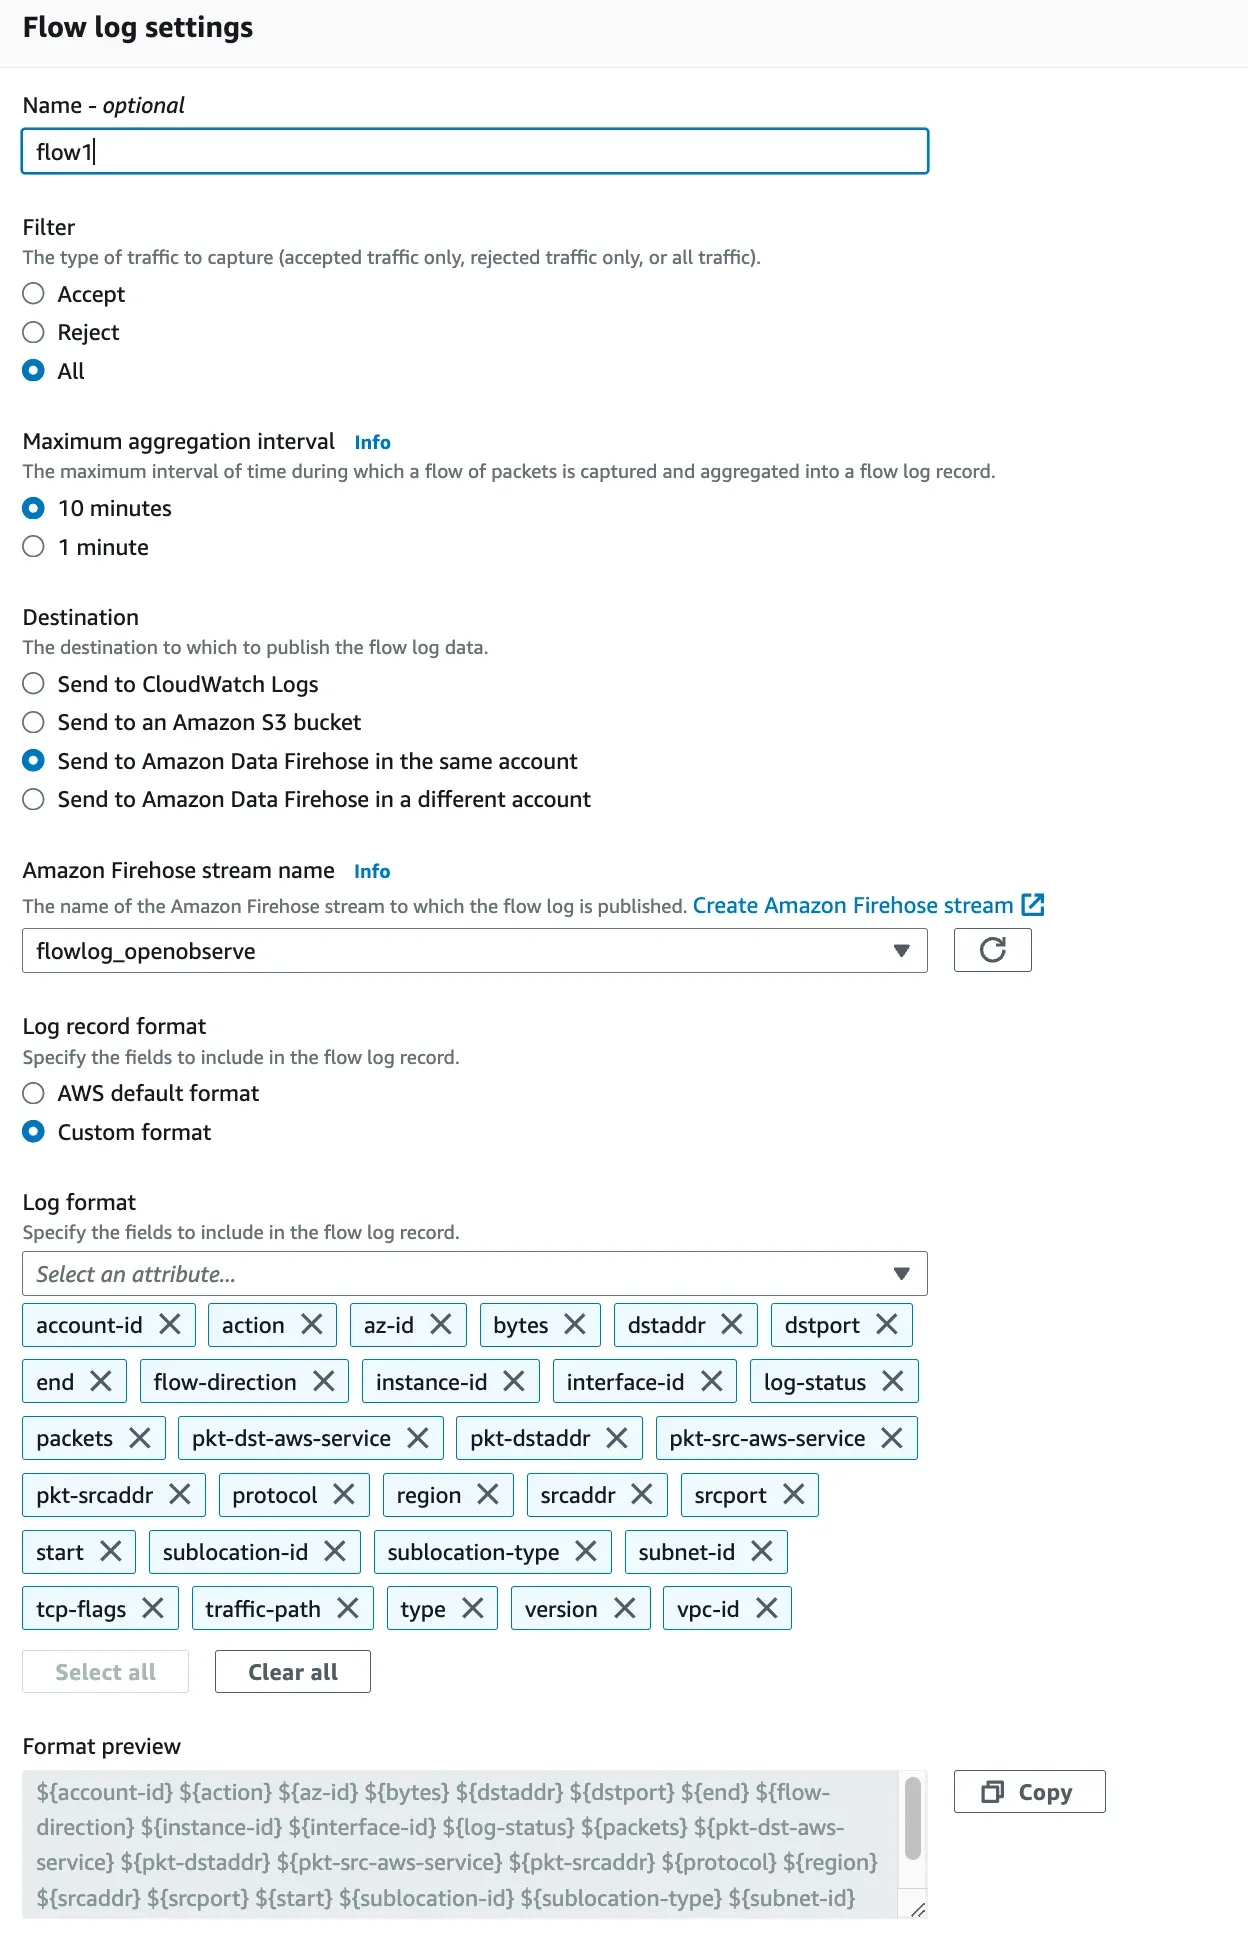
Once this is done VPC flow logs will start to be published to the Amazon Data Firehose which will then start sending the logs to OpenObserve.
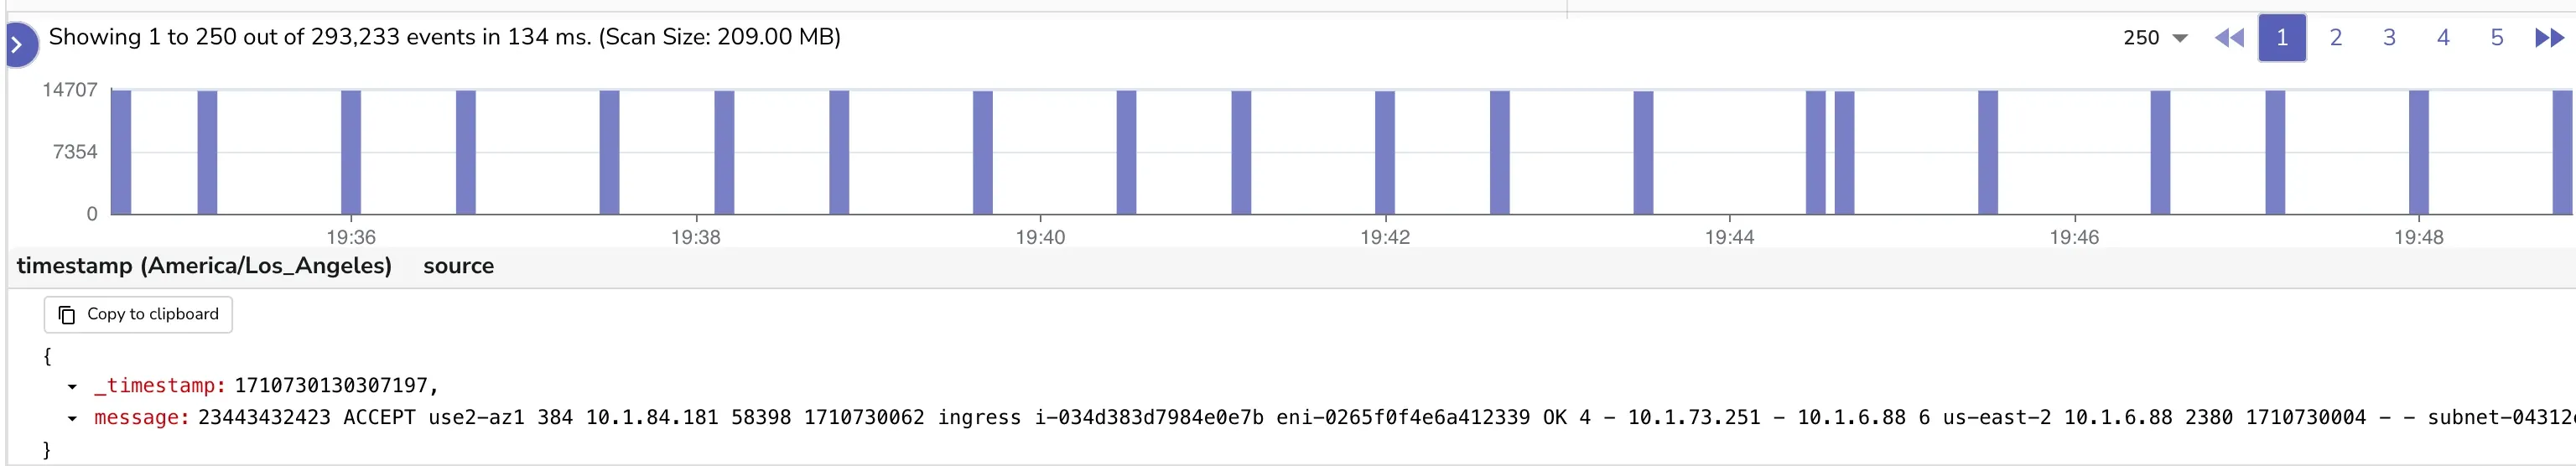
In less than 10 minutes you should start seeing the logs in OpenObserve. Logs will have the below format. This format of logs is not very useful for analysis. We will need to parse and enrich the logs to make them useful that we will do in next steps.
{
   "_timestamp":1710730130307197,
   "message":"068194857476 ACCEPT use2-az1 384 10.1.84.181 58398 1710730062 ingress i-034d383d7984e0e7b eni-0265f0f4e6a412339 OK 4 - 10.1.73.251 - 10.1.6.88 6 us-east-2 10.1.6.88 2380 1710730004 - - subnet-04312ec519e831d36 19 - IPv4 5 vpc-03e33fe1eae7002e8"
}
Below is how it will look in th UI
VPC flow logs data contains protocol number using which the data was transferred. OpenObserve can use a protocol enrichment table to convert protocol numbers to protocol names. You can download the protocol enrichment table from here using the command below:
wget https://zinc-public-data.s3.us-west-2.amazonaws.com/enrichment_tables/protocols.csv
This file contains the table at https://www.iana.org/assignments/protocol-numbers/protocol-numbers.xhtml which contains the IANA protocol number of the traffic.
Give the enrichment table name protocol and upload the csv file to OpenObserve using the UI.
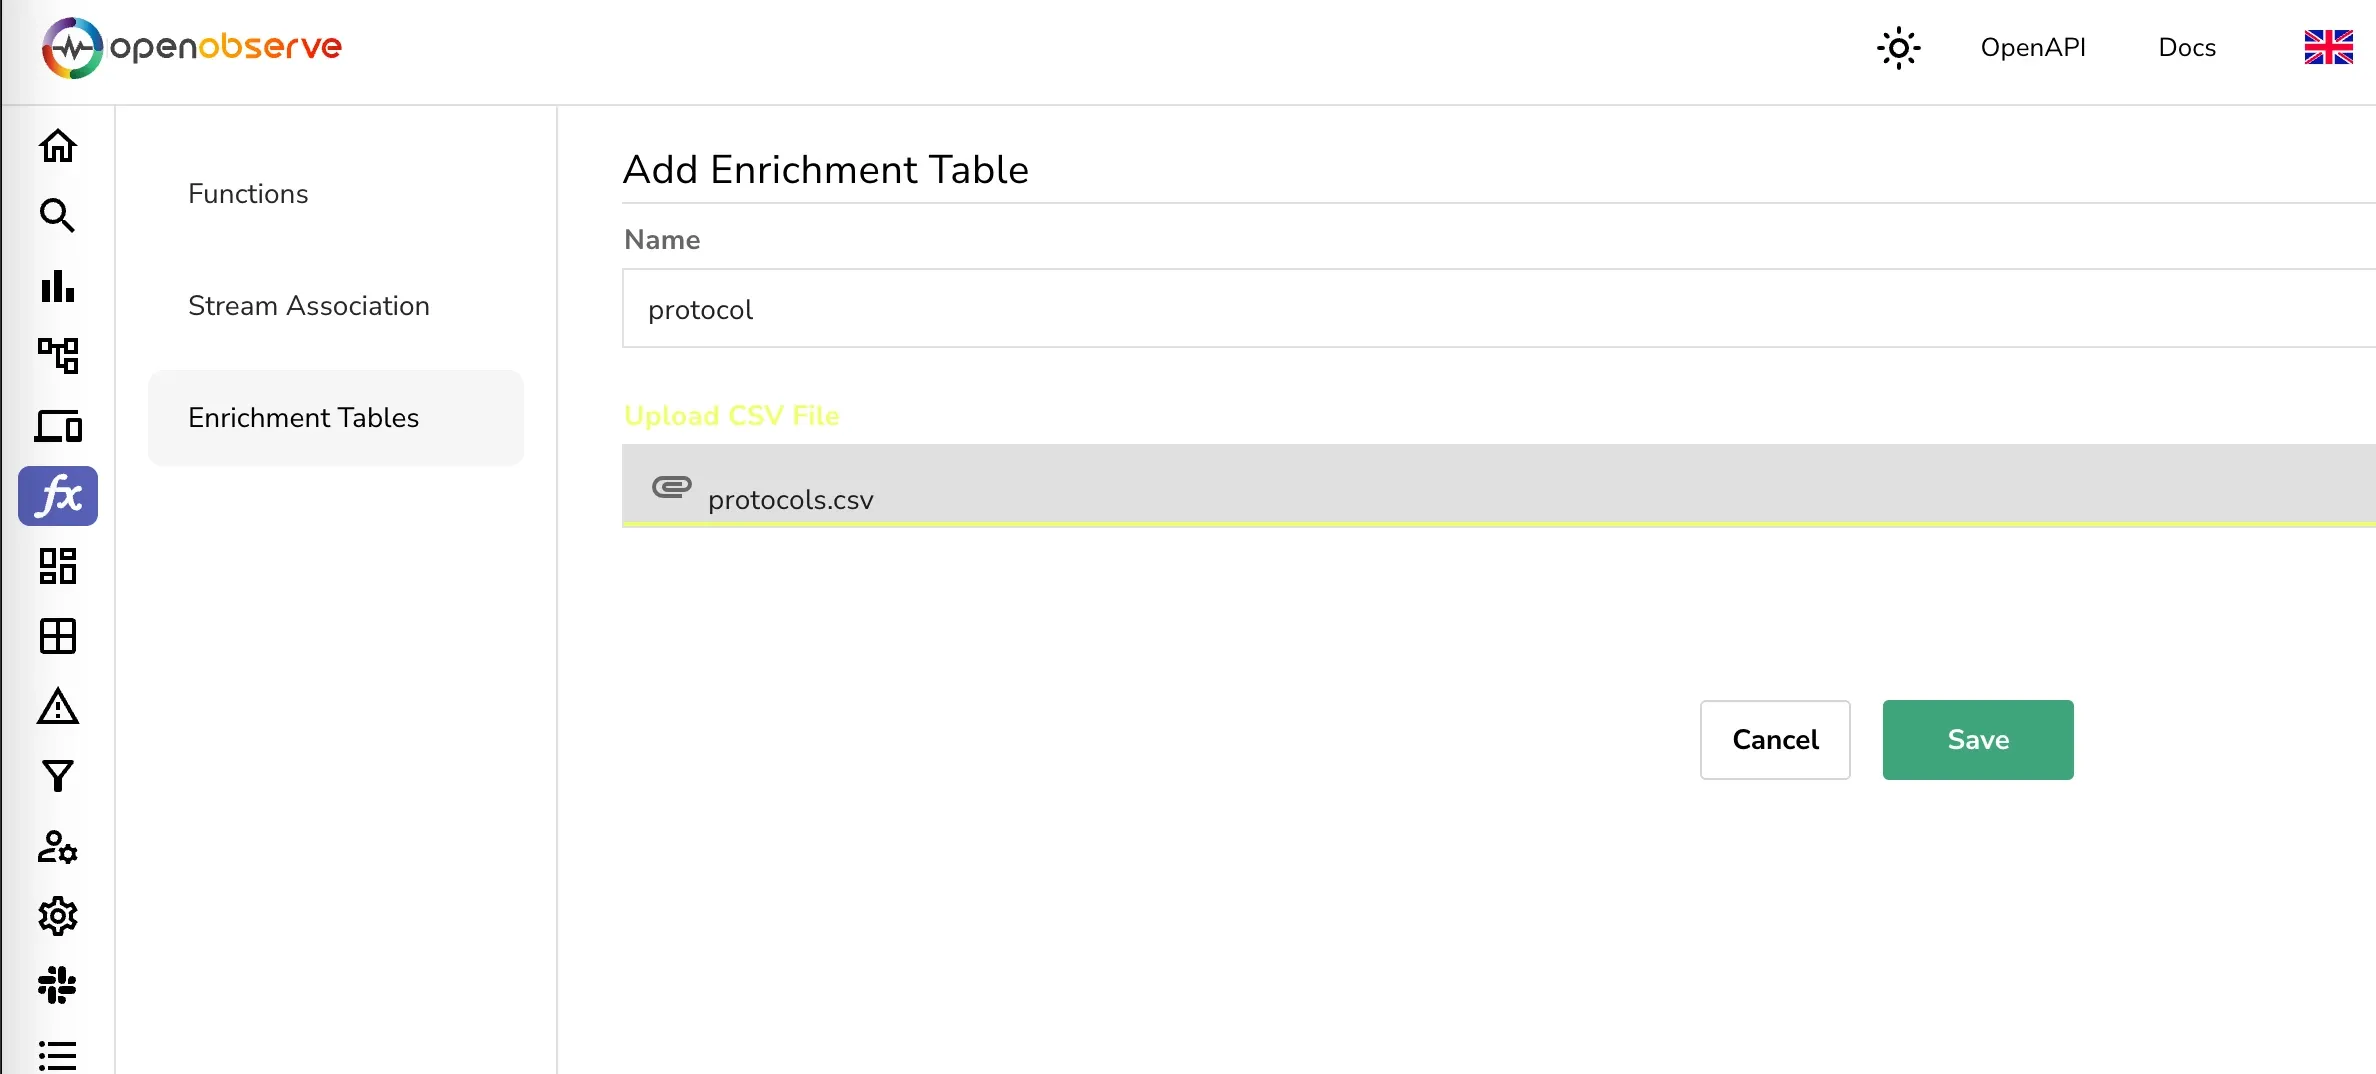
Once this is done you will be able to use this enrichment table in the next step to convert the protocol numbers to protocol names.
We will do the following processing on the logs:
We will use the VRL functions in OpenObserve to do this. Below is the VRL function that you can use to parse and enrich the logs.
. |= parse_aws_vpc_flow_log!(.message,"account_id action az_id bytes dstaddr dstport end flow_direction instance_id interface_id log_status packets pkt_dst_aws_service pkt_dstaddr pkt_src_aws_service pkt_srcaddr protocol region srcaddr srcport start sublocation_id sublocation_type subnet_id tcp_flags traffic_path type version vpc_id")
del(.message)
.dst_city, err = get_enrichment_table_record("maxmind_city", {"ip": .pkt_dstaddr })
.dst_asn, err = get_enrichment_table_record("maxmind_asn", {"ip": .pkt_dstaddr })
.src_city, err = get_enrichment_table_record("maxmind_city", {"ip": .pkt_srcaddr })
.src_asn, err = get_enrichment_table_record("maxmind_asn", {"ip": .pkt_srcaddr })
.protocol=get_enrichment_table_record!("protocol", {"number": to_string(.protocol)}).keyword
 .
This is how parsed log record will look like after you parse the log using the above VRL function:
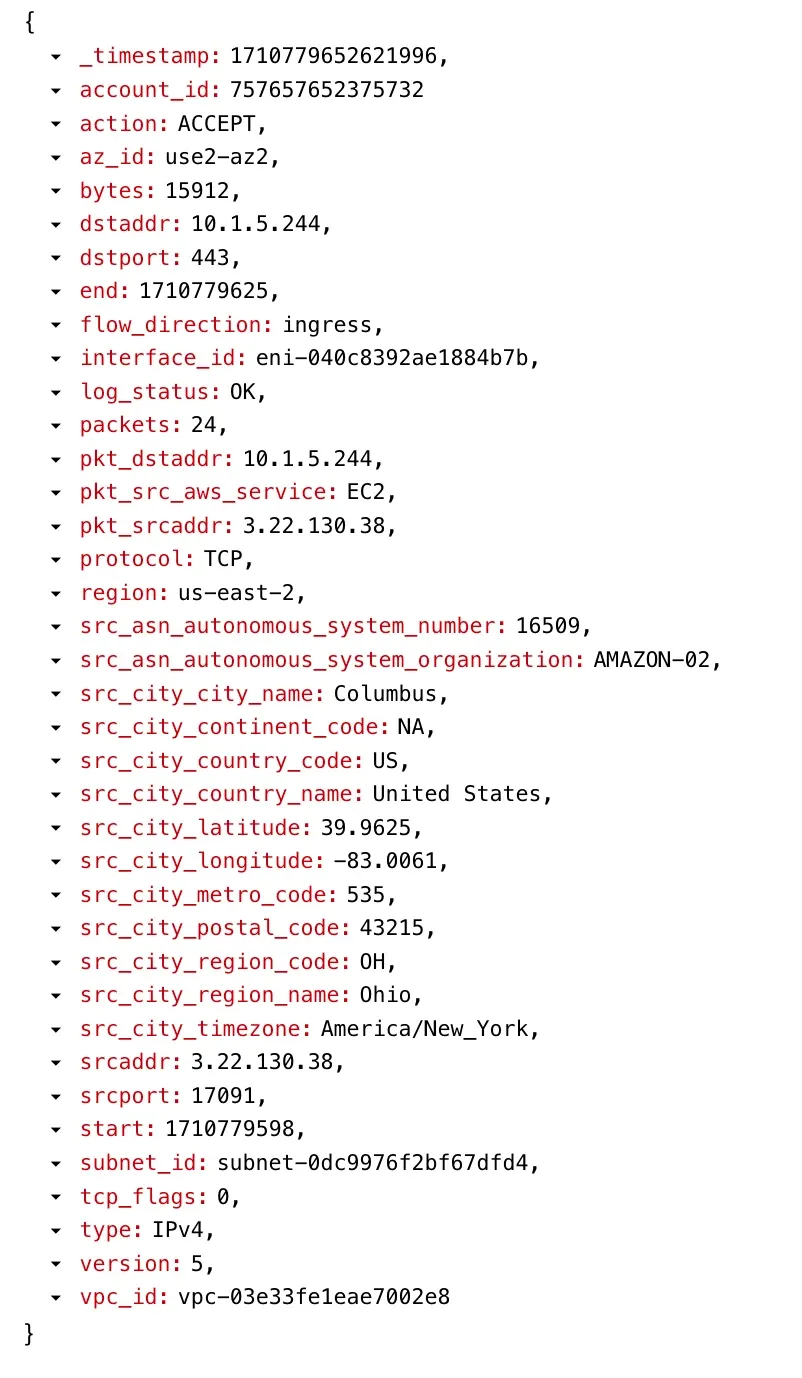
Make sure that you associate the the above VRL function with the stream vpcflowlog that you created in the first step. Associating the function with the stream will allow the function to be applied to the log records at the time of ingestion.
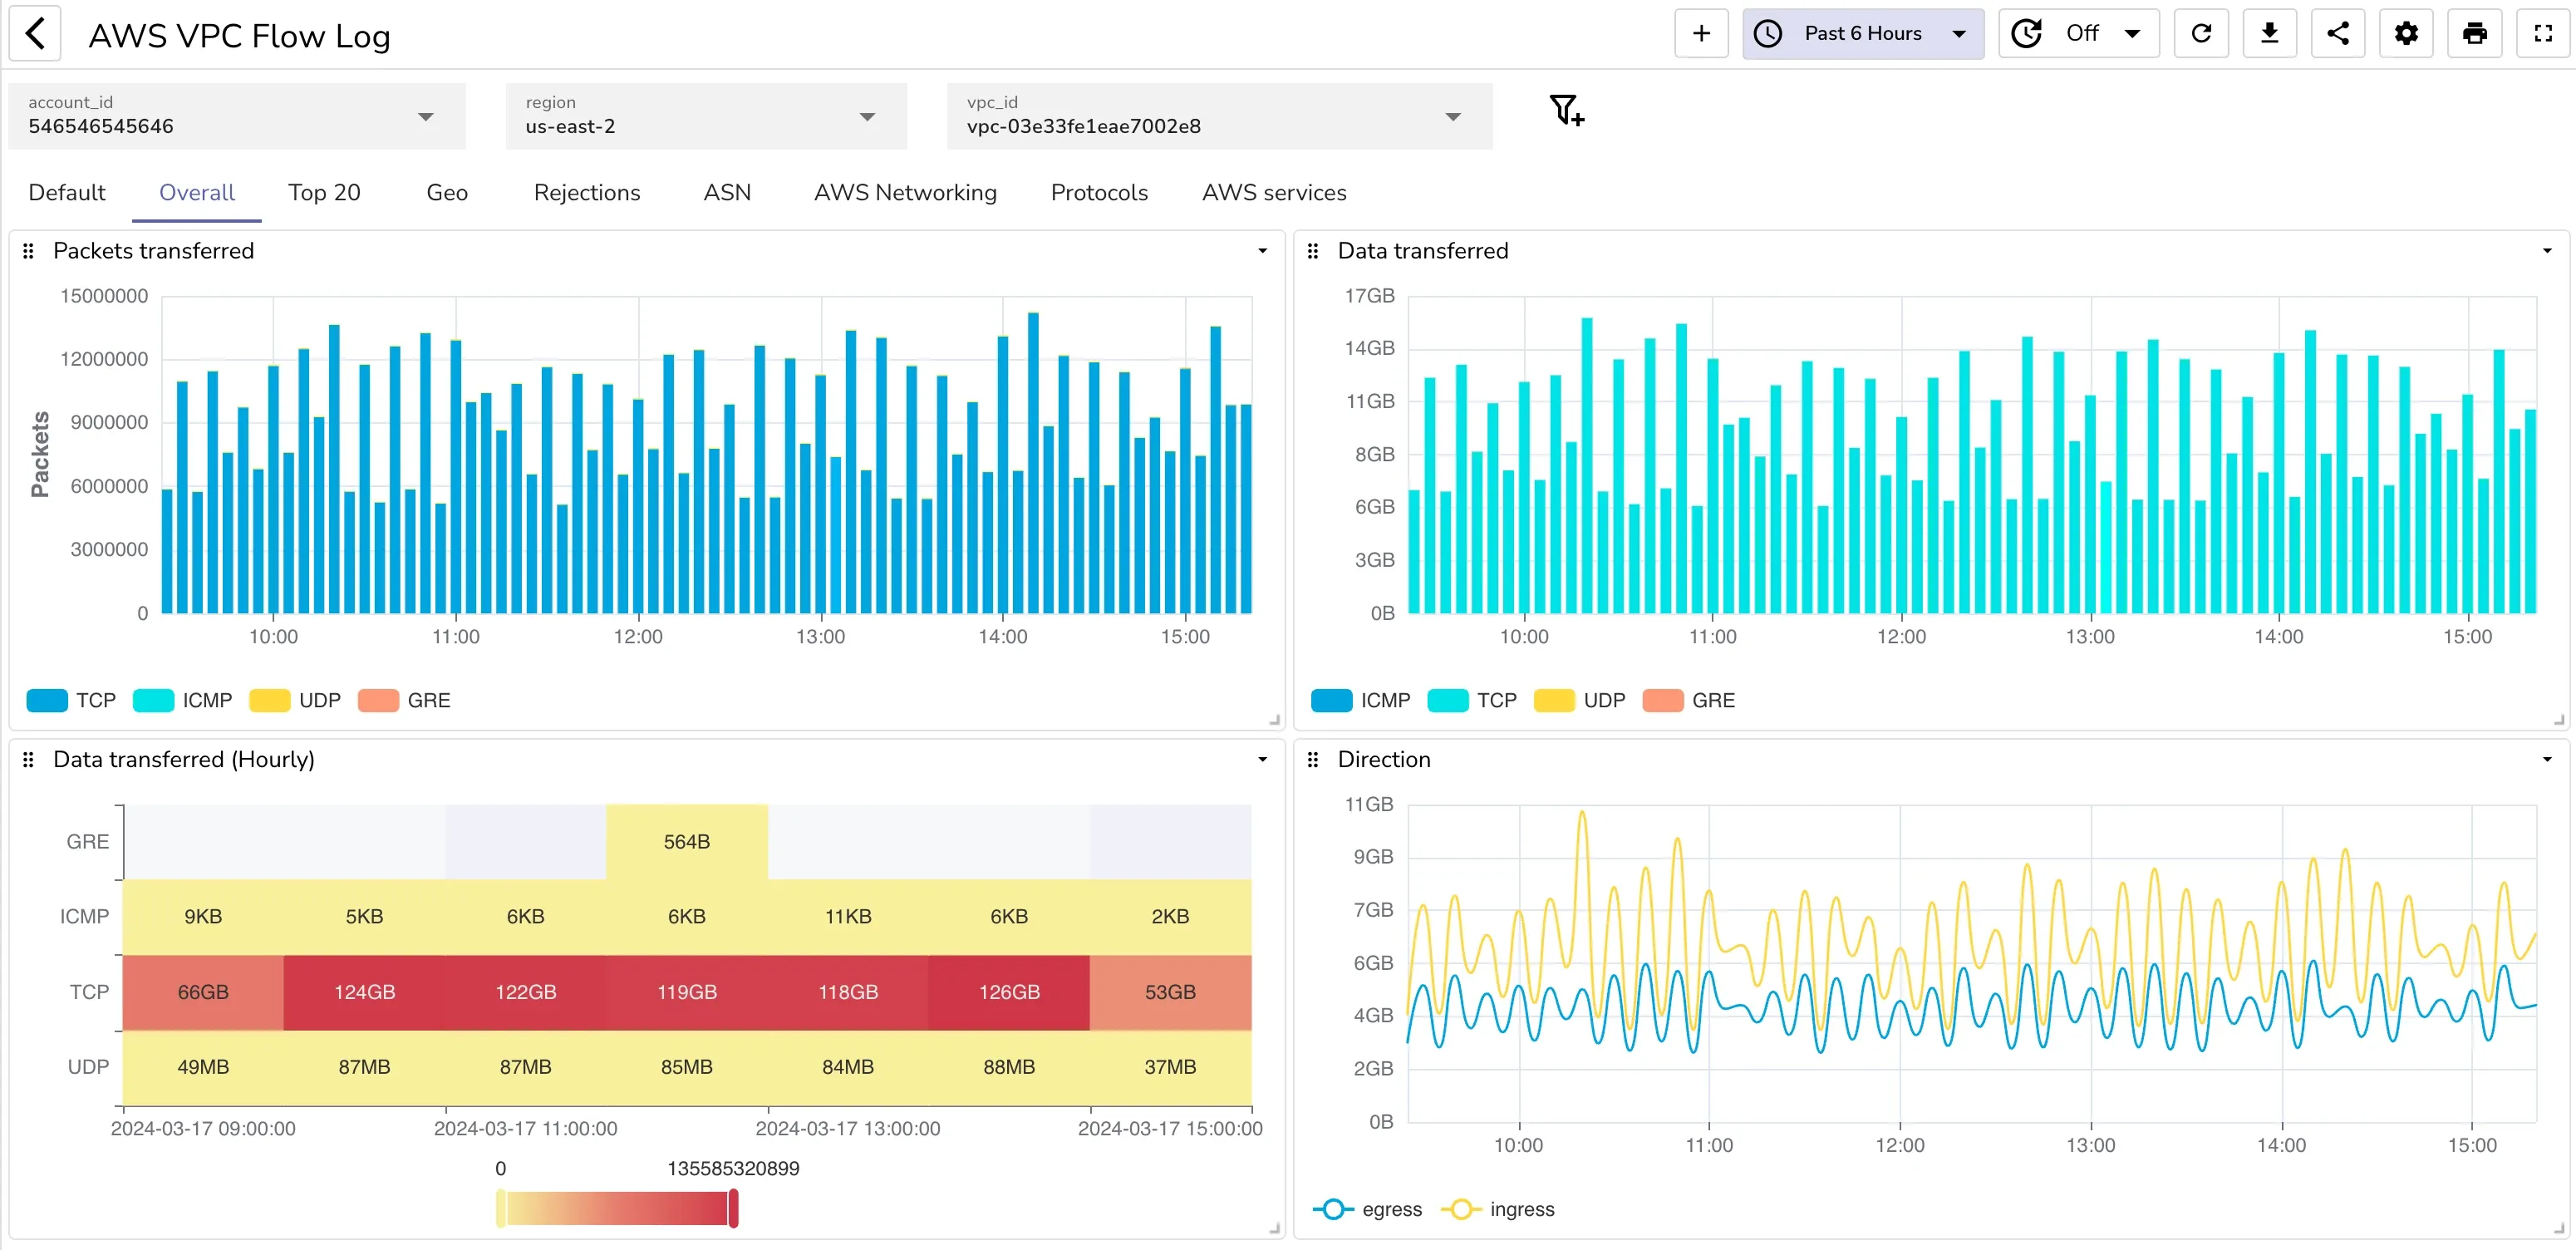
Now that the parsed data is available in OpenObserve you can create any number of dashboards to visualize the data.
The fastest way though is to use the existing dashboards from the OpenObserve dashboard repository. You can import the dashboards from the OpenObserve dashboard repository.
Here is how your dashboard might look like:
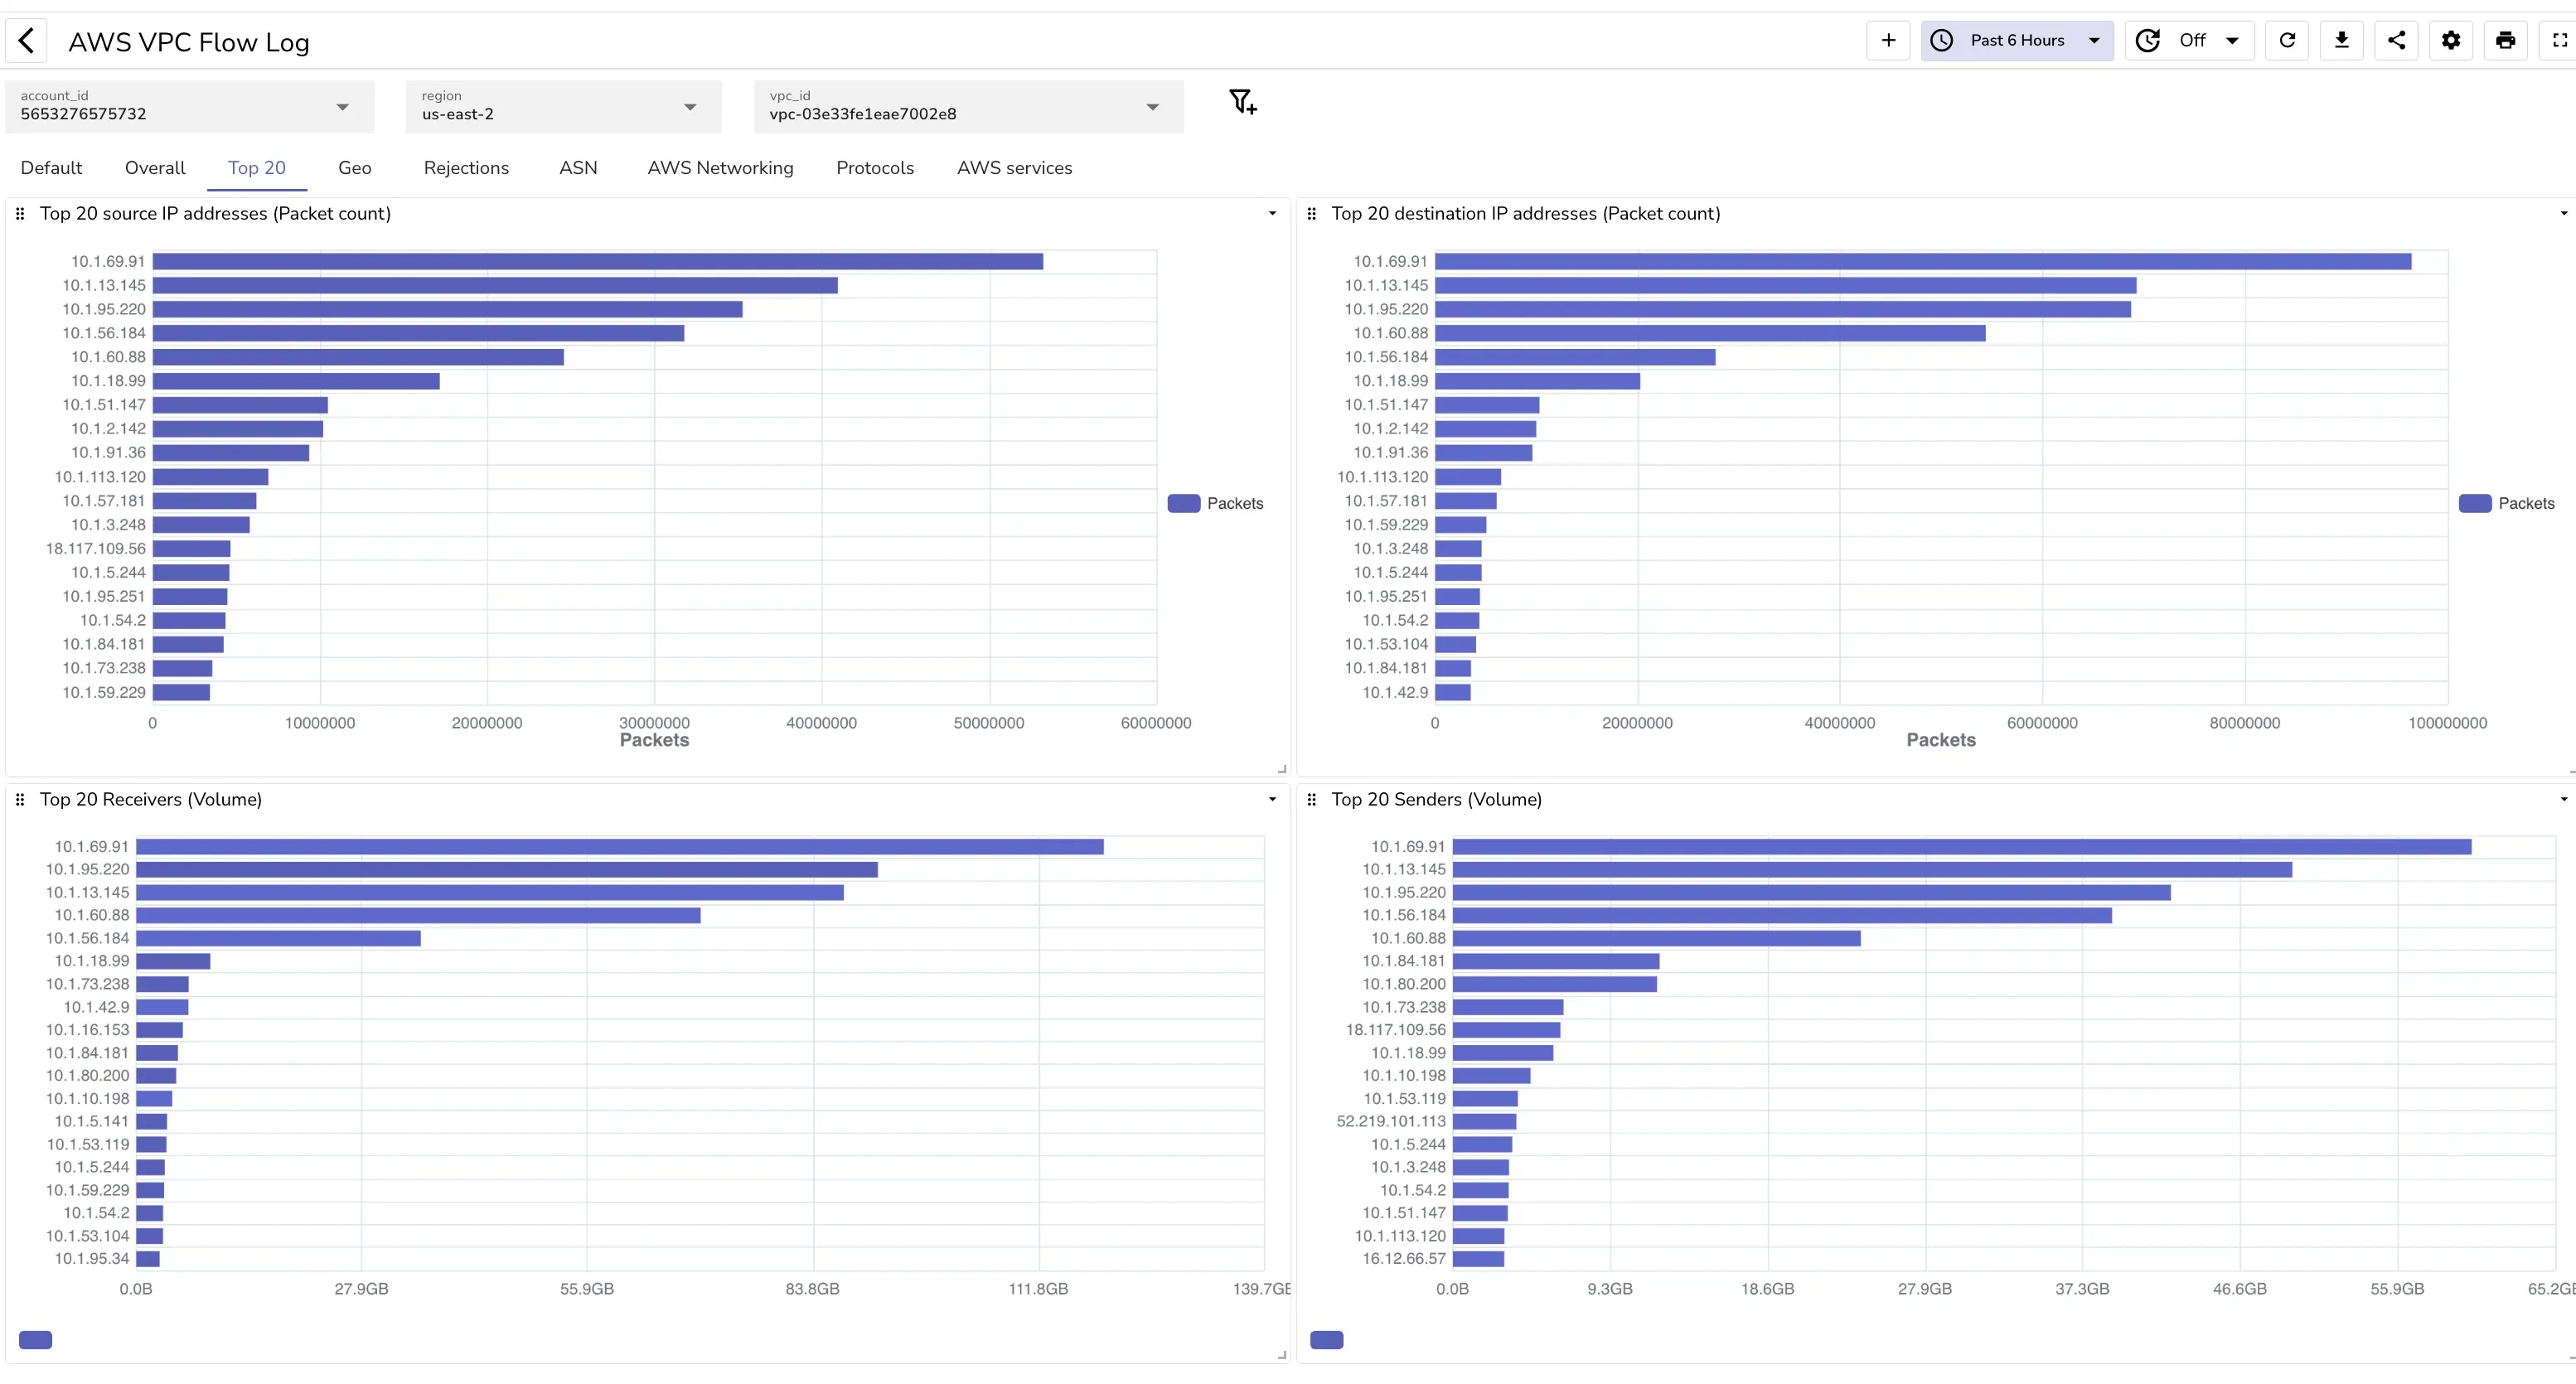
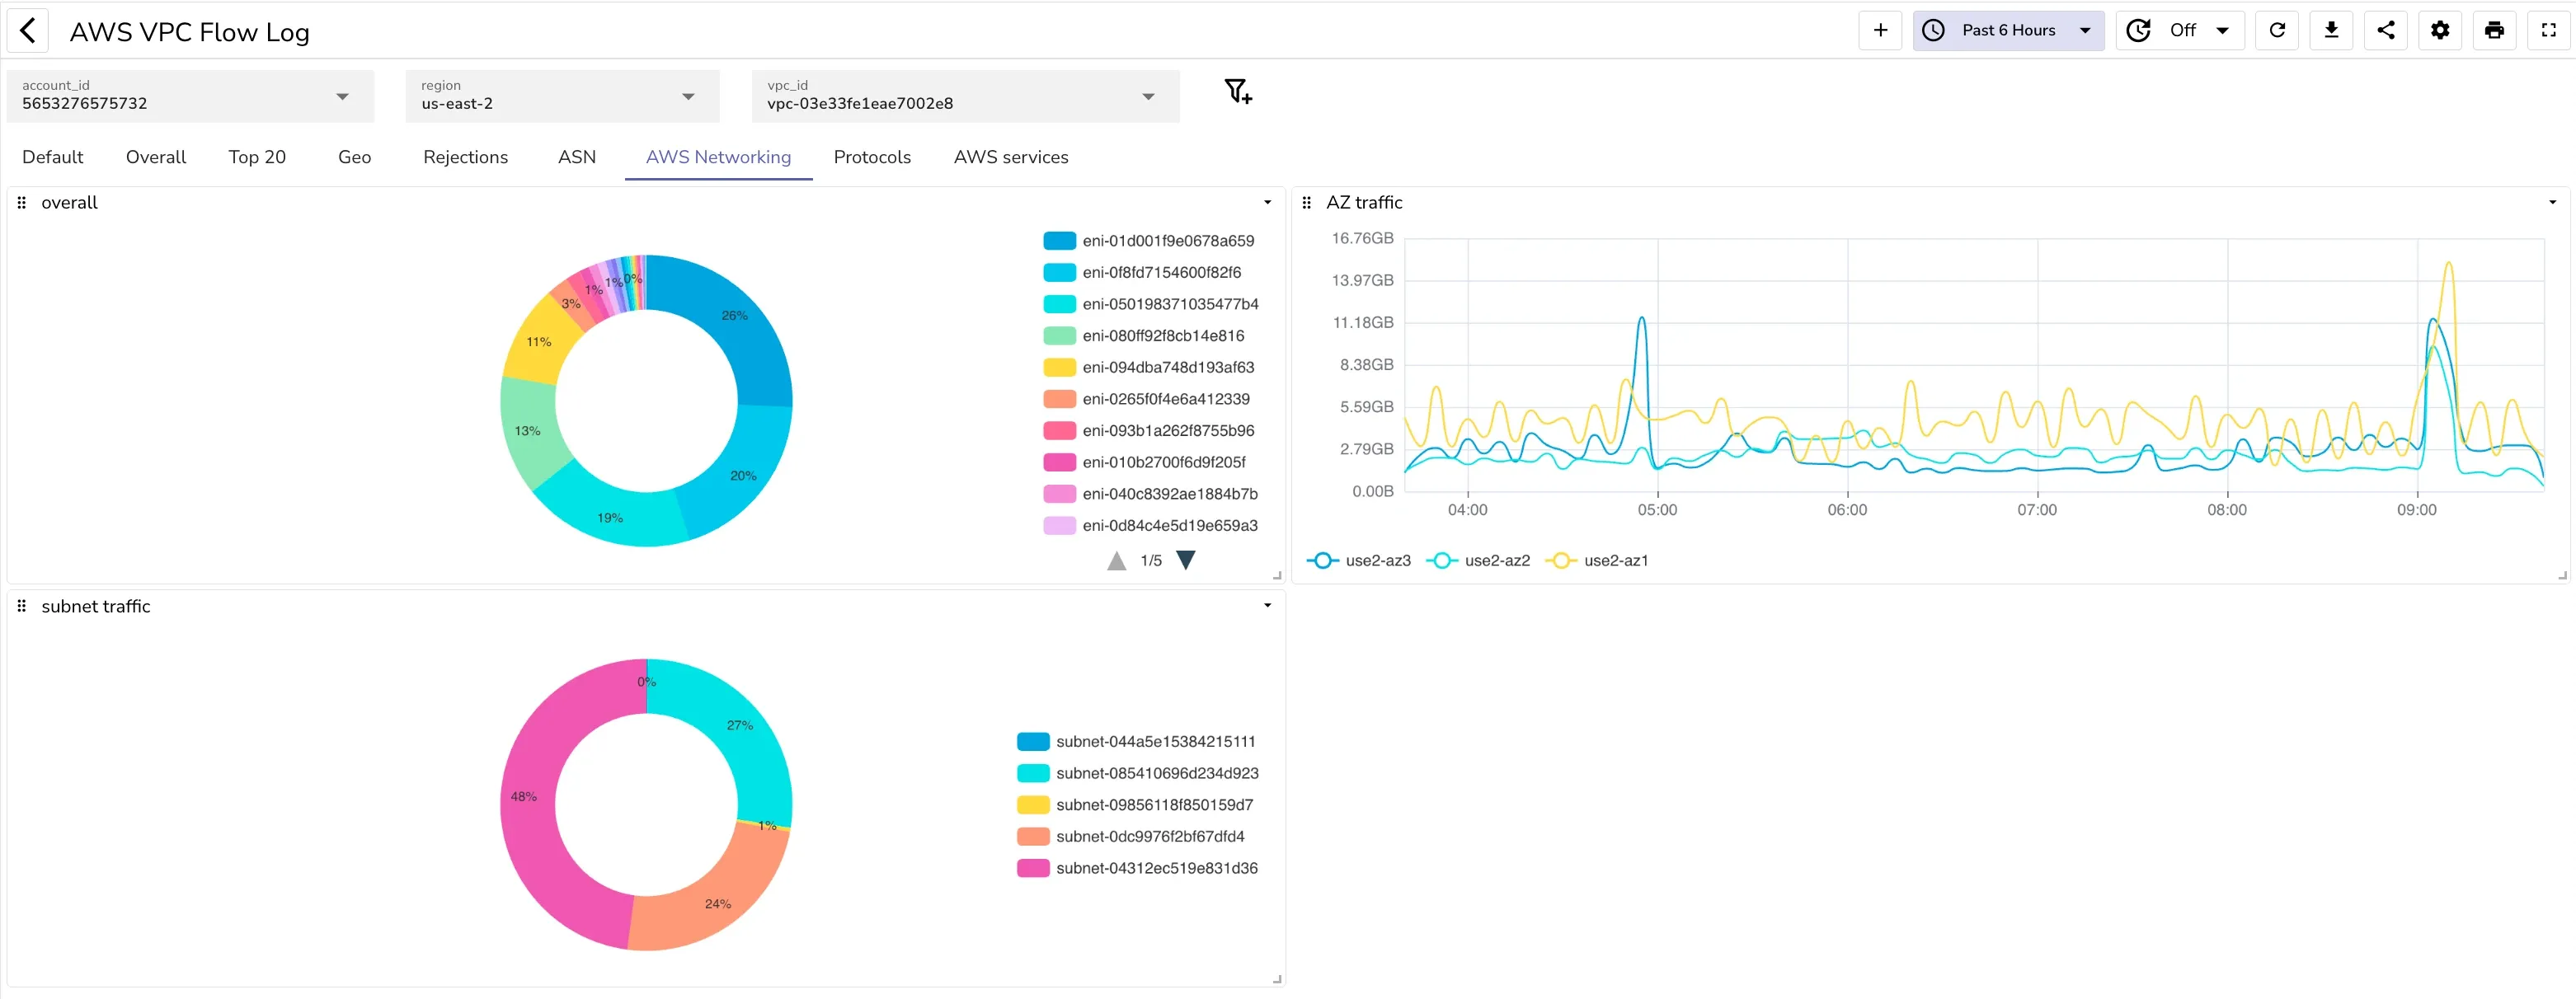
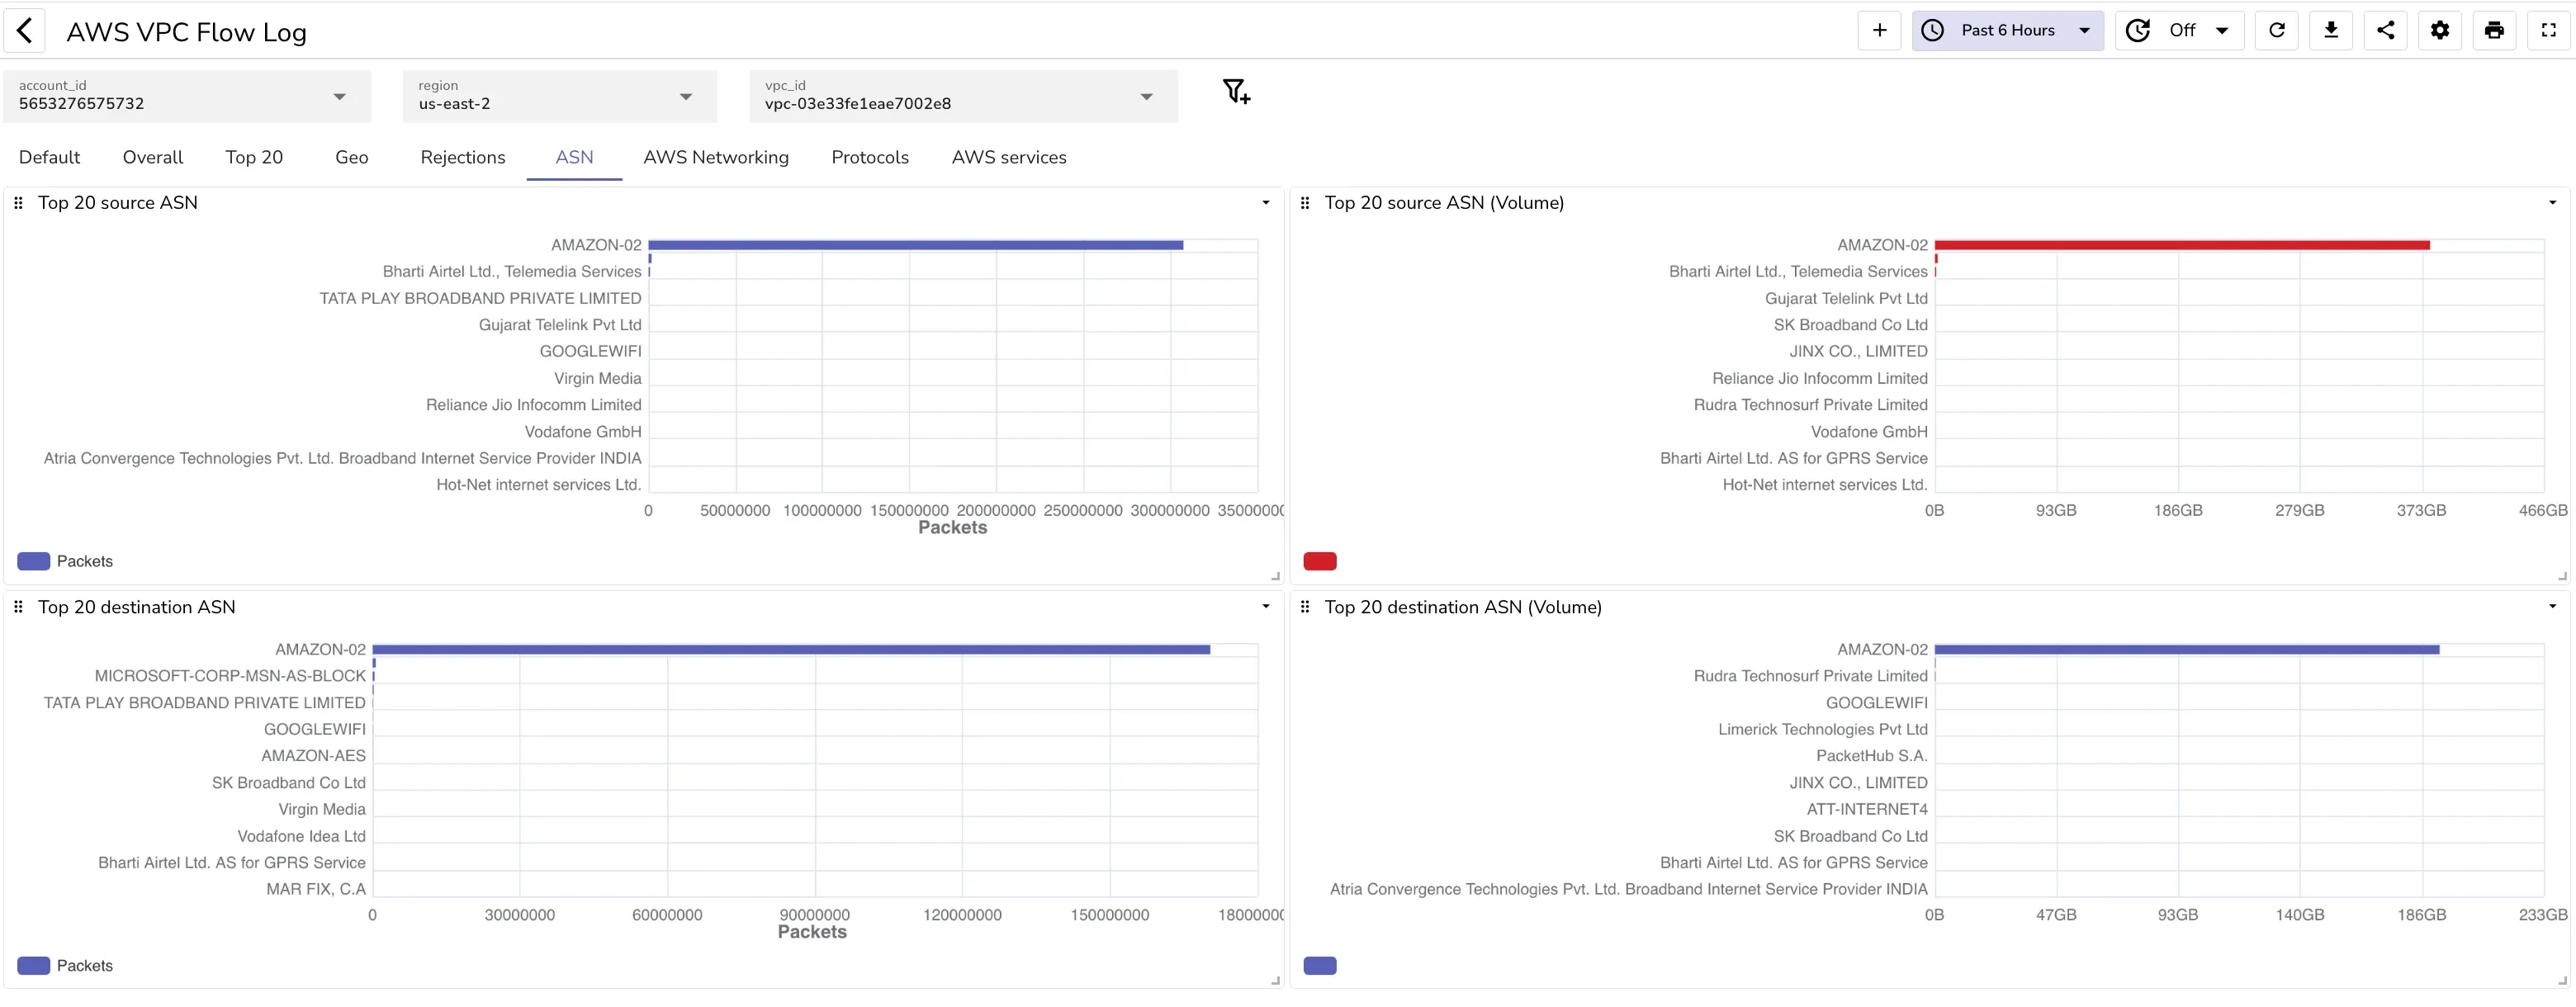
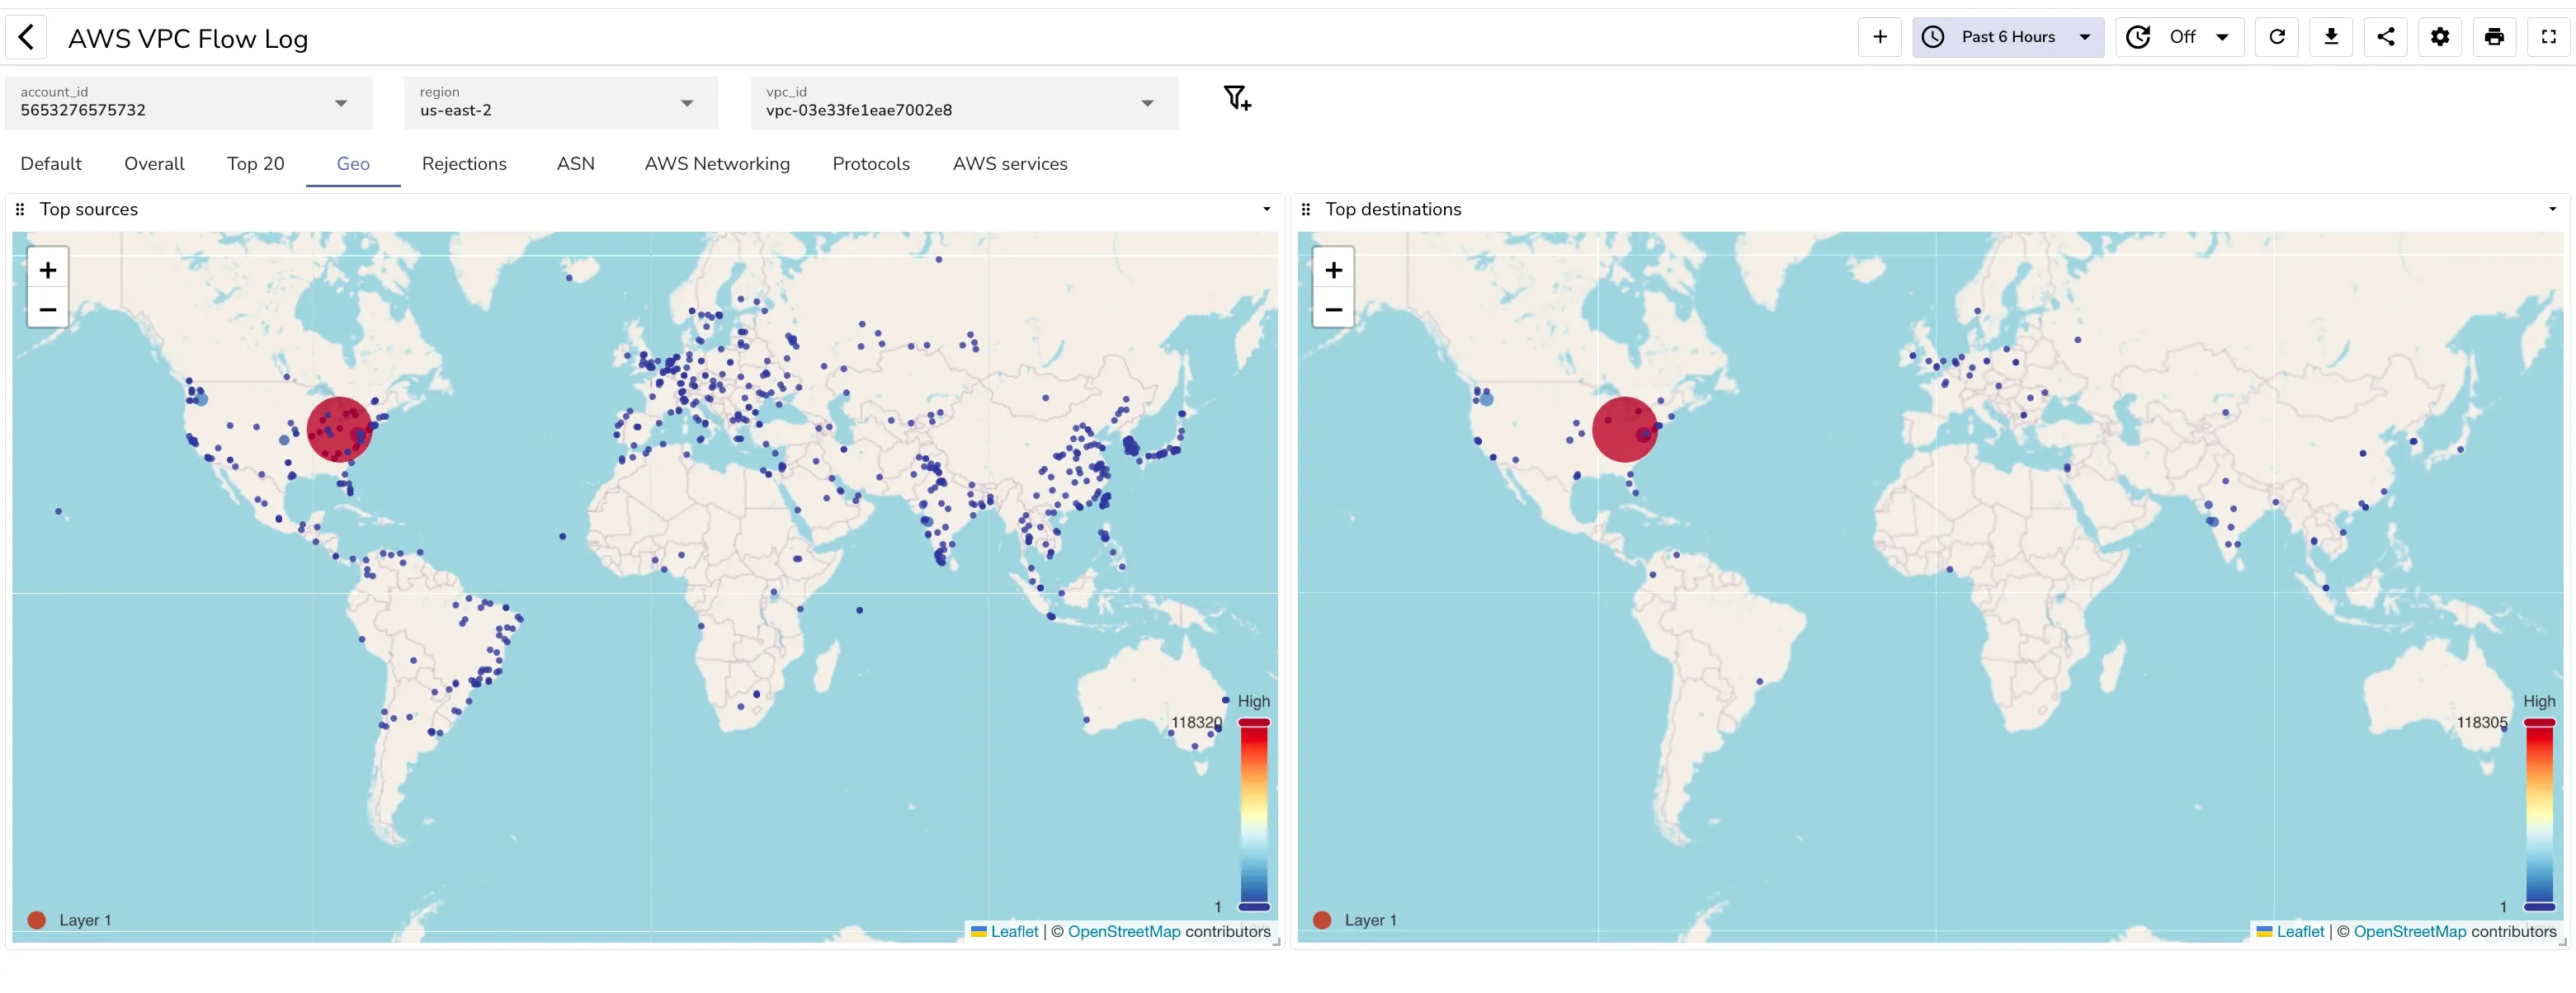
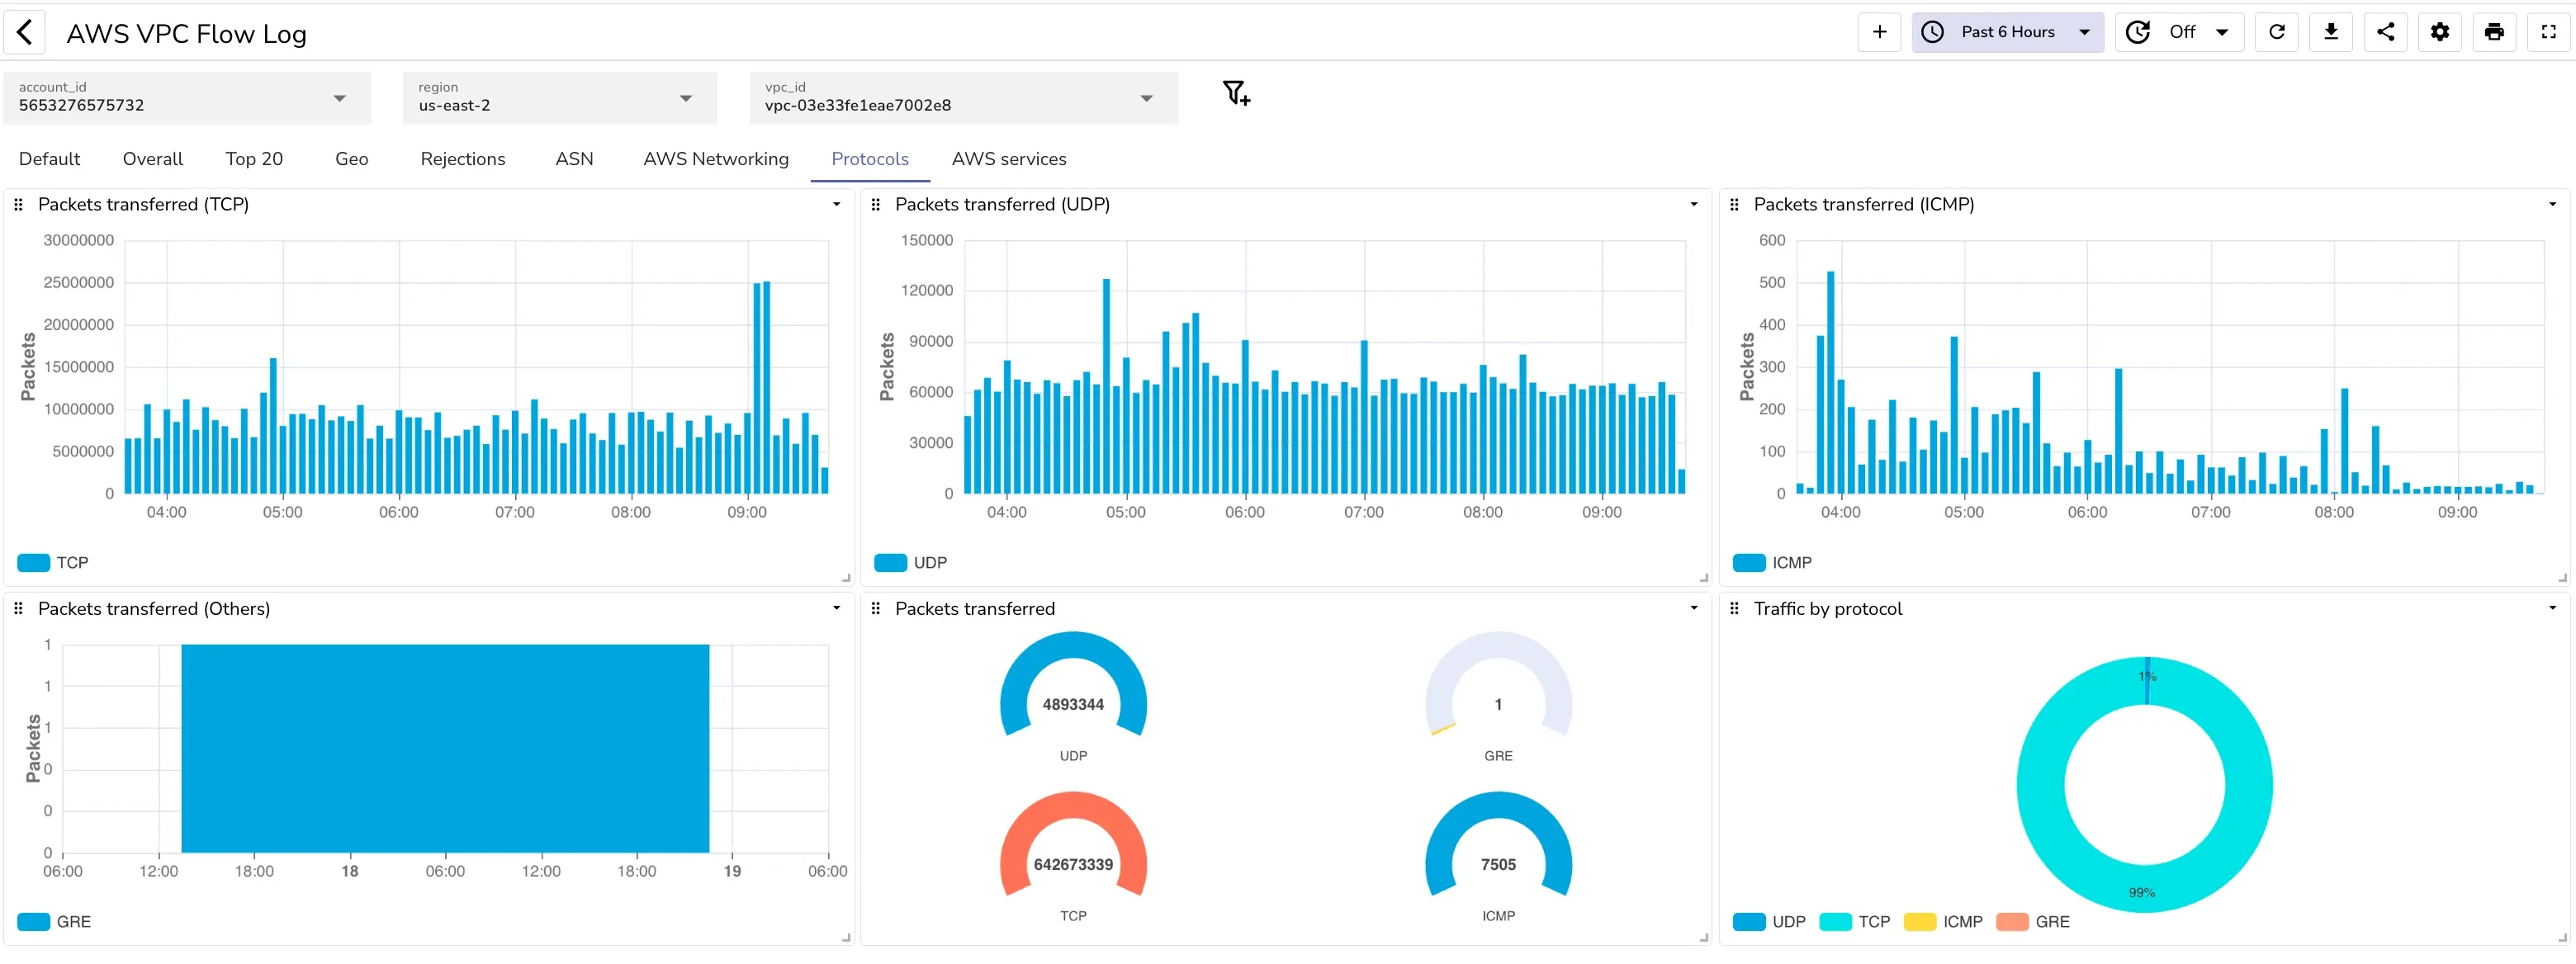
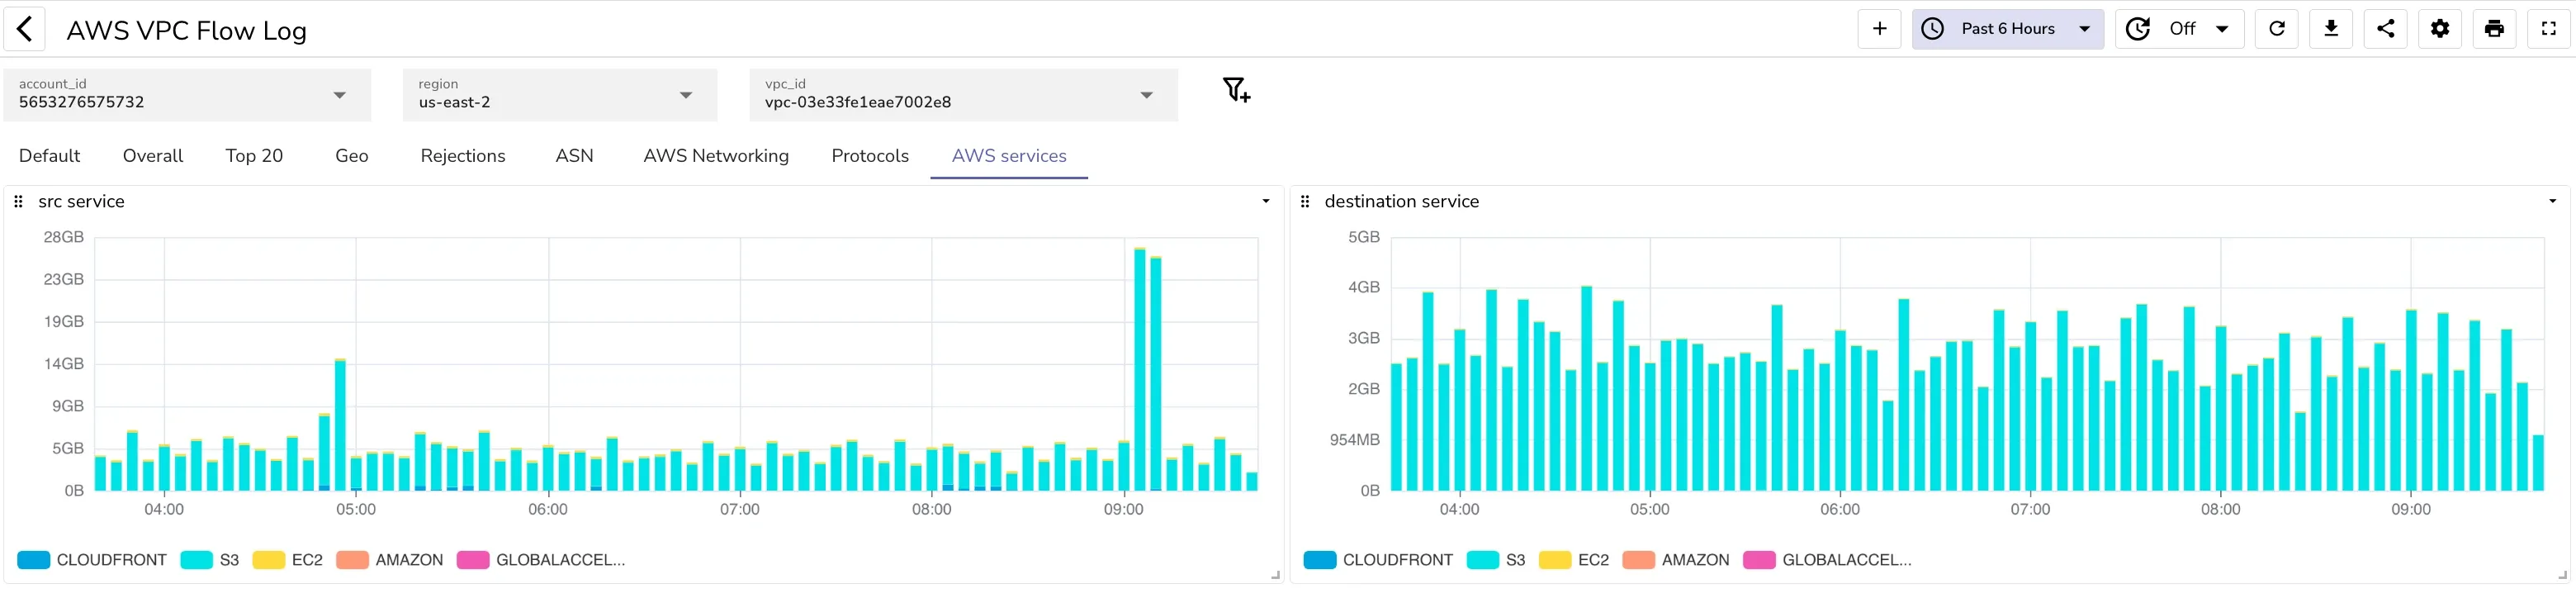
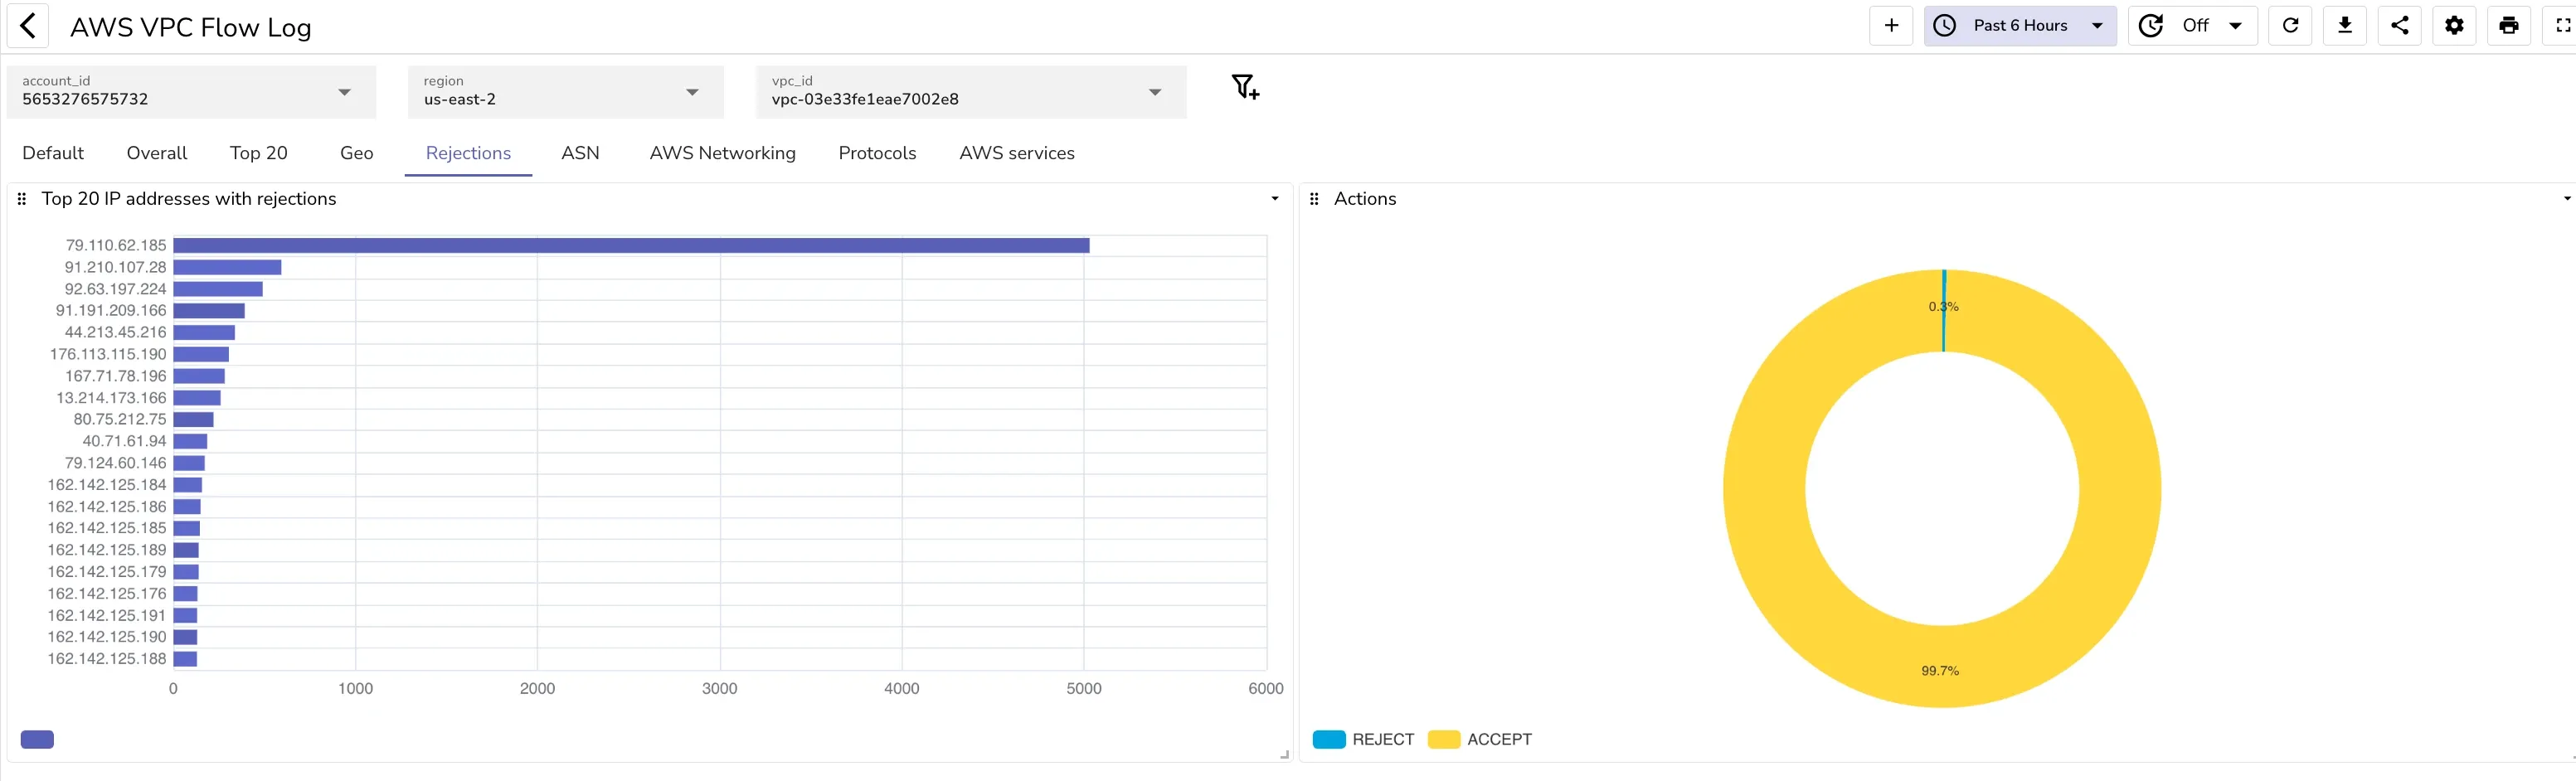
Now that everything is set up, you can analyze your logs:
Finally, you can set up alerts within OpenObserve to notify you of certain patterns or thresholds:
By following these steps, you can effectively capture all fields of AWS VPC Flow Logs and send them to OpenObserve for analysis. This setup will allow you to monitor your AWS environment closely, detect potential security threats, and optimize your network's performance. OpenObserve's Logs UI and Dashboards provide a powerful way to visualize and monitor your VPC traffic, turning raw data into actionable insights.
Prabhat Sharma is the founder of OpenObserve, bringing extensive expertise in cloud computing, Kubernetes, and observability. His interests also encompass machine learning, liberal arts, economics, and systems architecture. Outside of work, Prabhat enjoys spending quality time playing with his children.